$30 off During Our Annual Pro Sale. View Details »

Size of Datasets for Analytics and Implications for R - useR! conference, Stanford University - June 2016

szilard
June 23, 2016
1.3k

Size of Datasets for Analytics and Implications for R - useR! conference, Stanford University - June 2016

szilard

June 23, 2016
Tweet

More Decks by szilard

Transcript

  1. Size of Datasets for Analytics and
    Implications for R
    Szilárd Pafka, PhD
    Chief Scientist, Epoch
    useR! conference, Stanford University
    June 2016

    View Slide

  2. View Slide

  3. Disclaimer:
    I am not representing my employer (Epoch) in this talk
    I cannot confirm nor deny if Epoch is using any of the
    methods, tools, results etc. mentioned in this talk

    View Slide

  4. View Slide

  5. View Slide

  6. View Slide

  7. View Slide

  8. View Slide

  9. View Slide

  10. View Slide

  11. View Slide

  12. View Slide

  13. View Slide

  14. View Slide

  15. View Slide

  16. (largest data analyzed)

    View Slide

  17. (largest data analyzed)

    View Slide

  18. View Slide

  19. View Slide

  20. View Slide

  21. https://deads.gitbooks.io/paratext-bench/content/teaser.html June 2016

    View Slide

  22. Aggregation 100M rows 1M groups
    Join 100M rows x 1M rows
    time [s]
    time [s]

    View Slide

  23. Aggregation 100M rows 1M groups
    Join 100M rows x 1M rows
    time [s]
    time [s]
    Speedup 5 nodes:
    Hive 1.5x
    Spark 2x

    View Slide

  24. View Slide

  25. View Slide

  26. (largest data analyzed)

    View Slide

  27. (largest data analyzed)

    View Slide

  28. View Slide

  29. View Slide

  30. View Slide

  31. data size [M]
    training
    time [s]
    10x
    Gradient Boosting Machines

    View Slide

  32. View Slide

  33. View Slide

  34. linear tops off
    (data size)
    (accuracy)

    View Slide

  35. linear tops off
    more data & better algo
    (data size)
    (accuracy)

    View Slide

  36. linear tops off
    more data & better algo
    random forest on
    1% of data beats
    linear on all data
    (data size)
    (accuracy)

    View Slide

  37. linear tops off
    more data & better algo
    random forest on
    1% of data beats
    linear on all data
    (data size)
    (accuracy)

    View Slide

  38. View Slide

  39. View Slide

  40. View Slide

  41. View Slide

  42. View Slide

  43. View Slide

  44. View Slide

  45. Summary / Tips for analyzing “big” data:
    - Get lots 
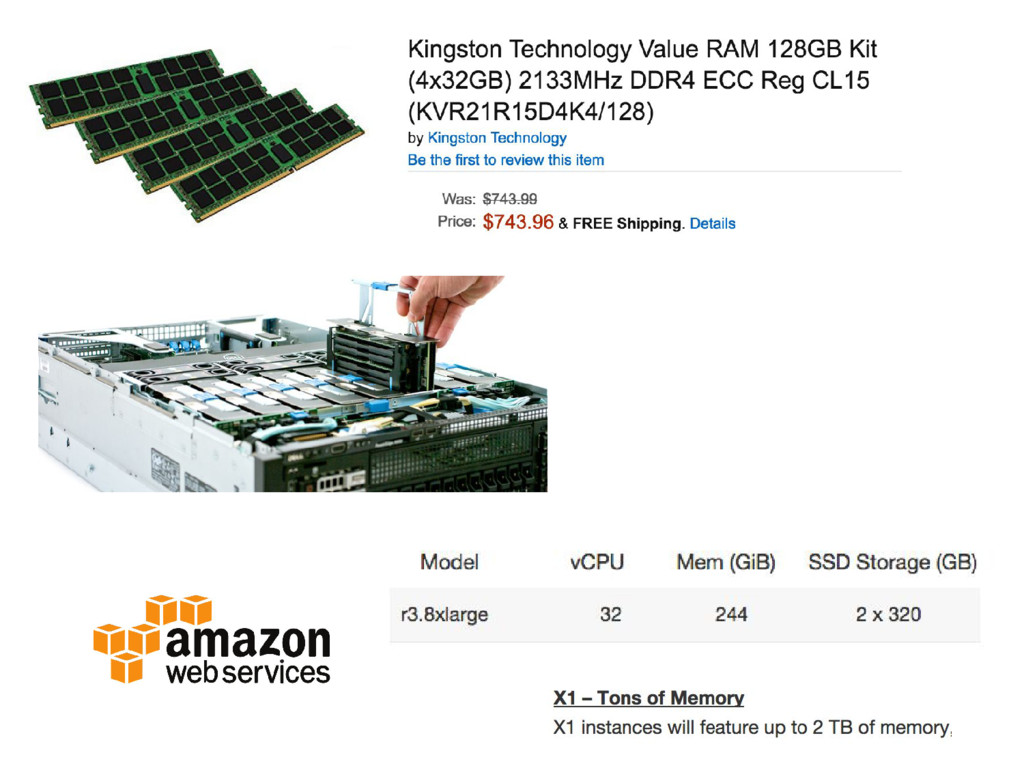
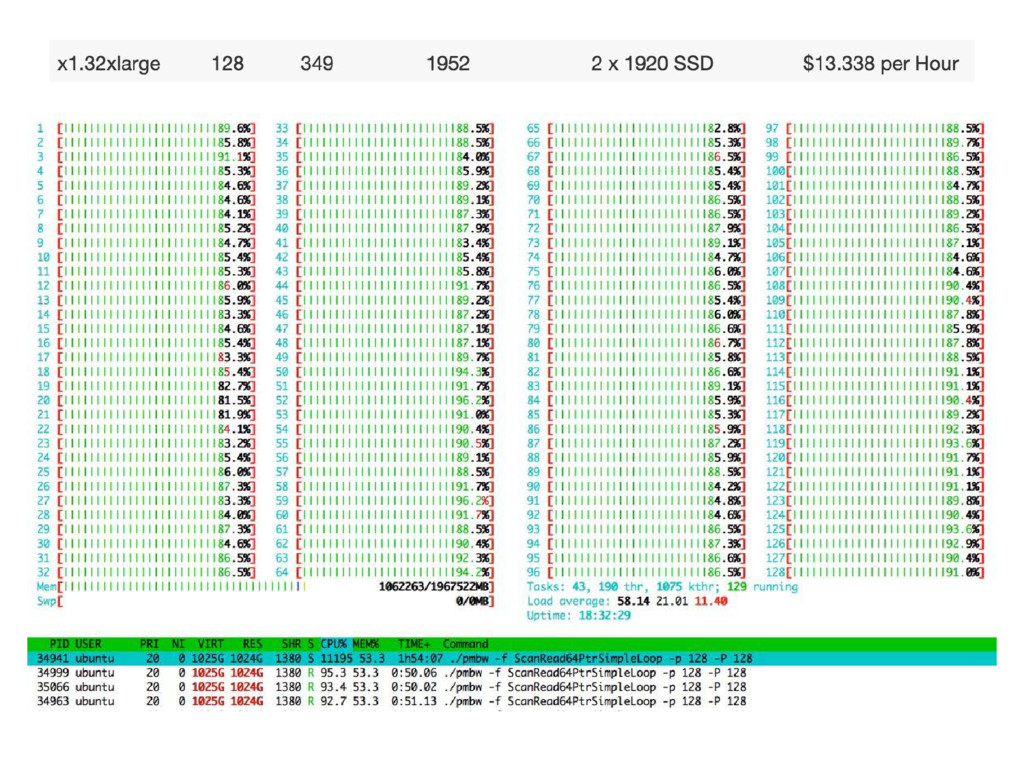
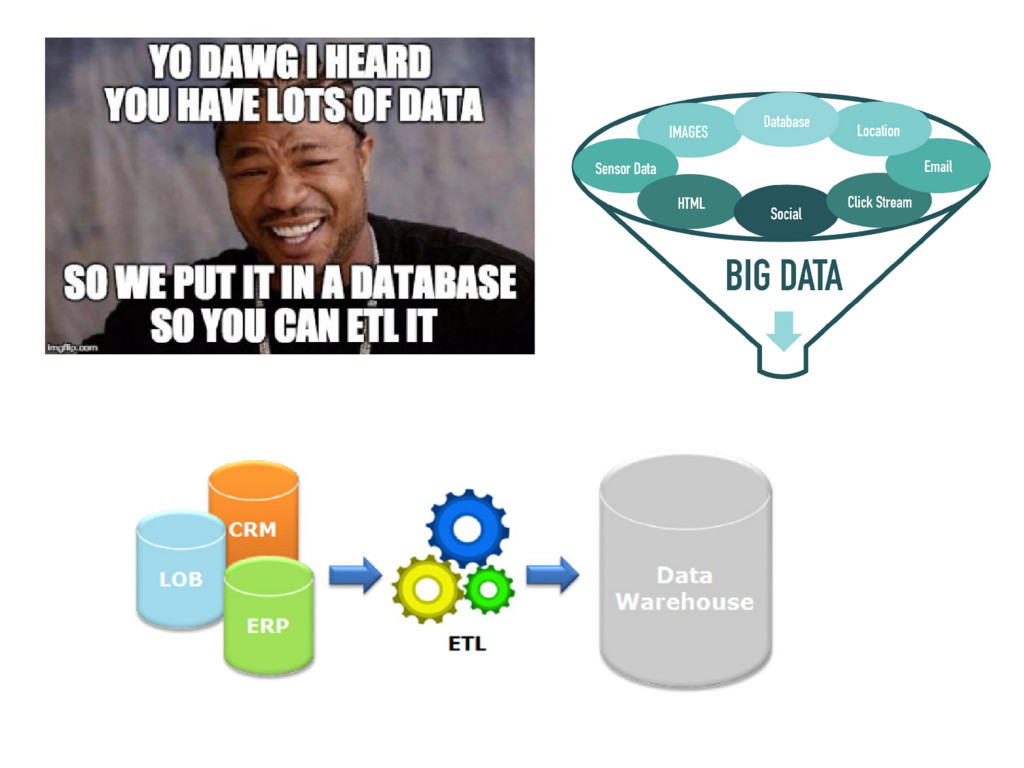
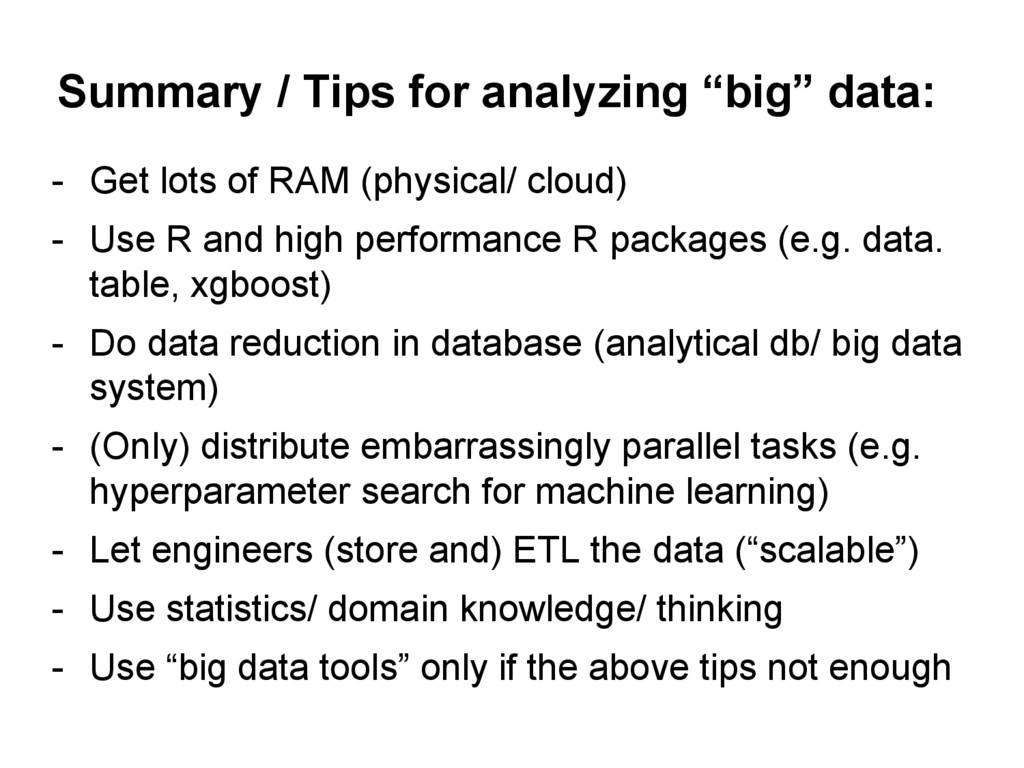
of RAM (physical/ cloud)
    - Use R and high performance R packages (e.g. data.
    table, xgboost)
    - Do data reduction in database (analytical db/ big data
    system)
    - (Only) distribute embarrassingly parallel tasks (e.g.
    hyperparameter search for machine learning)
    - Let engineers (store and) ETL the data (“scalable”)
    - Use statistics/ domain knowledge/ thinking
    - Use “big data tools” only if the above tips not enough

    View Slide

  46. View Slide