Upgrade to Pro — share decks privately, control downloads, hide ads and more …

PythonとTableauで福岡のオープンデータを可視化してみた。

Taka710
December 27, 2018

 PythonとTableauで福岡のオープンデータを可視化してみた。

Pydata.Fukuoka#1のLT資料

Taka710

December 27, 2018
Tweet

Other Decks in Technology

Transcript

  1. ࠓճ࢖͏΋ͷ • Python 3.6 • xlrd ɿexcelϑΝΠϧΛಡΈॻ͖͢ΔPKG • gspread ɿgoogle

    spreadΛಡΈॻ͖͢ΔPKG • Tableau PublicʢDesktopʣ • ηϧϑBIπʔϧ • ແྉ൛ • Tableau PublicαΠτʹ͔͠อଘ͕Ͱ͖ͳ͍
  2. 2.excelϑΝΠϧΛಡΈࠐΈ • ਓޱͷΦʔϓϯσʔλͷ͏ͪෆཁͳσʔλΛ আ֎ͯ͠ಡΈࠐΈ • ࢢ΍܊͸ɺ۠΍ொΛར༻͢ΔͨΊεΩοϓ • for i in

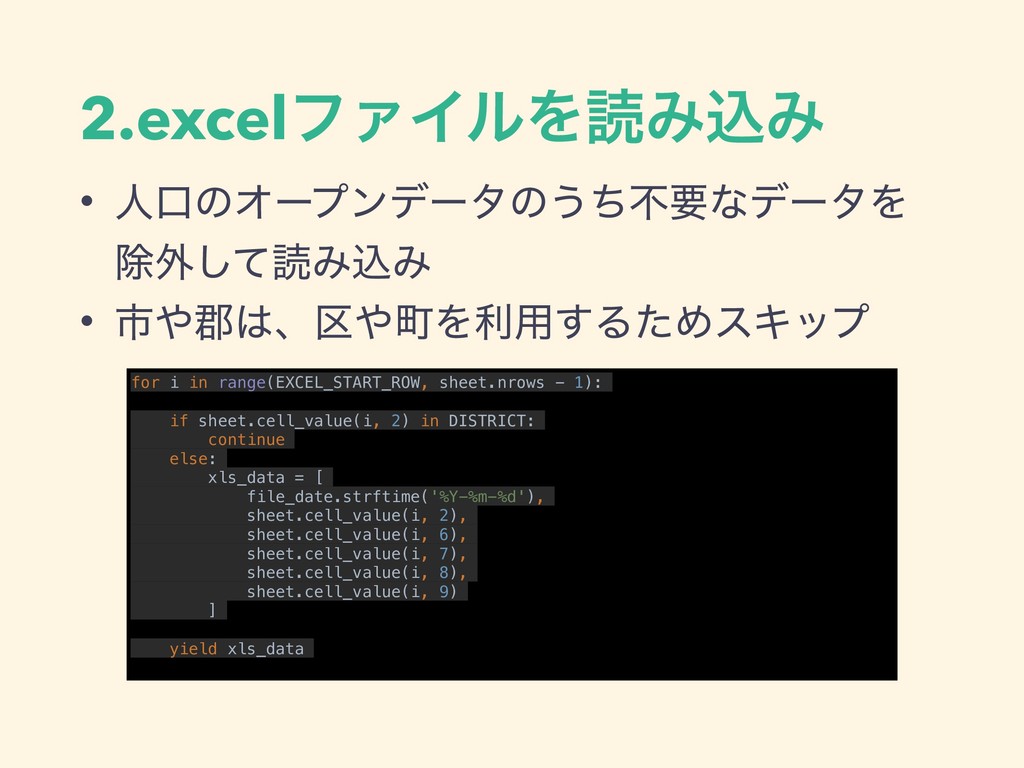
    range(EXCEL_START_ROW, sheet.nrows - 1): if sheet.cell_value(i, 2) in DISTRICT: continue else: xls_data = [ file_date.strftime('%Y-%m-%d'), sheet.cell_value(i, 2), sheet.cell_value(i, 6), sheet.cell_value(i, 7), sheet.cell_value(i, 8), sheet.cell_value(i, 9) ] yield xls_data
  3. 3.google_spreadʹొ࿥ • γʔτ໊Λࢦఆͯ͠εϓϨουΛΦʔϓϯ • ྻຖʹεϓϨουΛߋ৽ google_sheet = gc.open(‘fukuoka_open_data').sheet1 ɾɾɾ for

    index, record in enumerate(get_xlsx_data(path)): cell_list = google_sheet.range(index + s_row, 1, index + s_row, len(record)) for cell, val in zip(cell_list, record): cell.value = val google_sheet.update_cells(cell_list) next_row = index + s_row + 1