Upgrade to Pro — share decks privately, control downloads, hide ads and more …

Engineering tools for making smarter decisions

Engineering tools for making smarter decisions

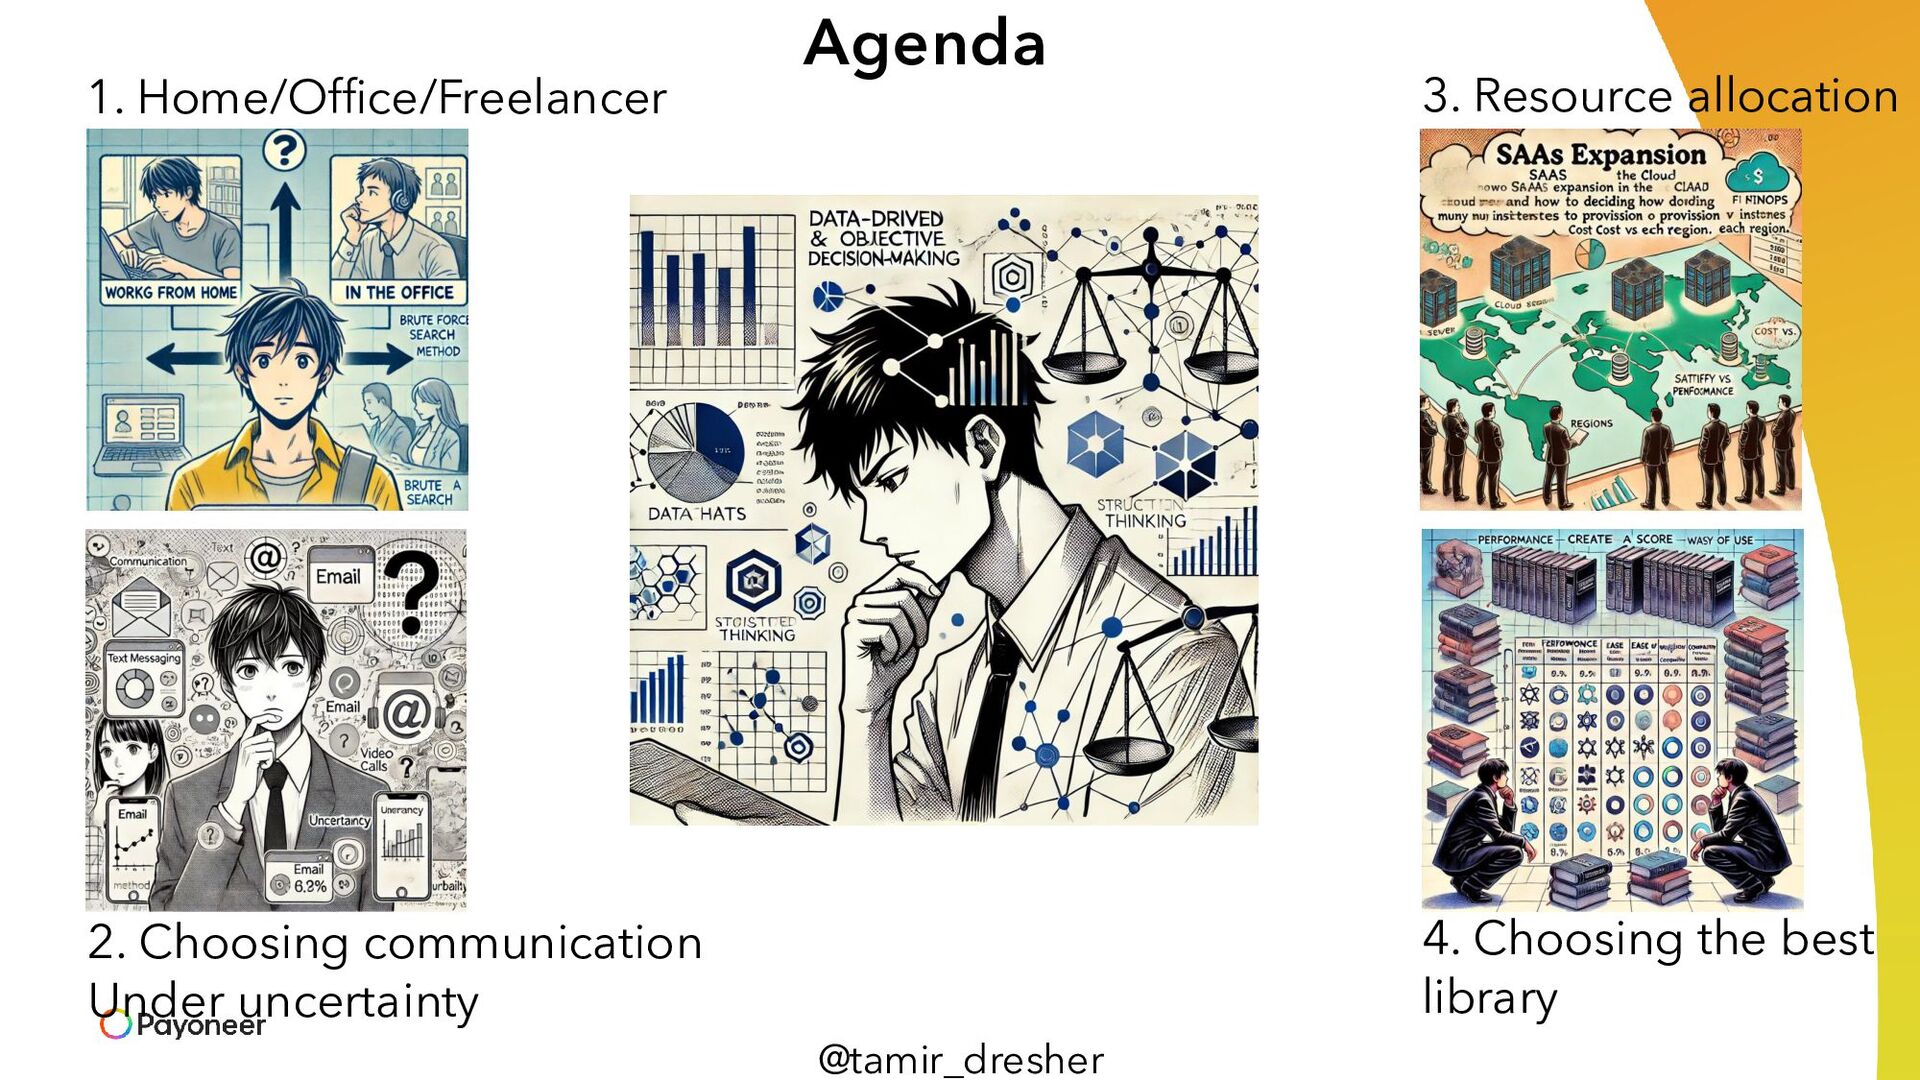
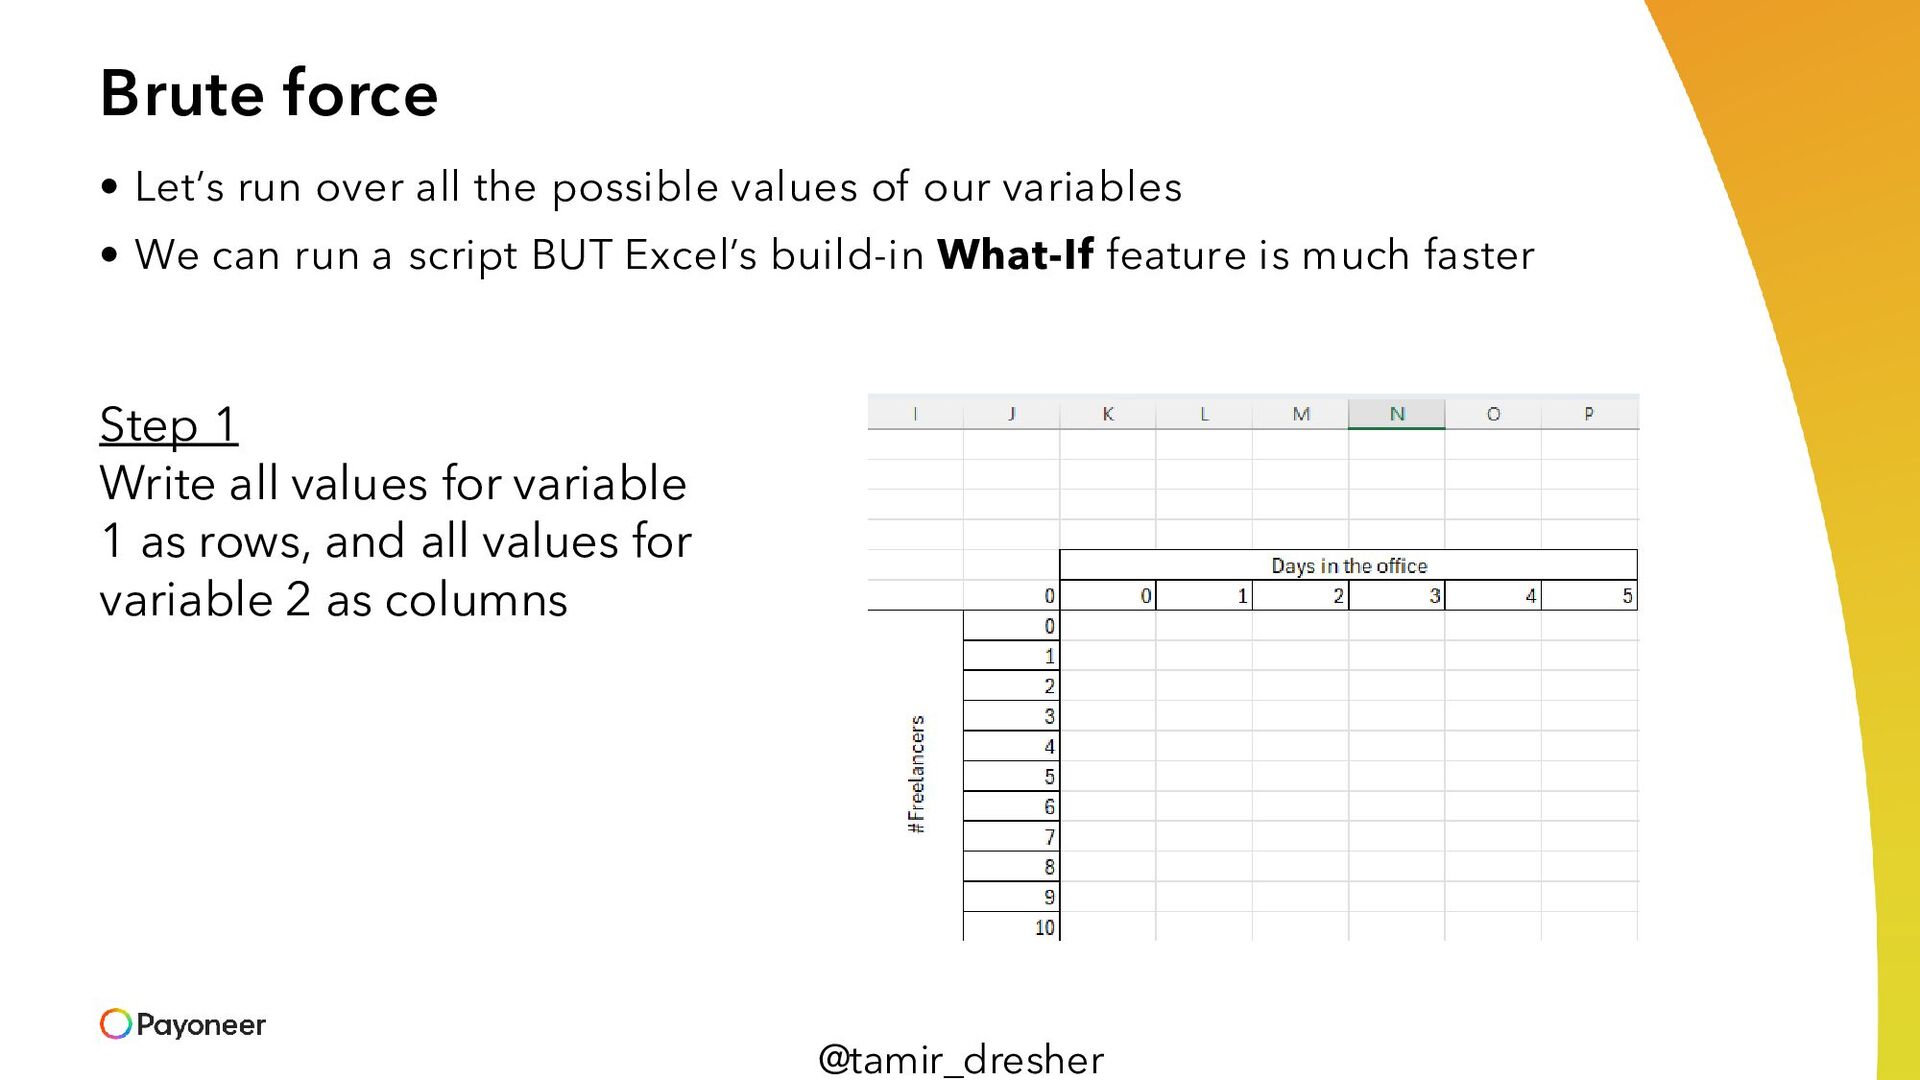
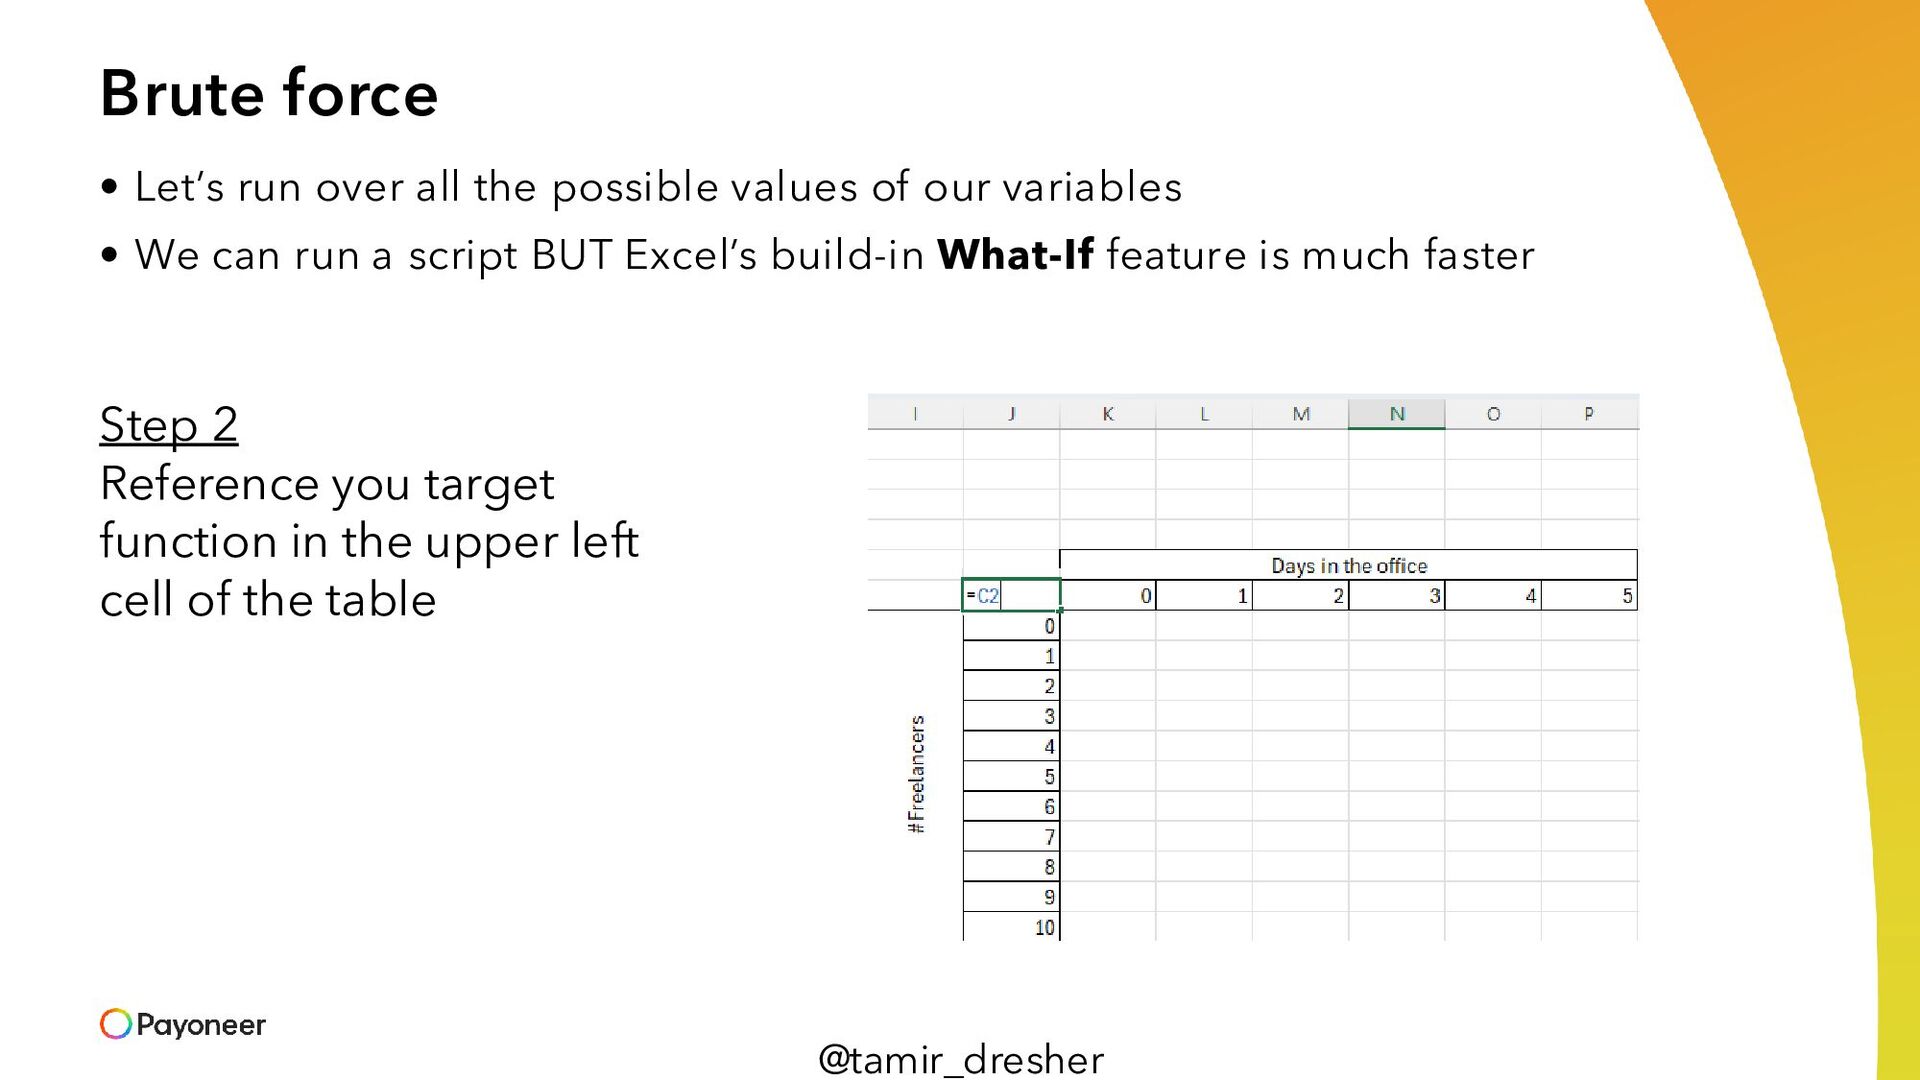
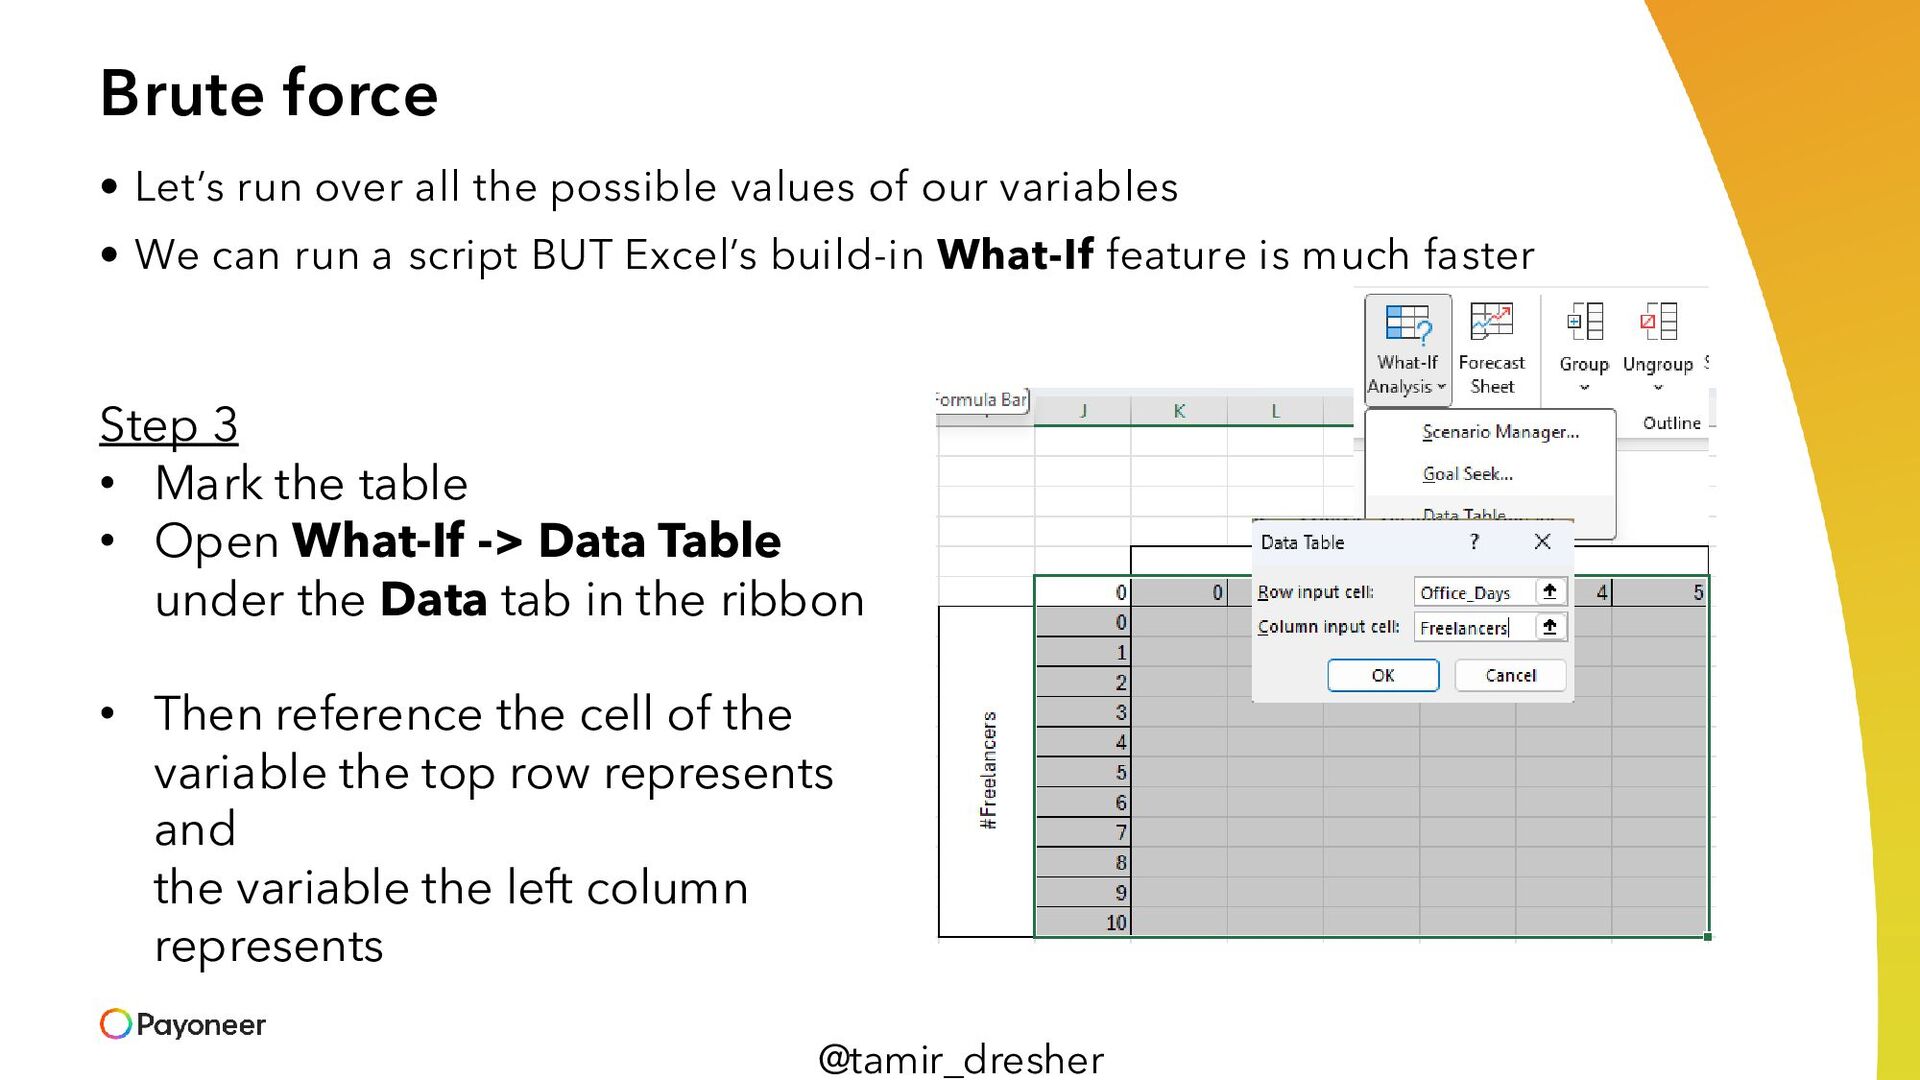
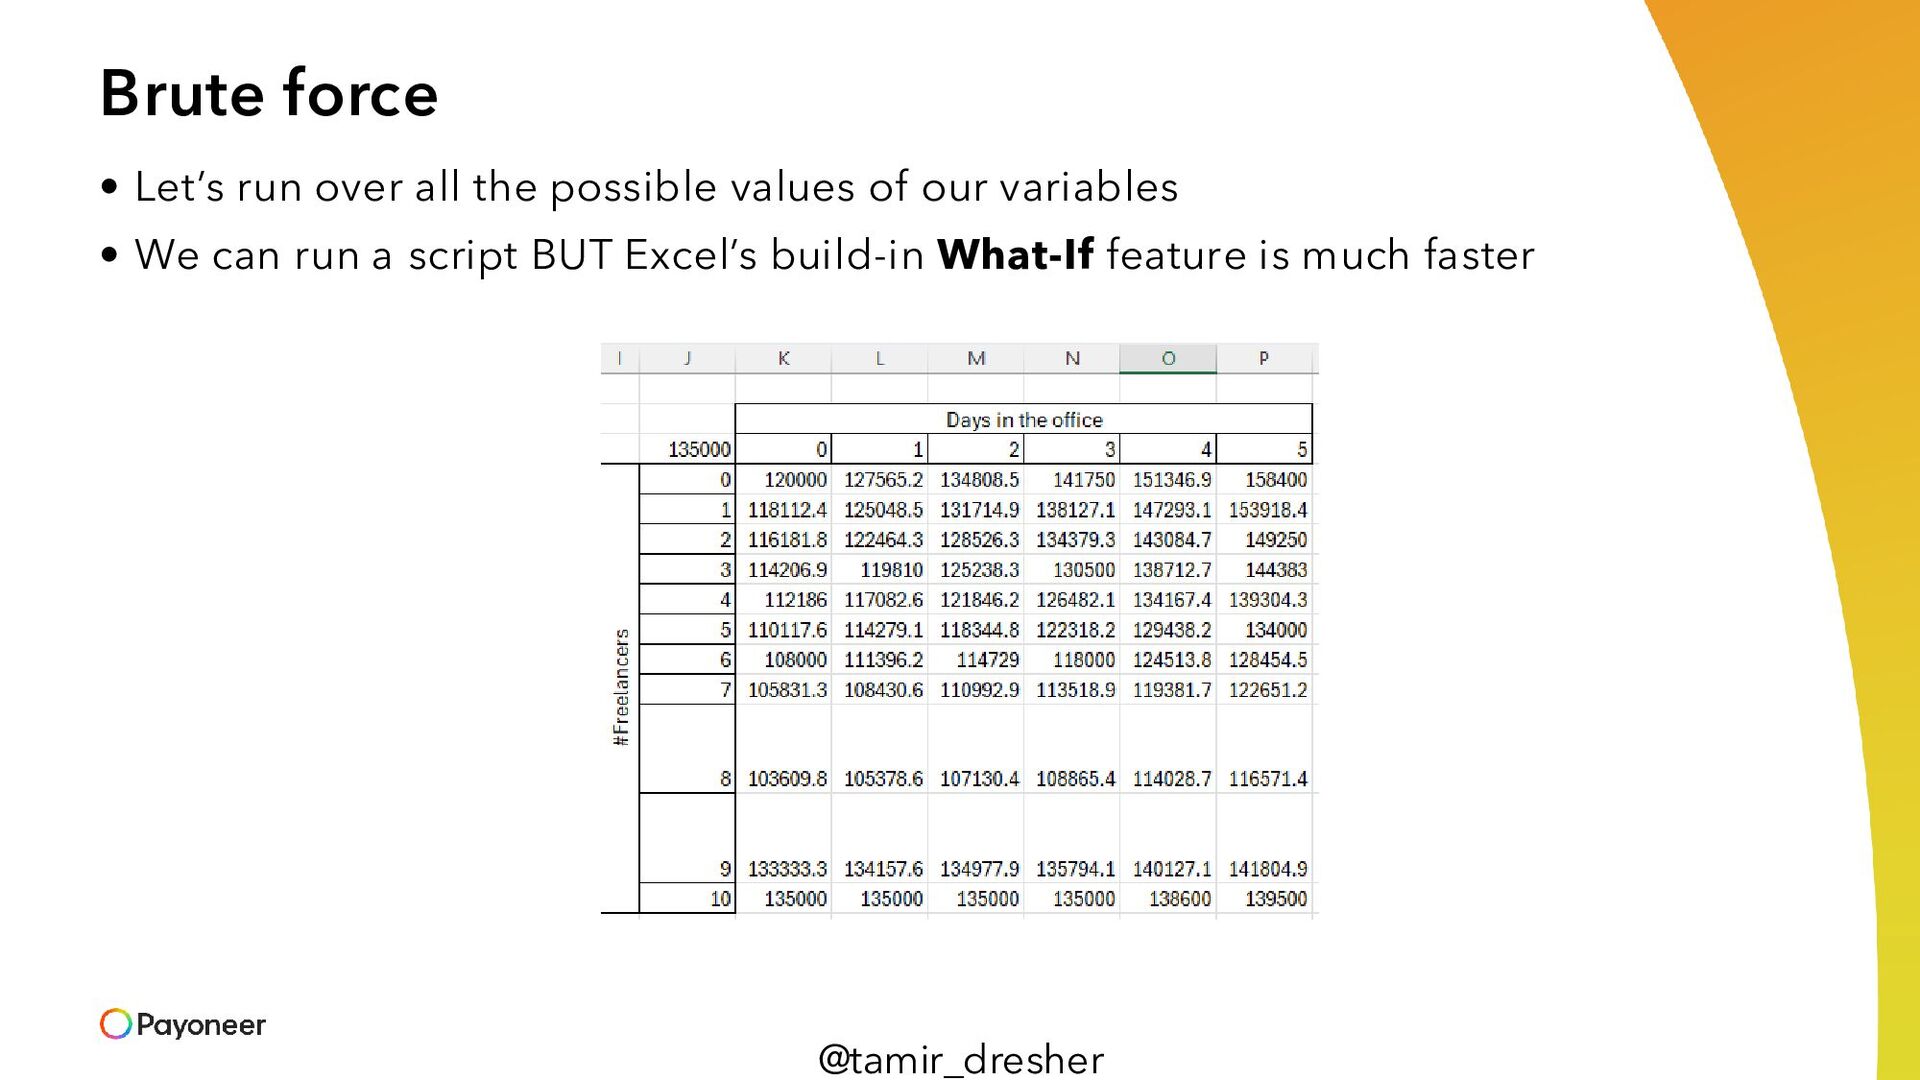
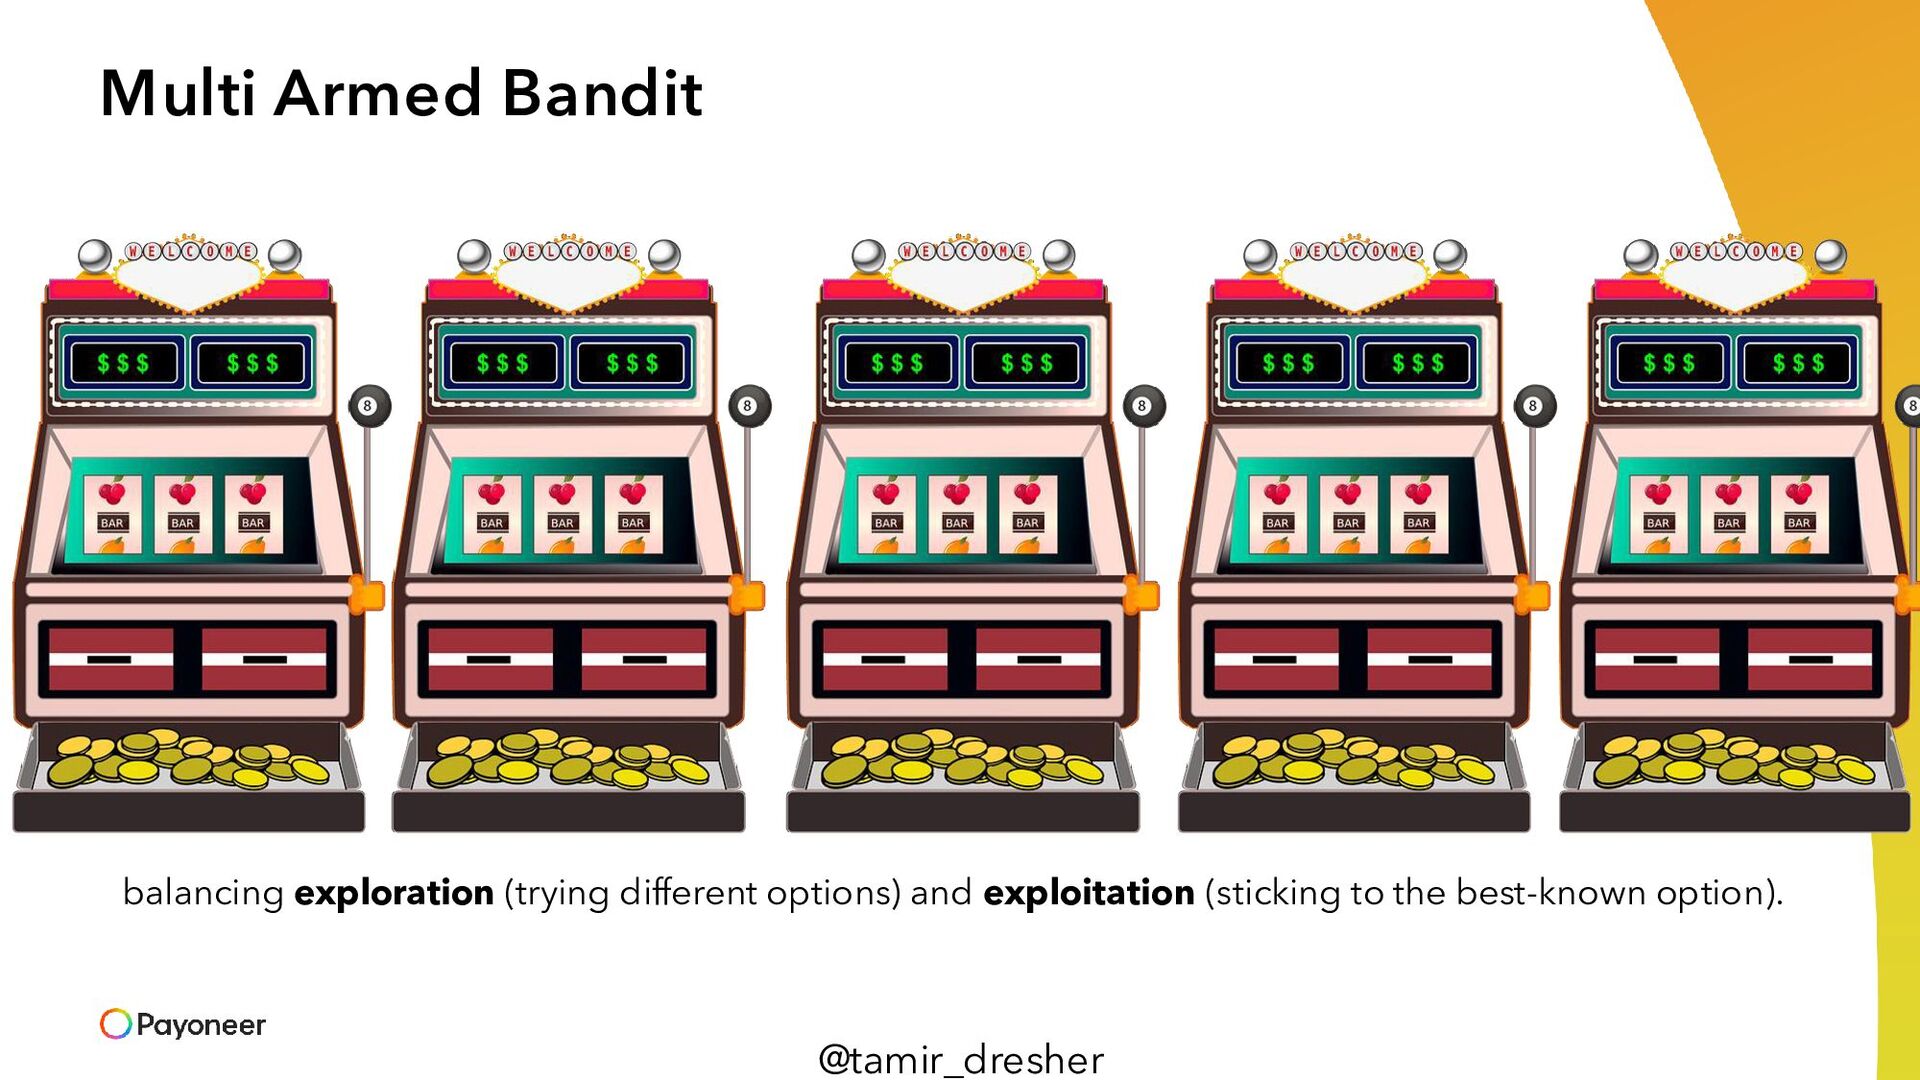
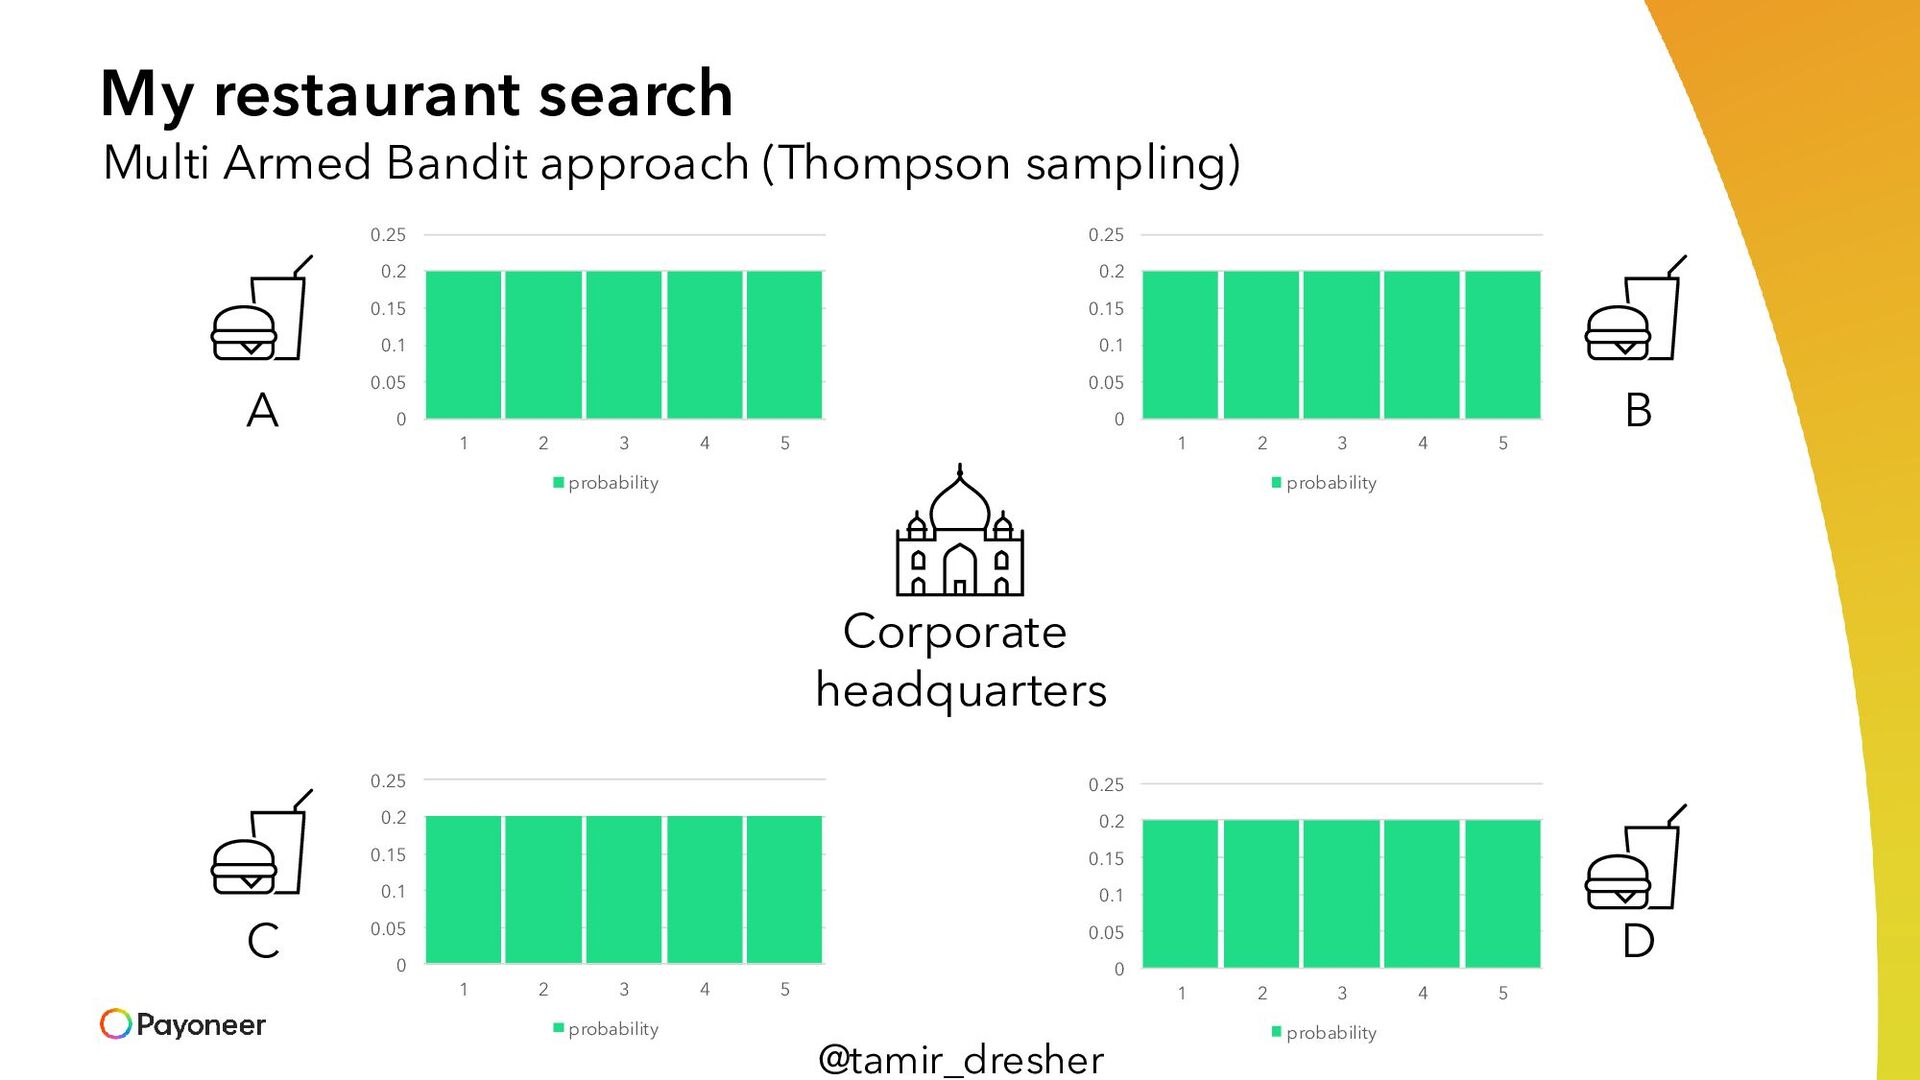
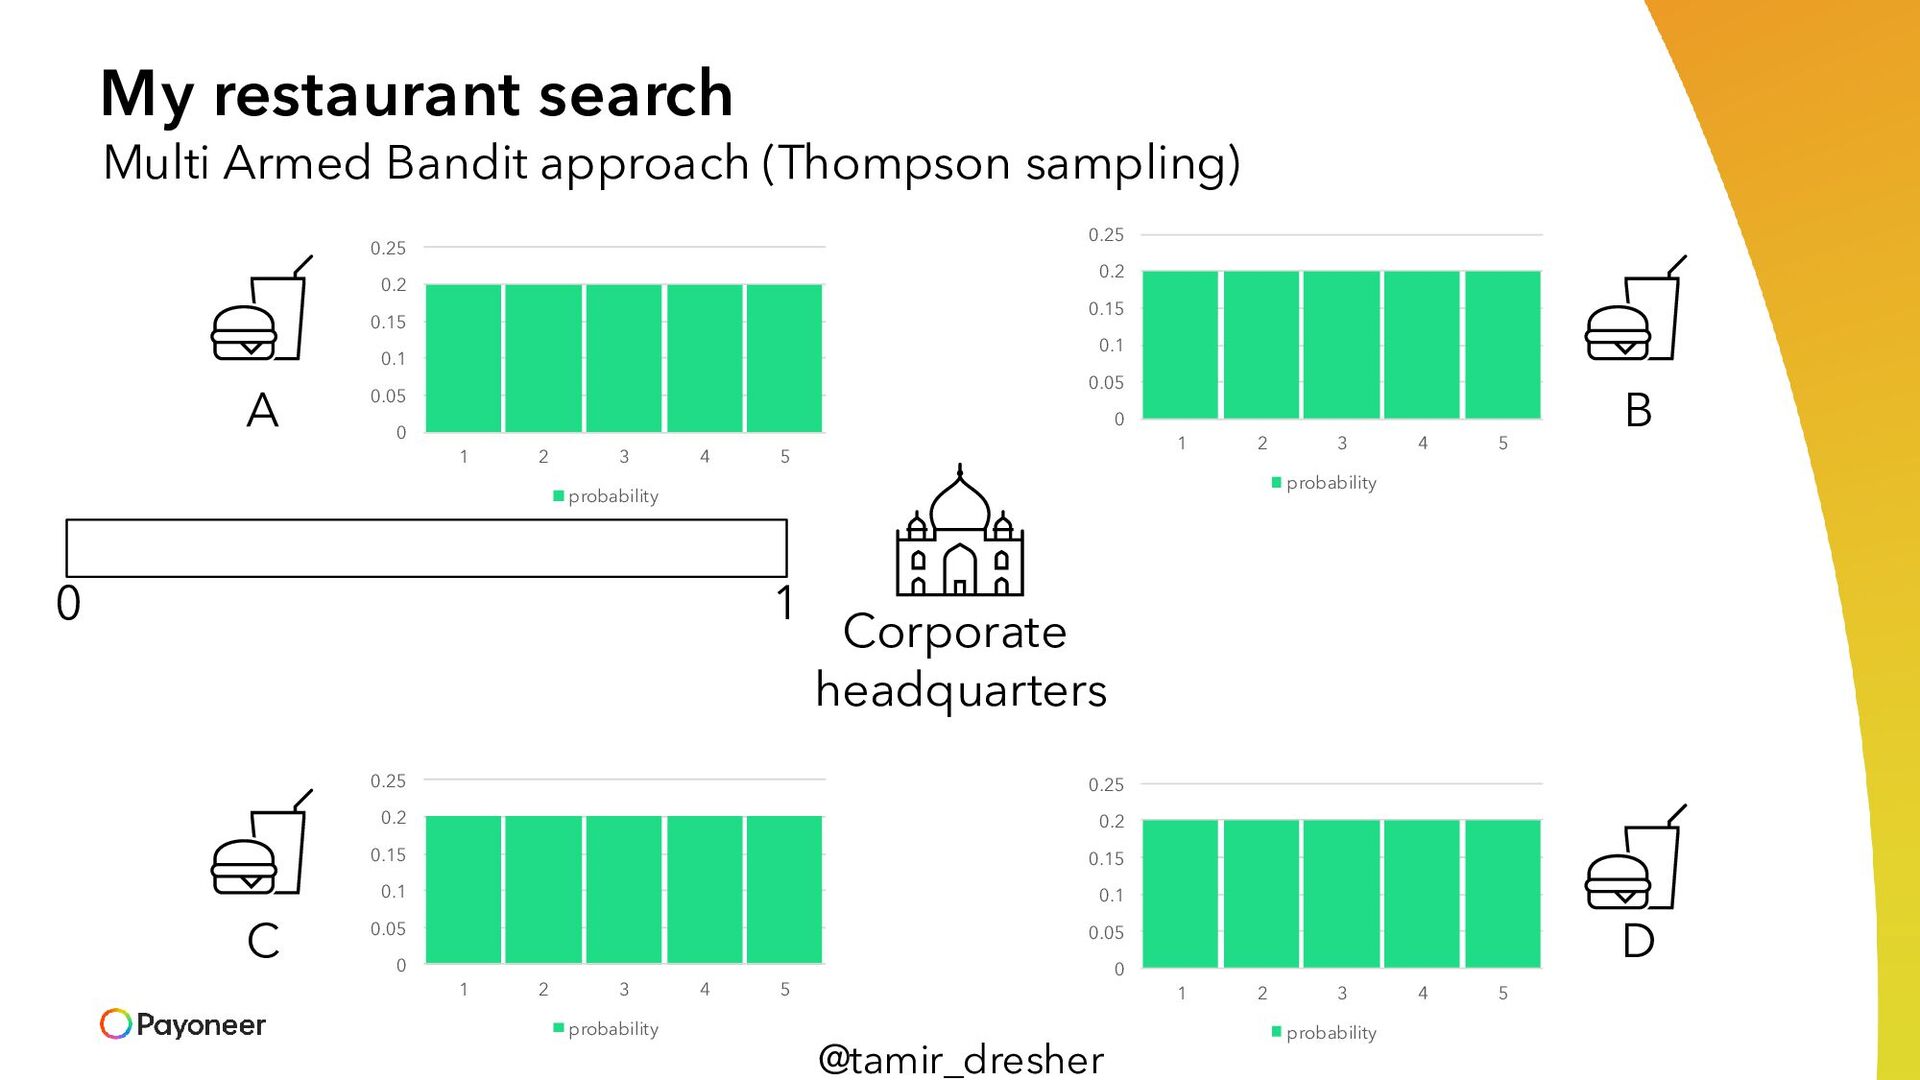
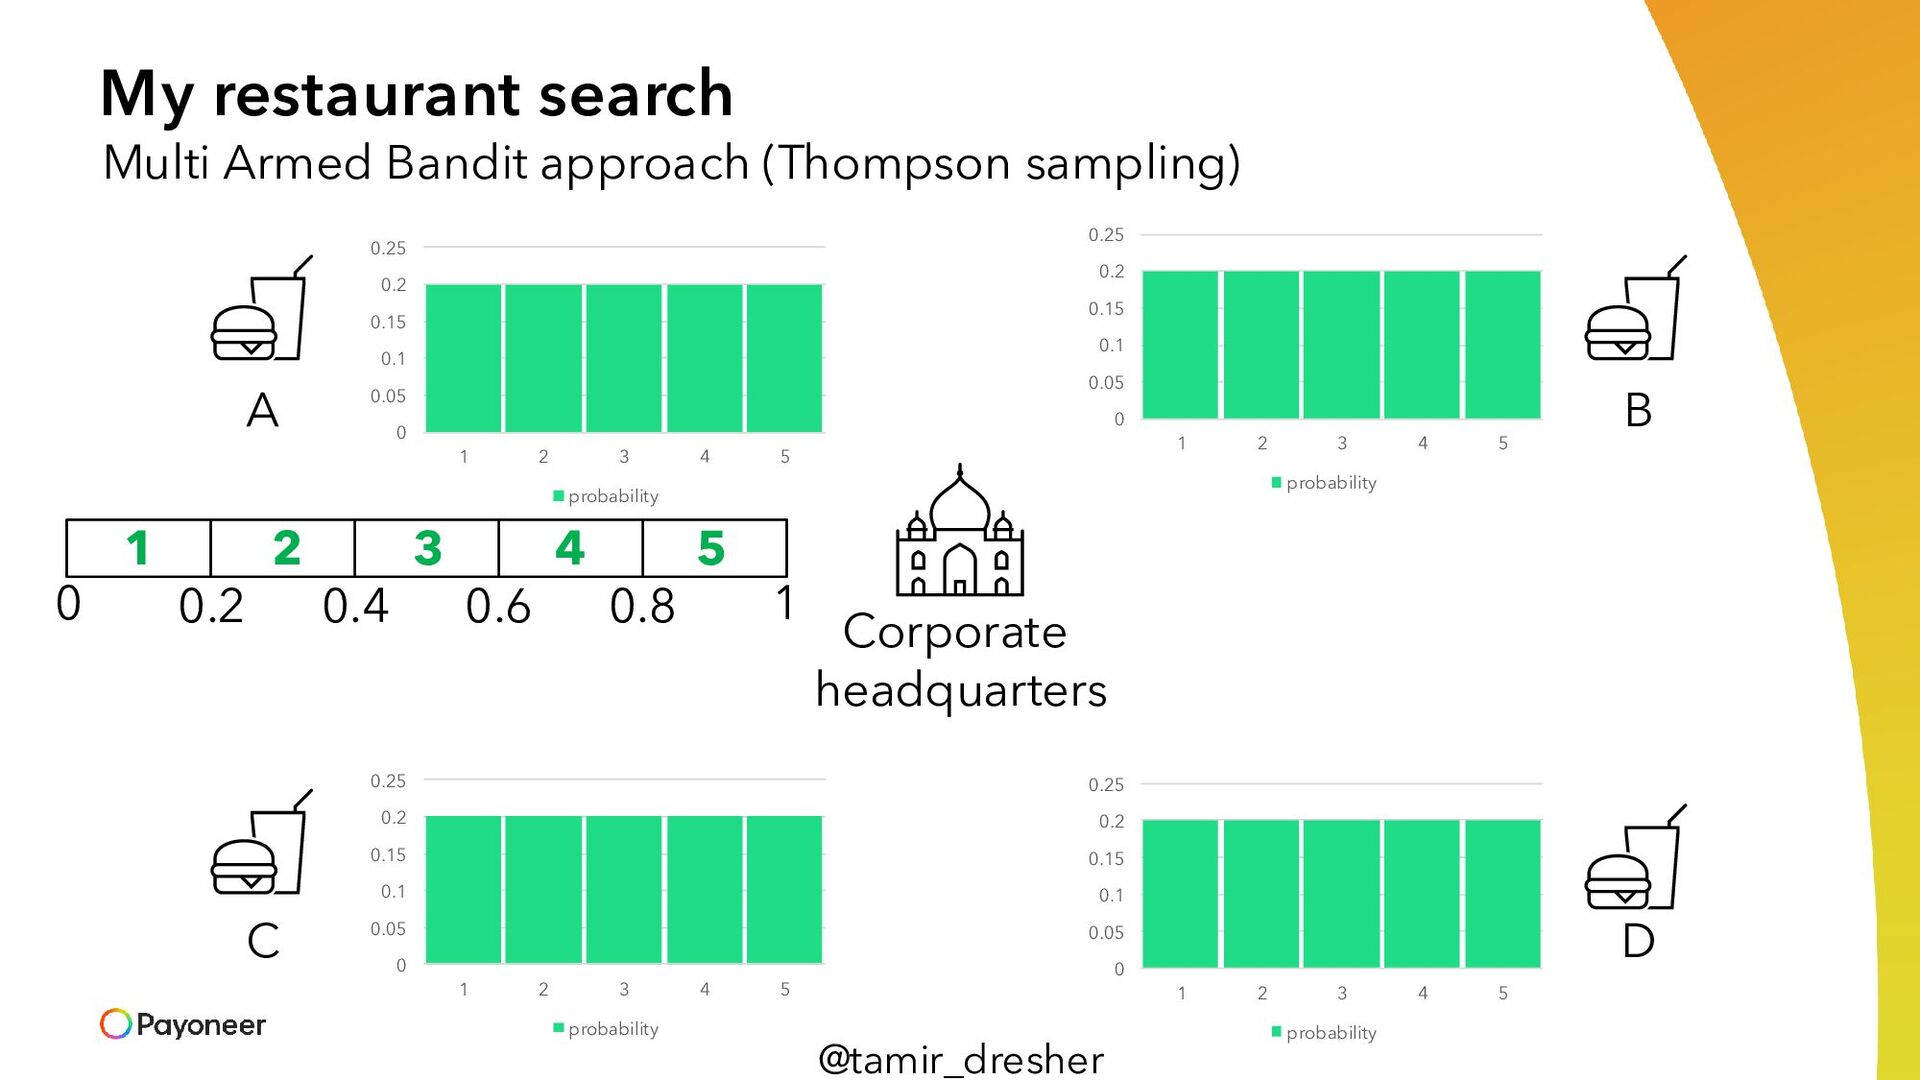
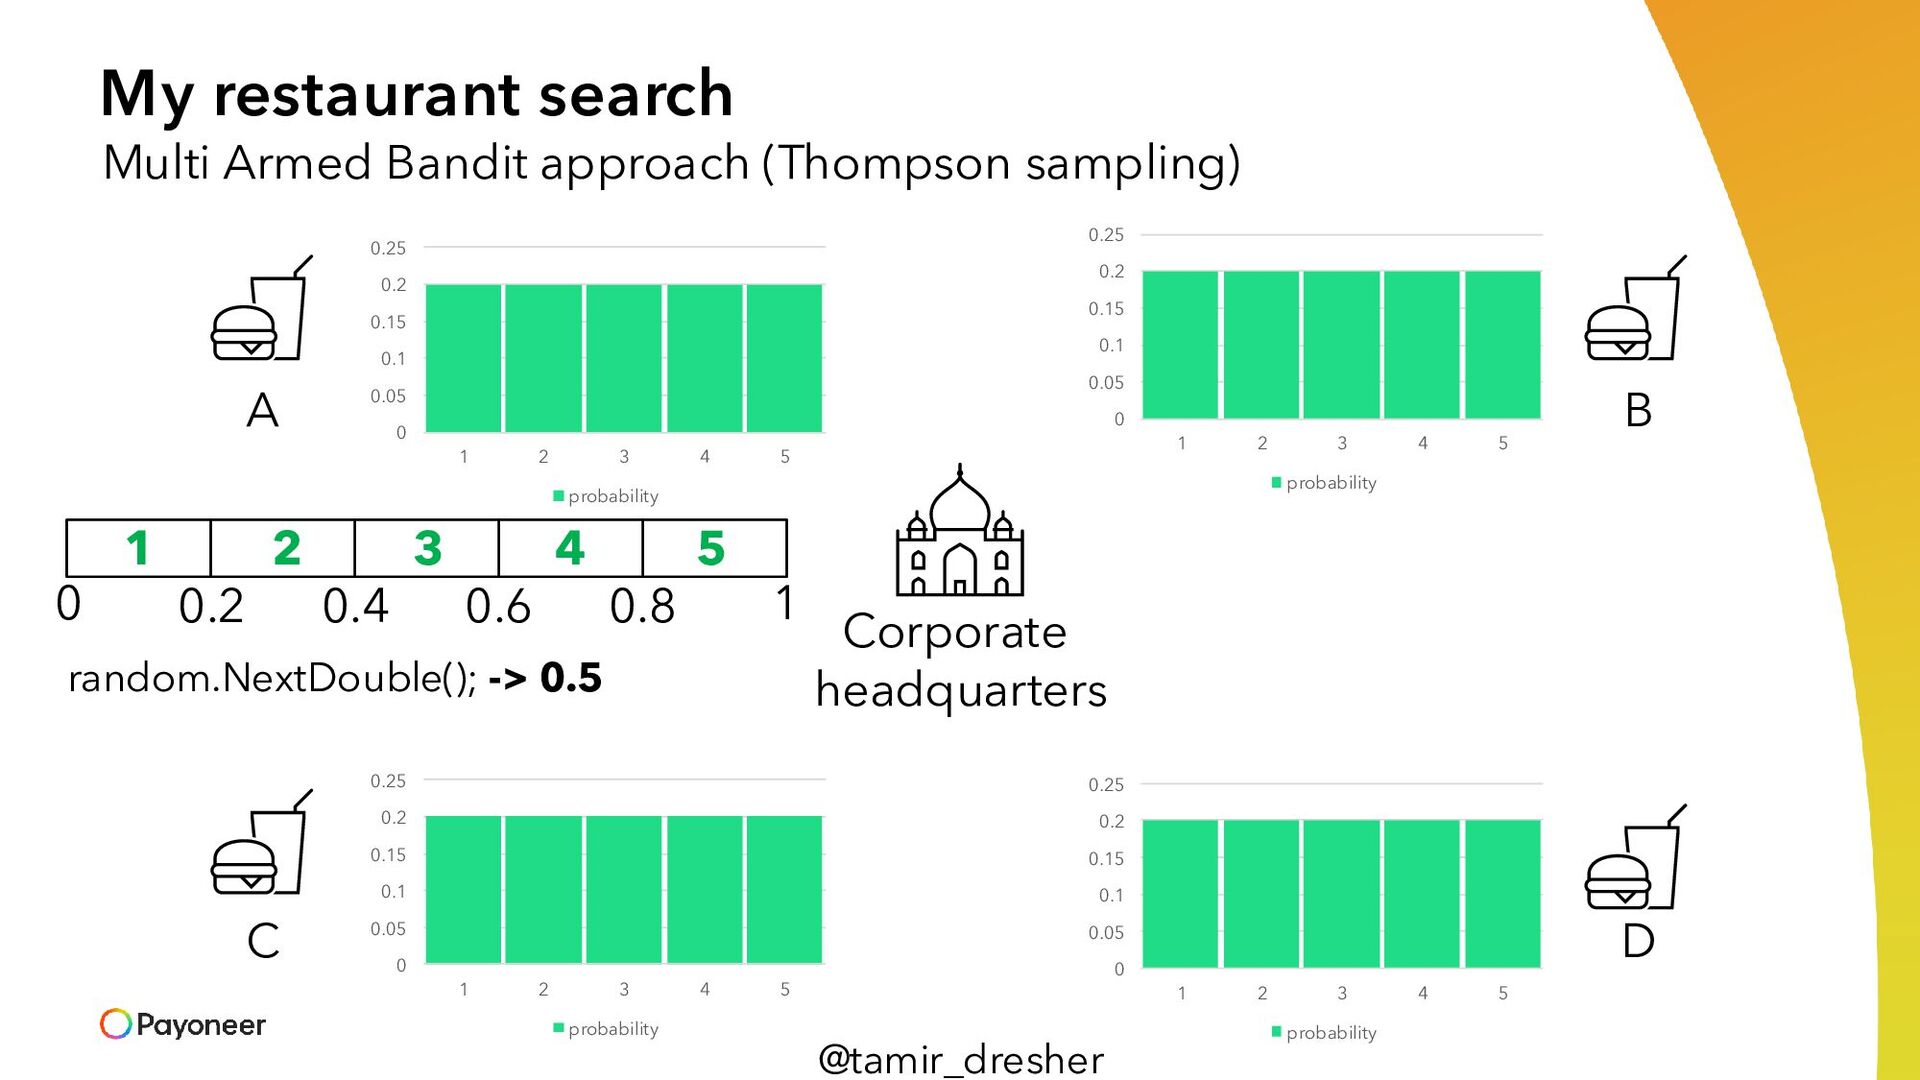
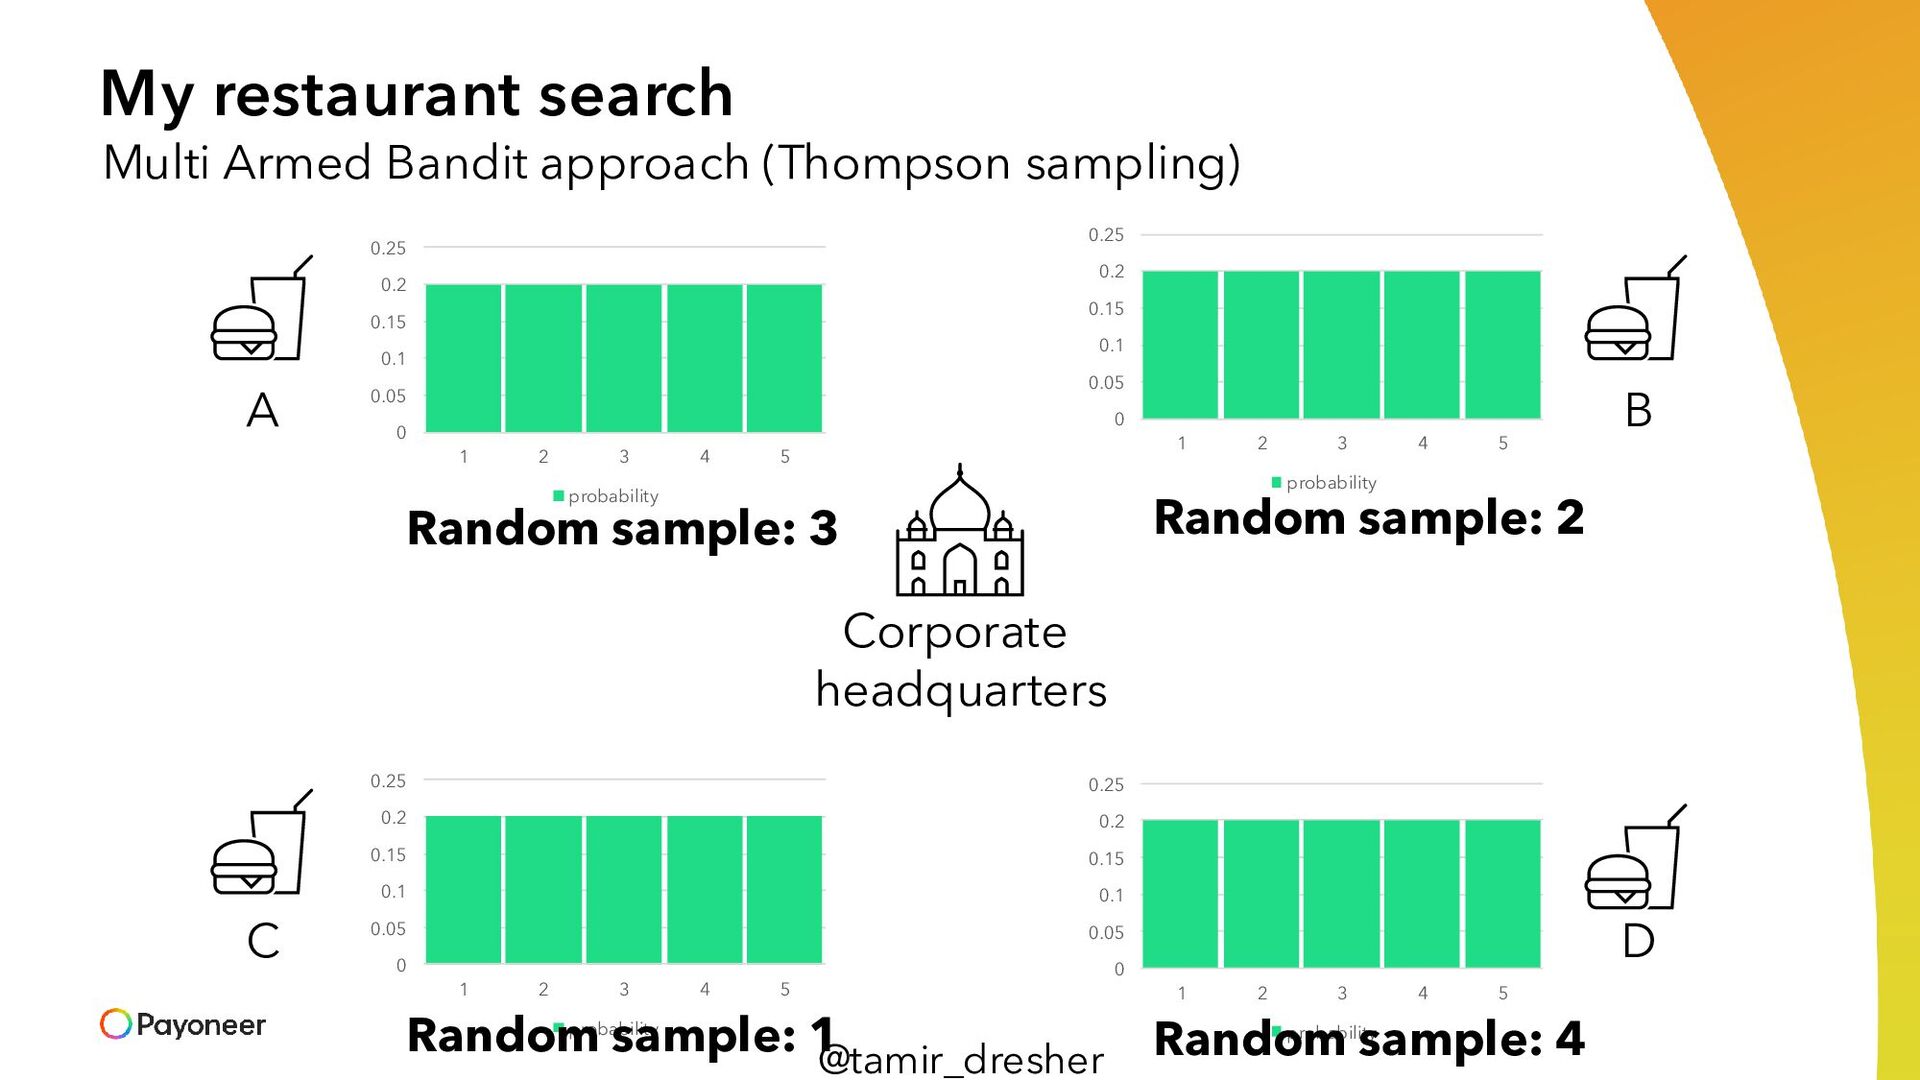
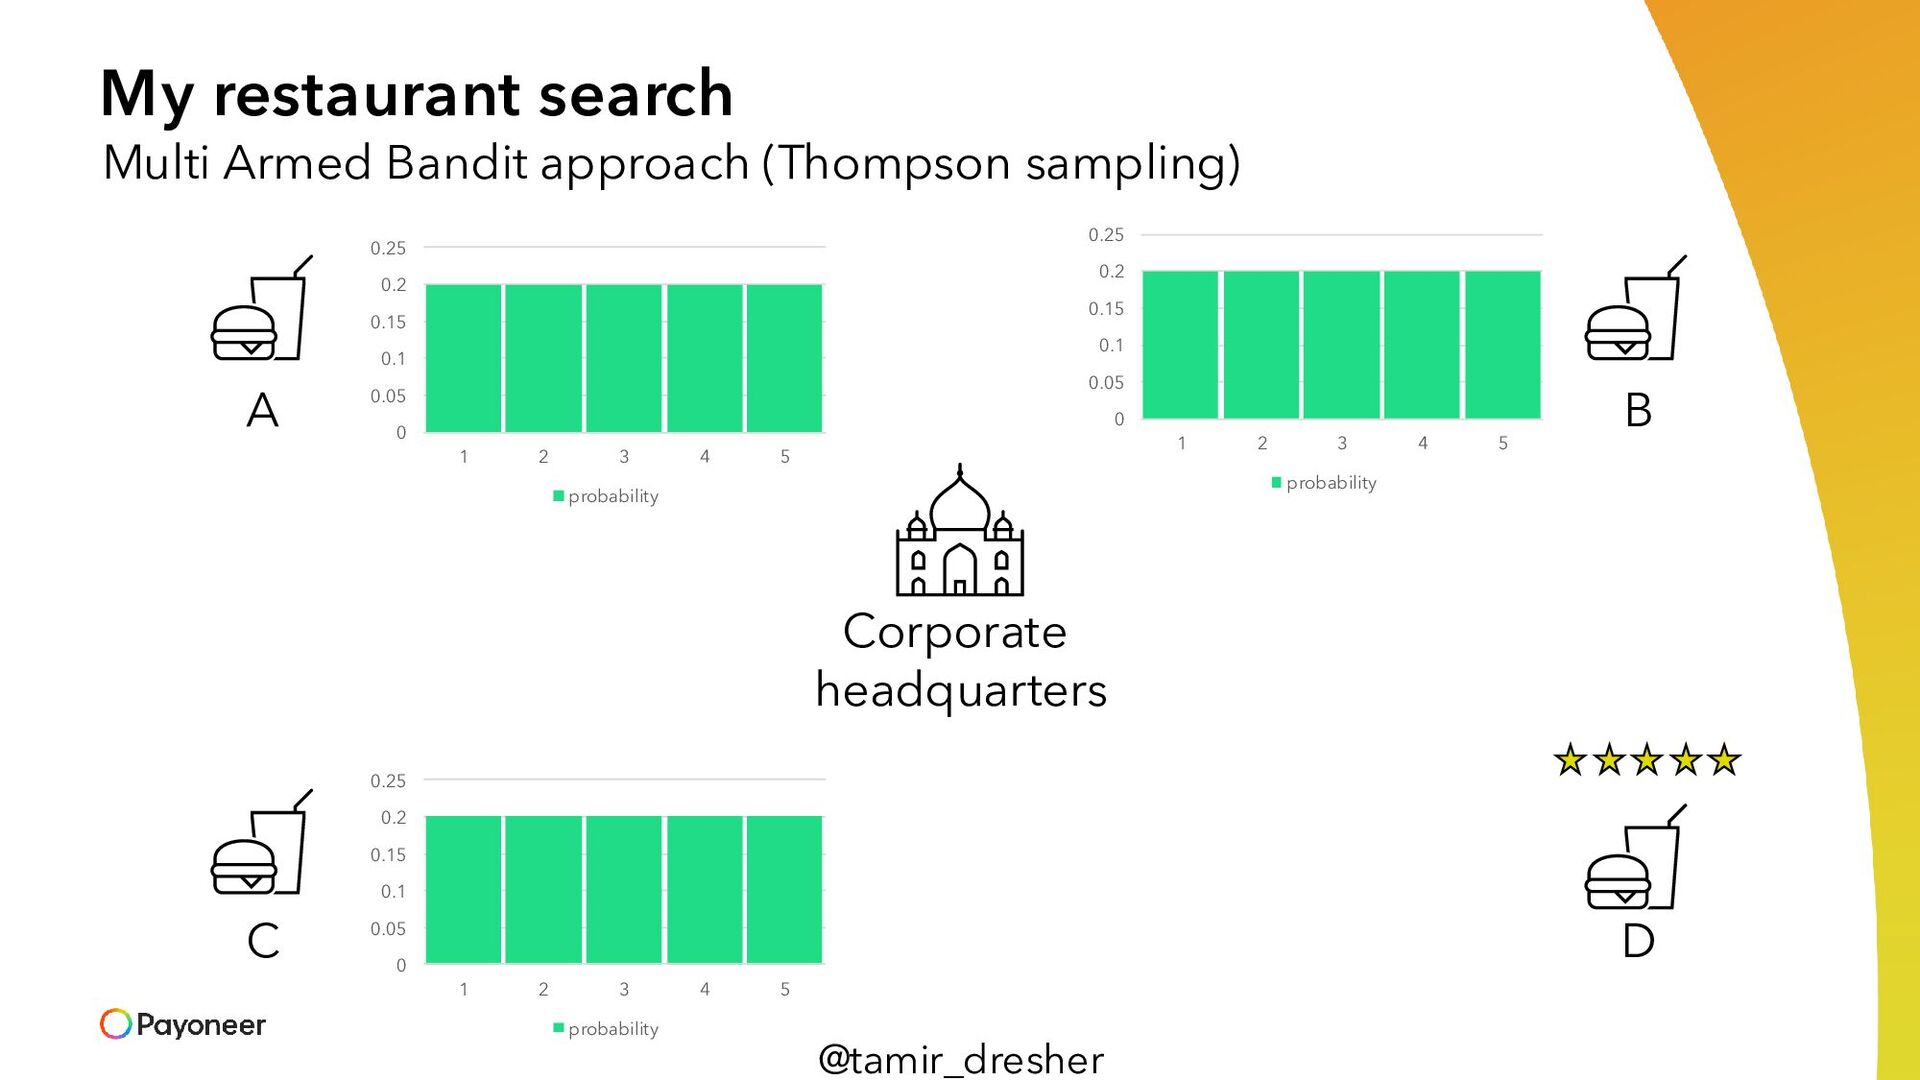
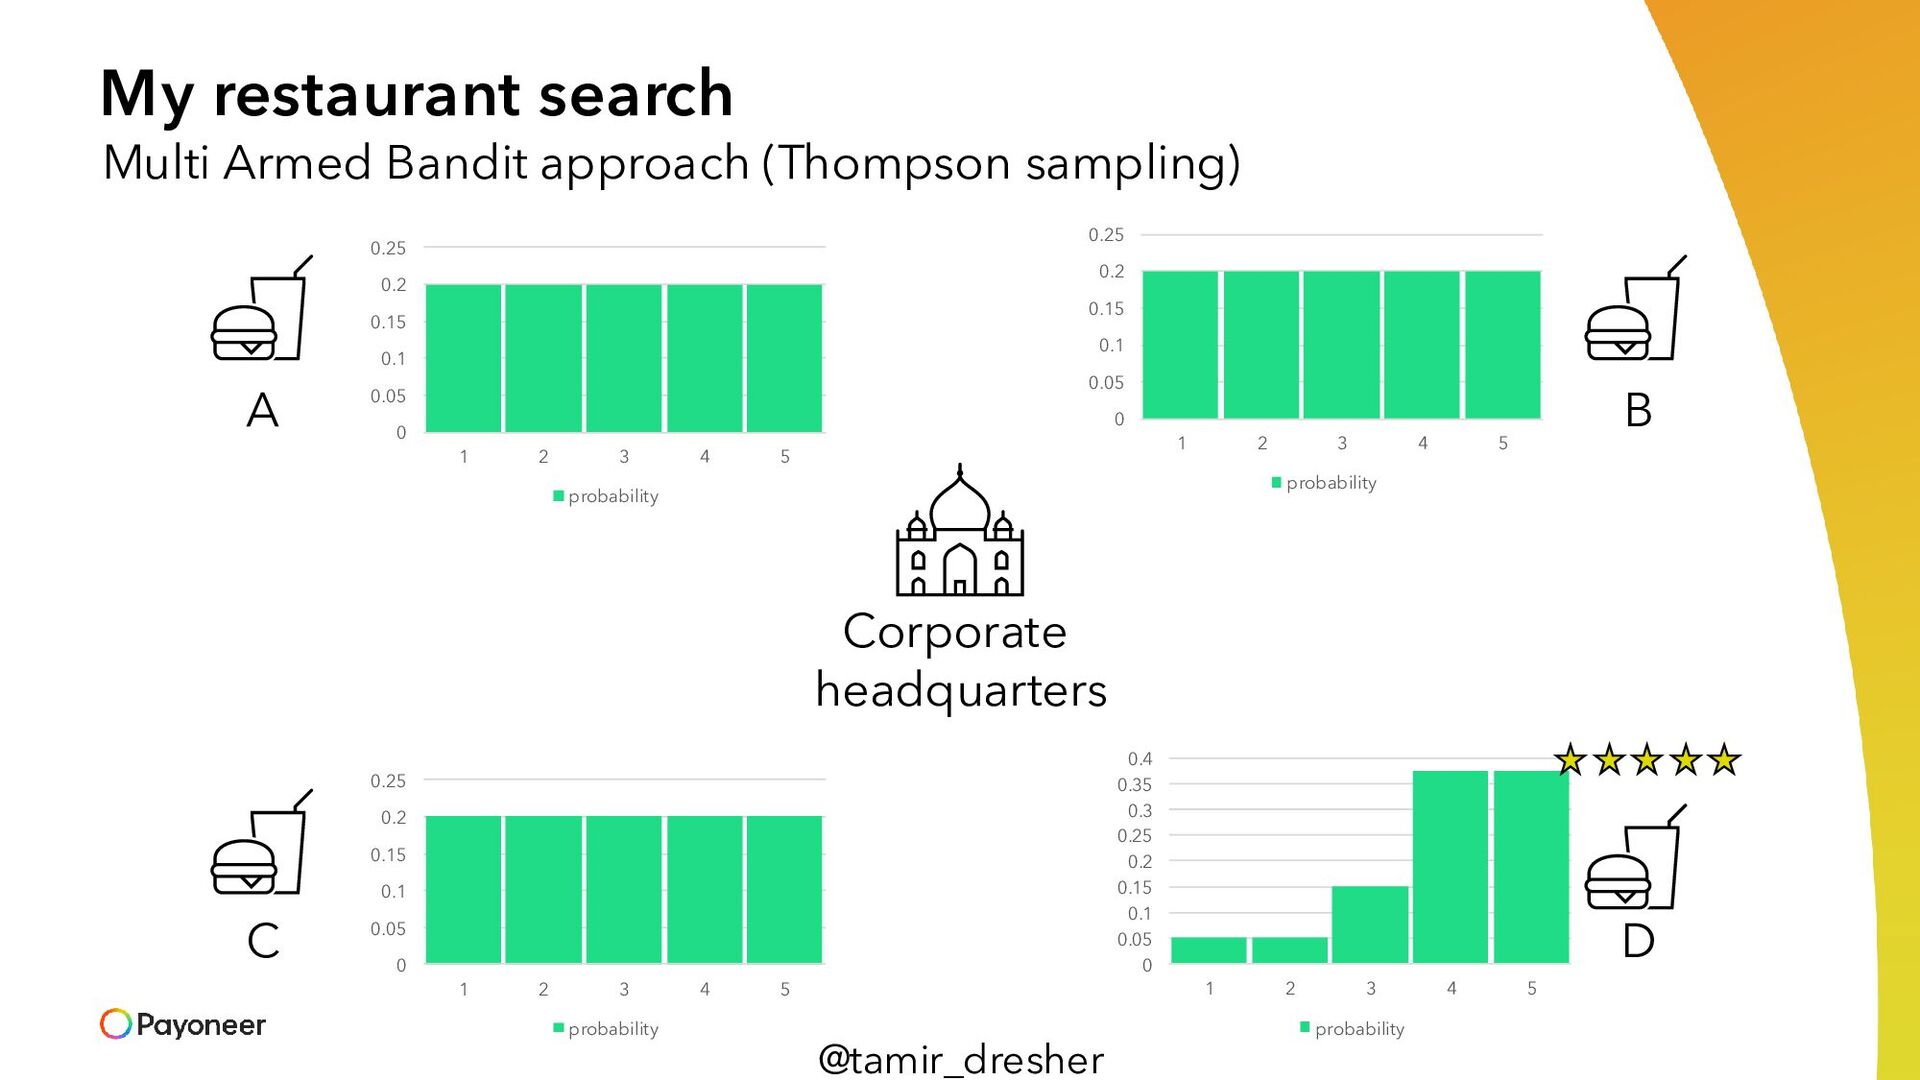
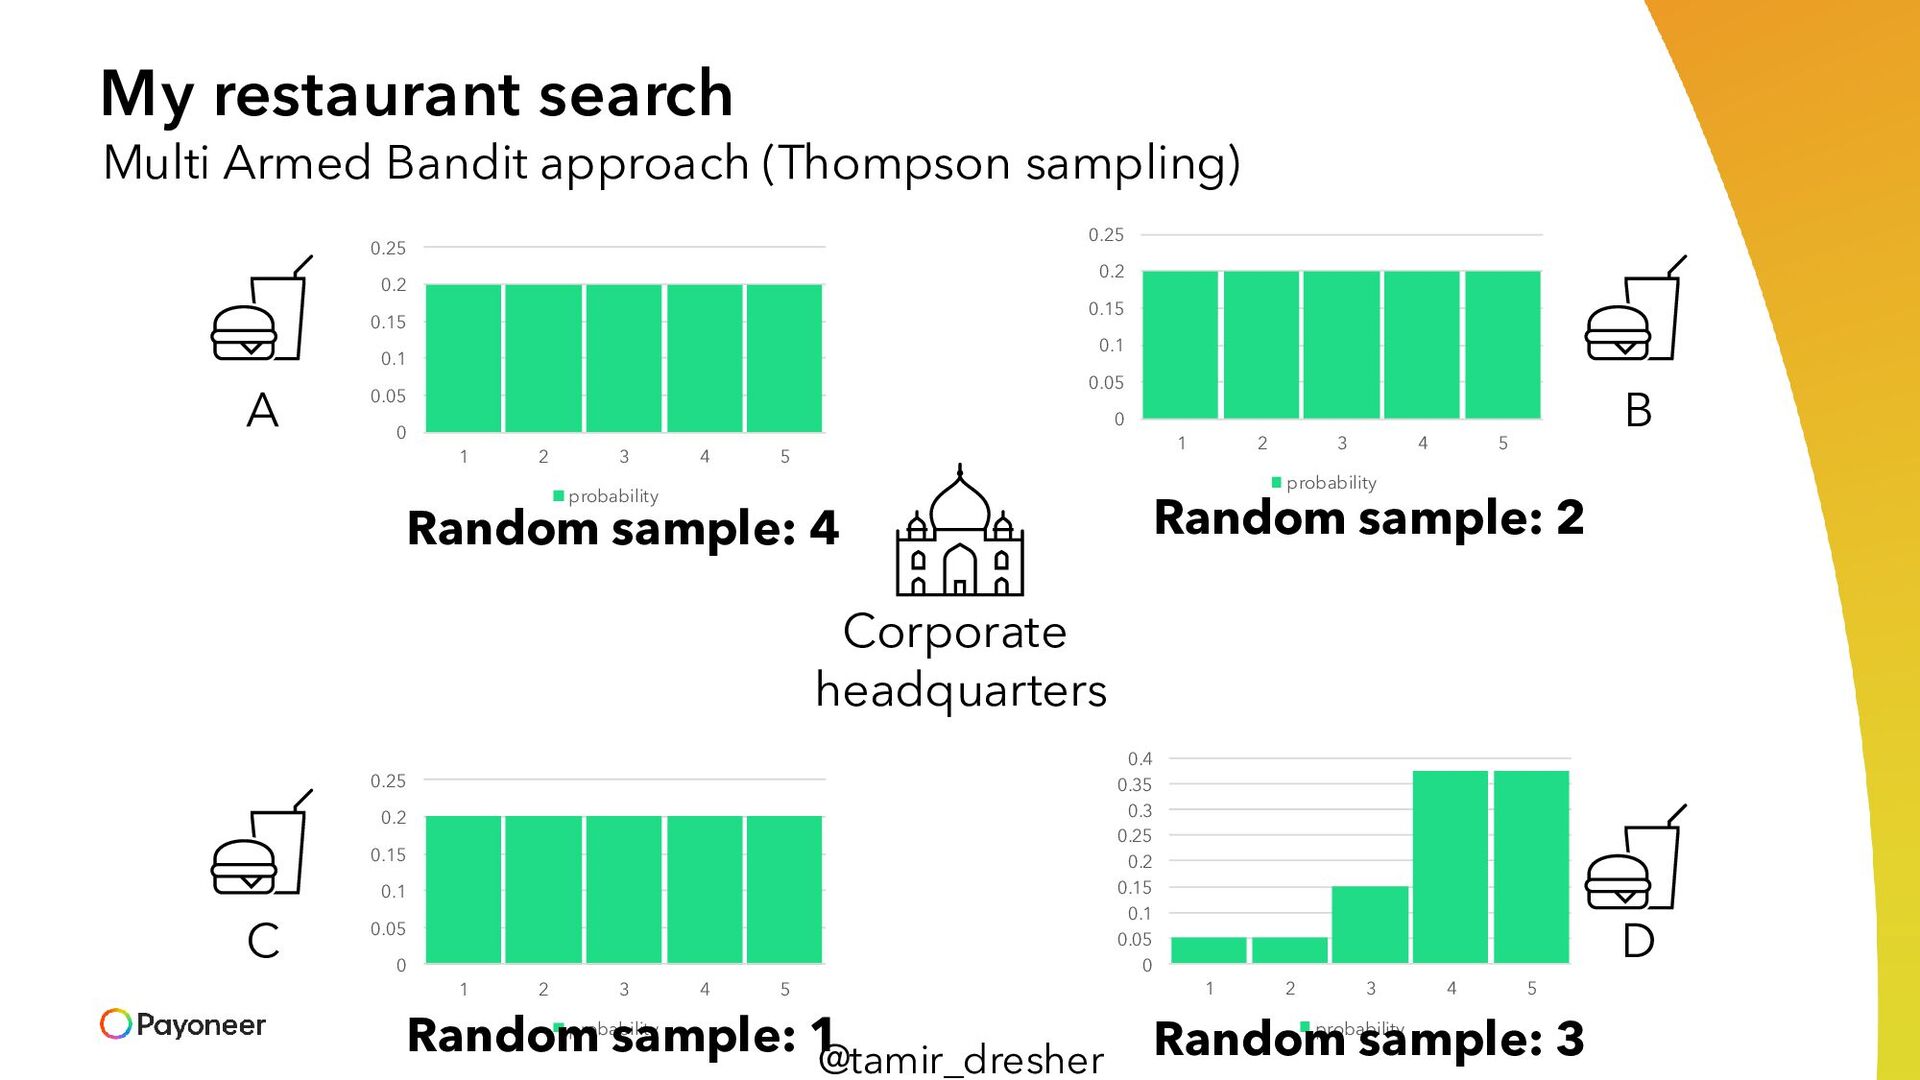
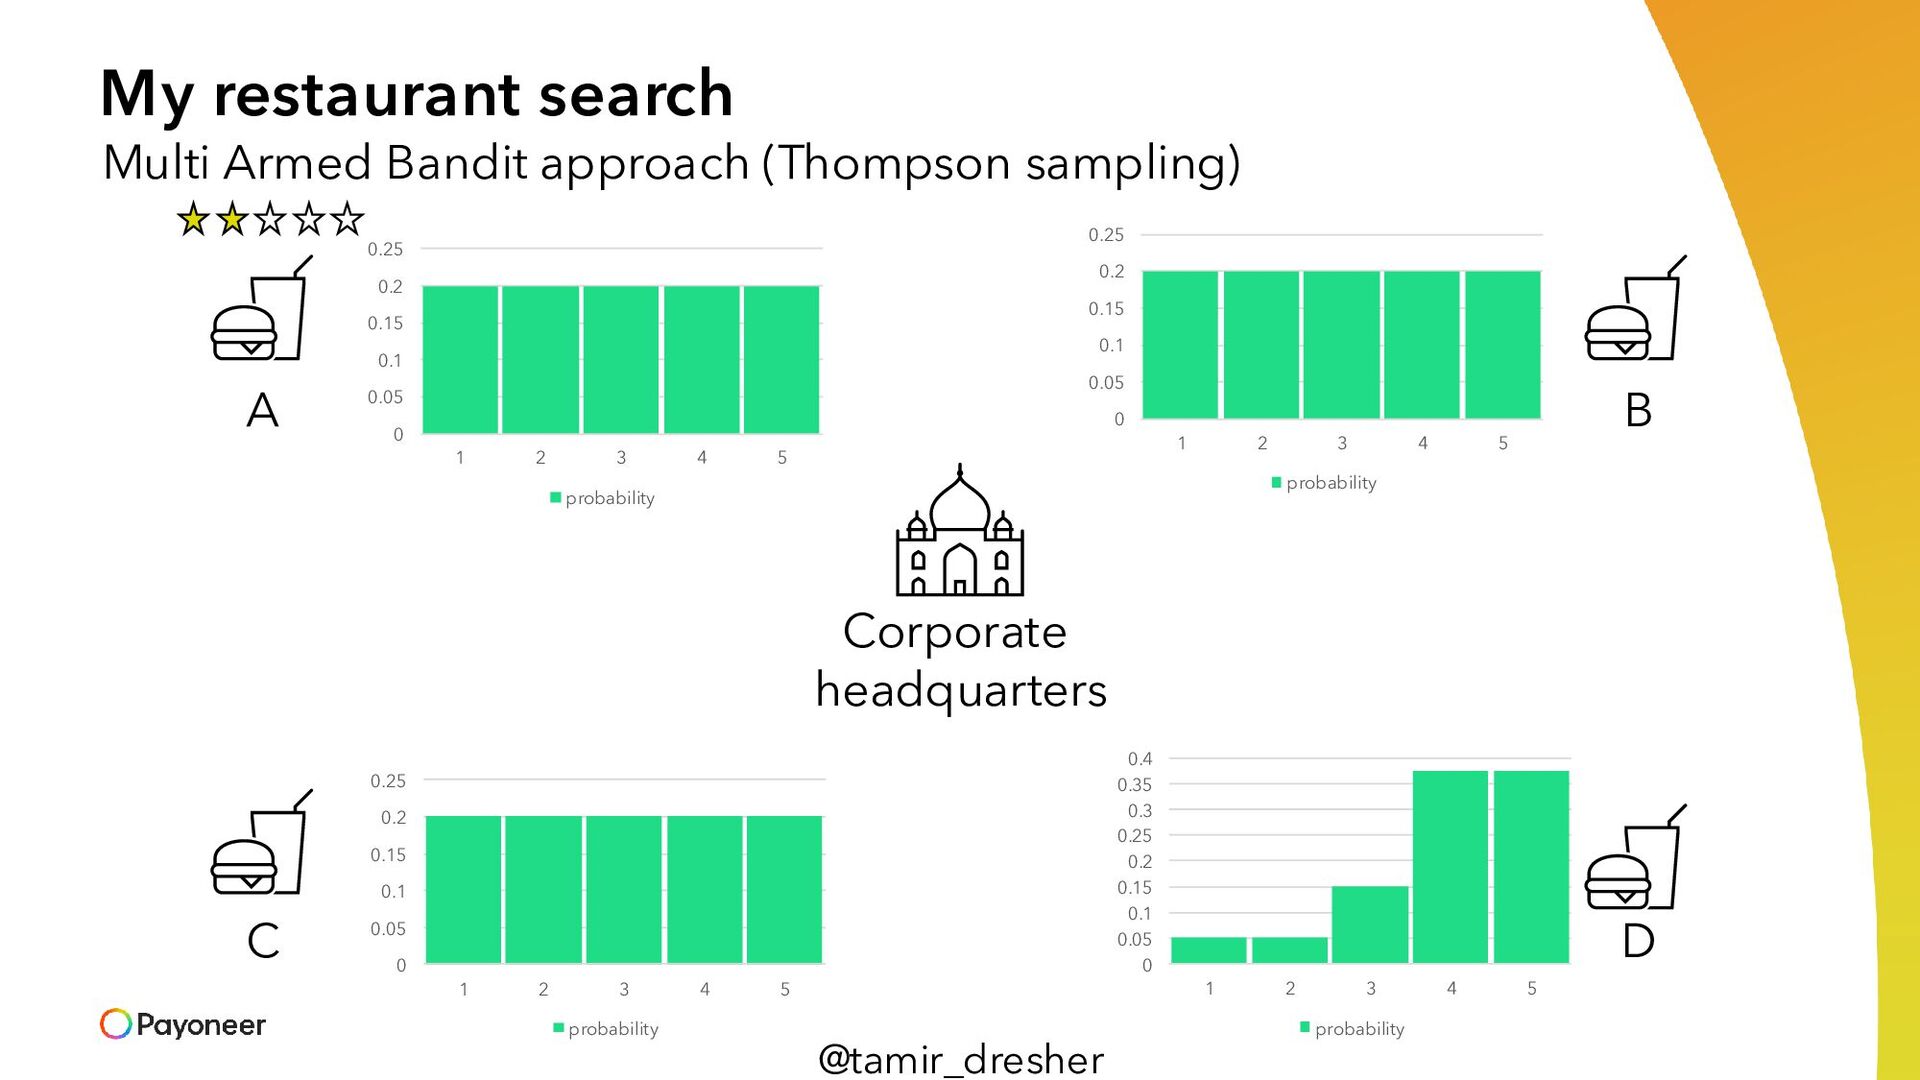
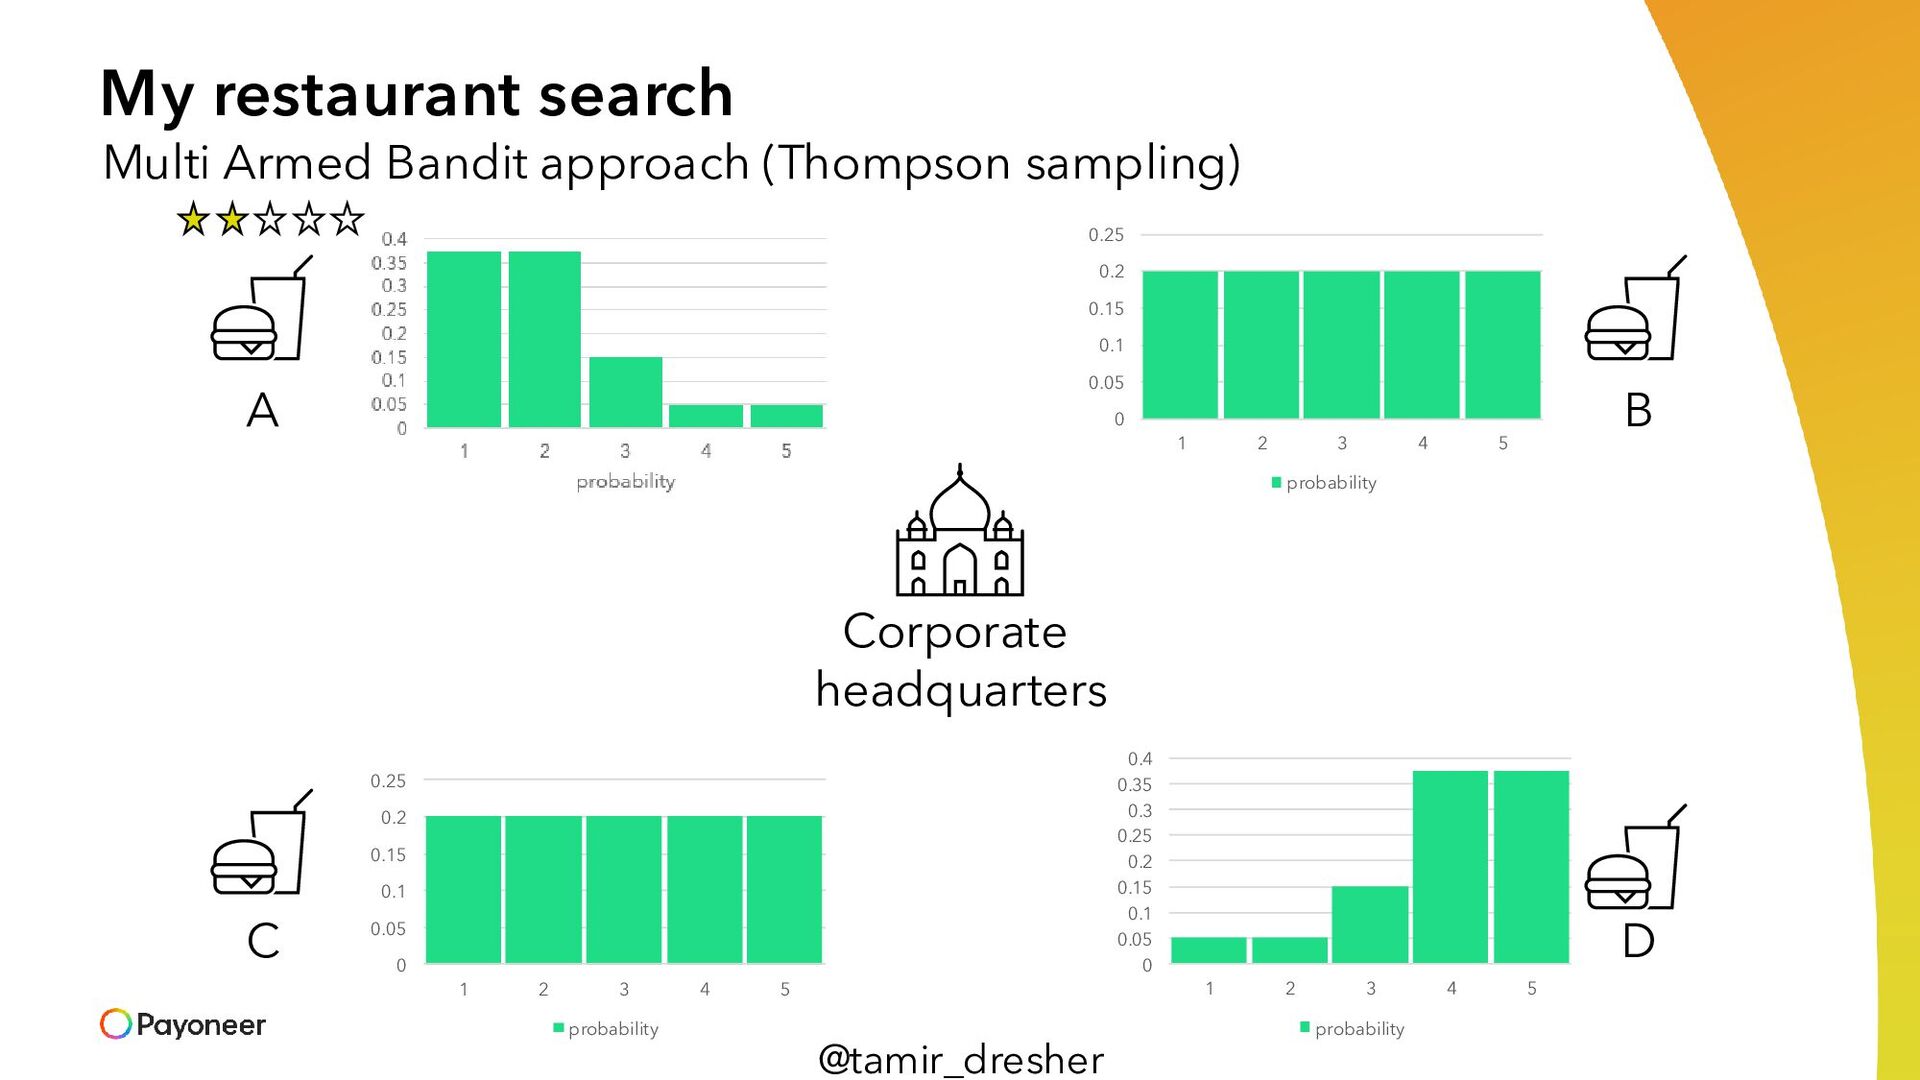
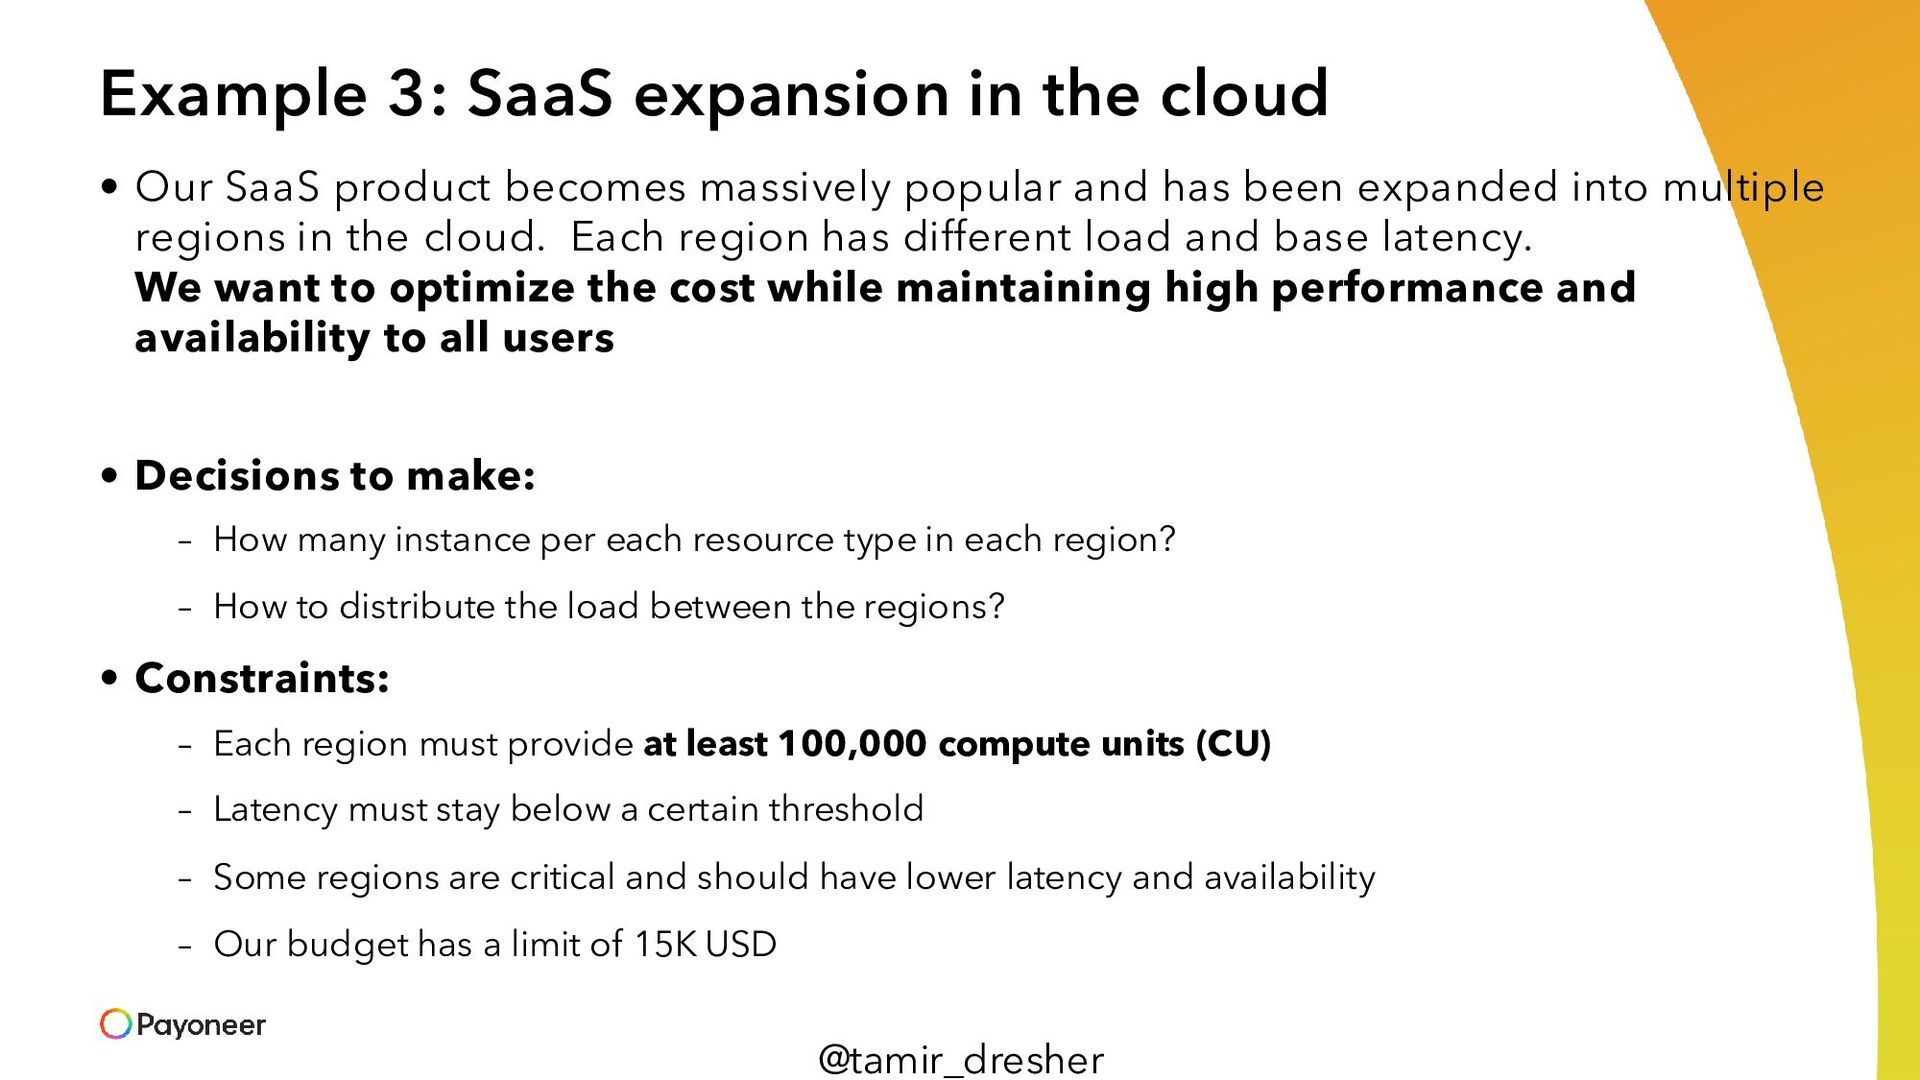
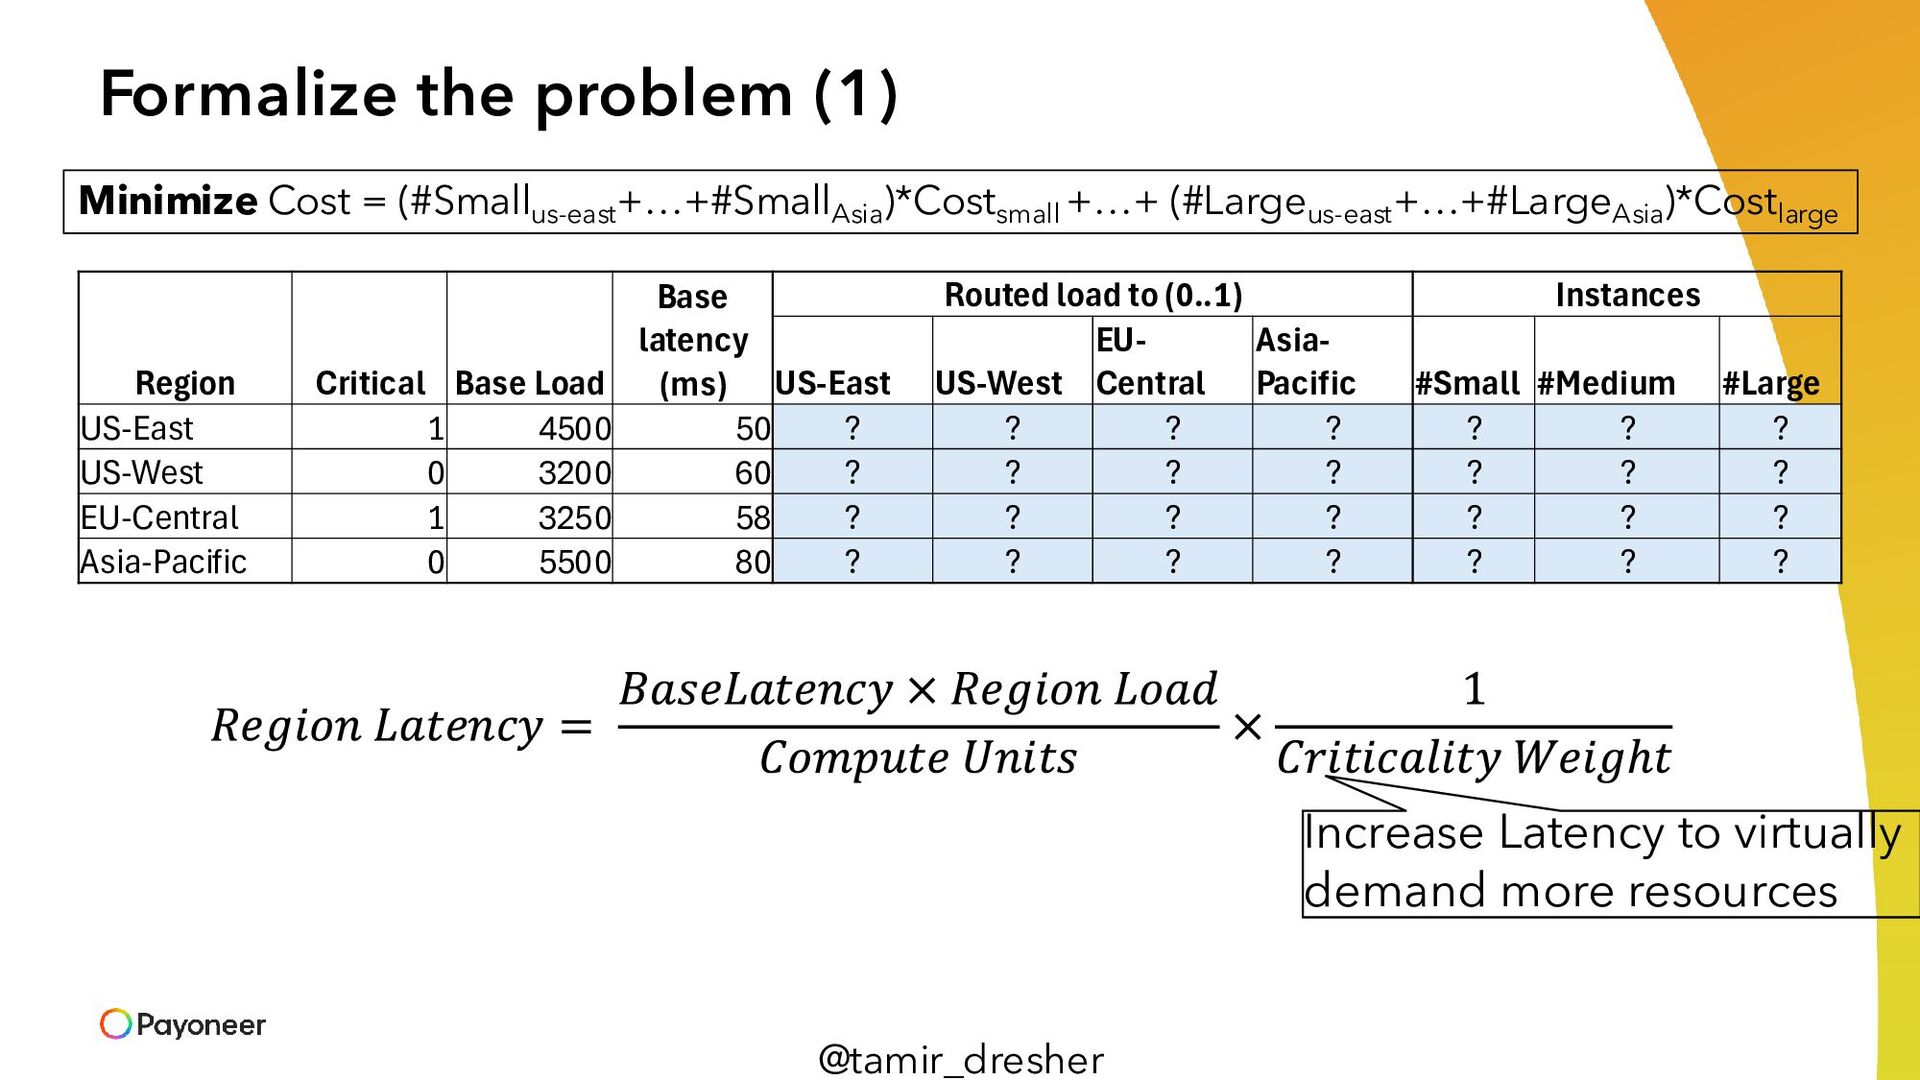
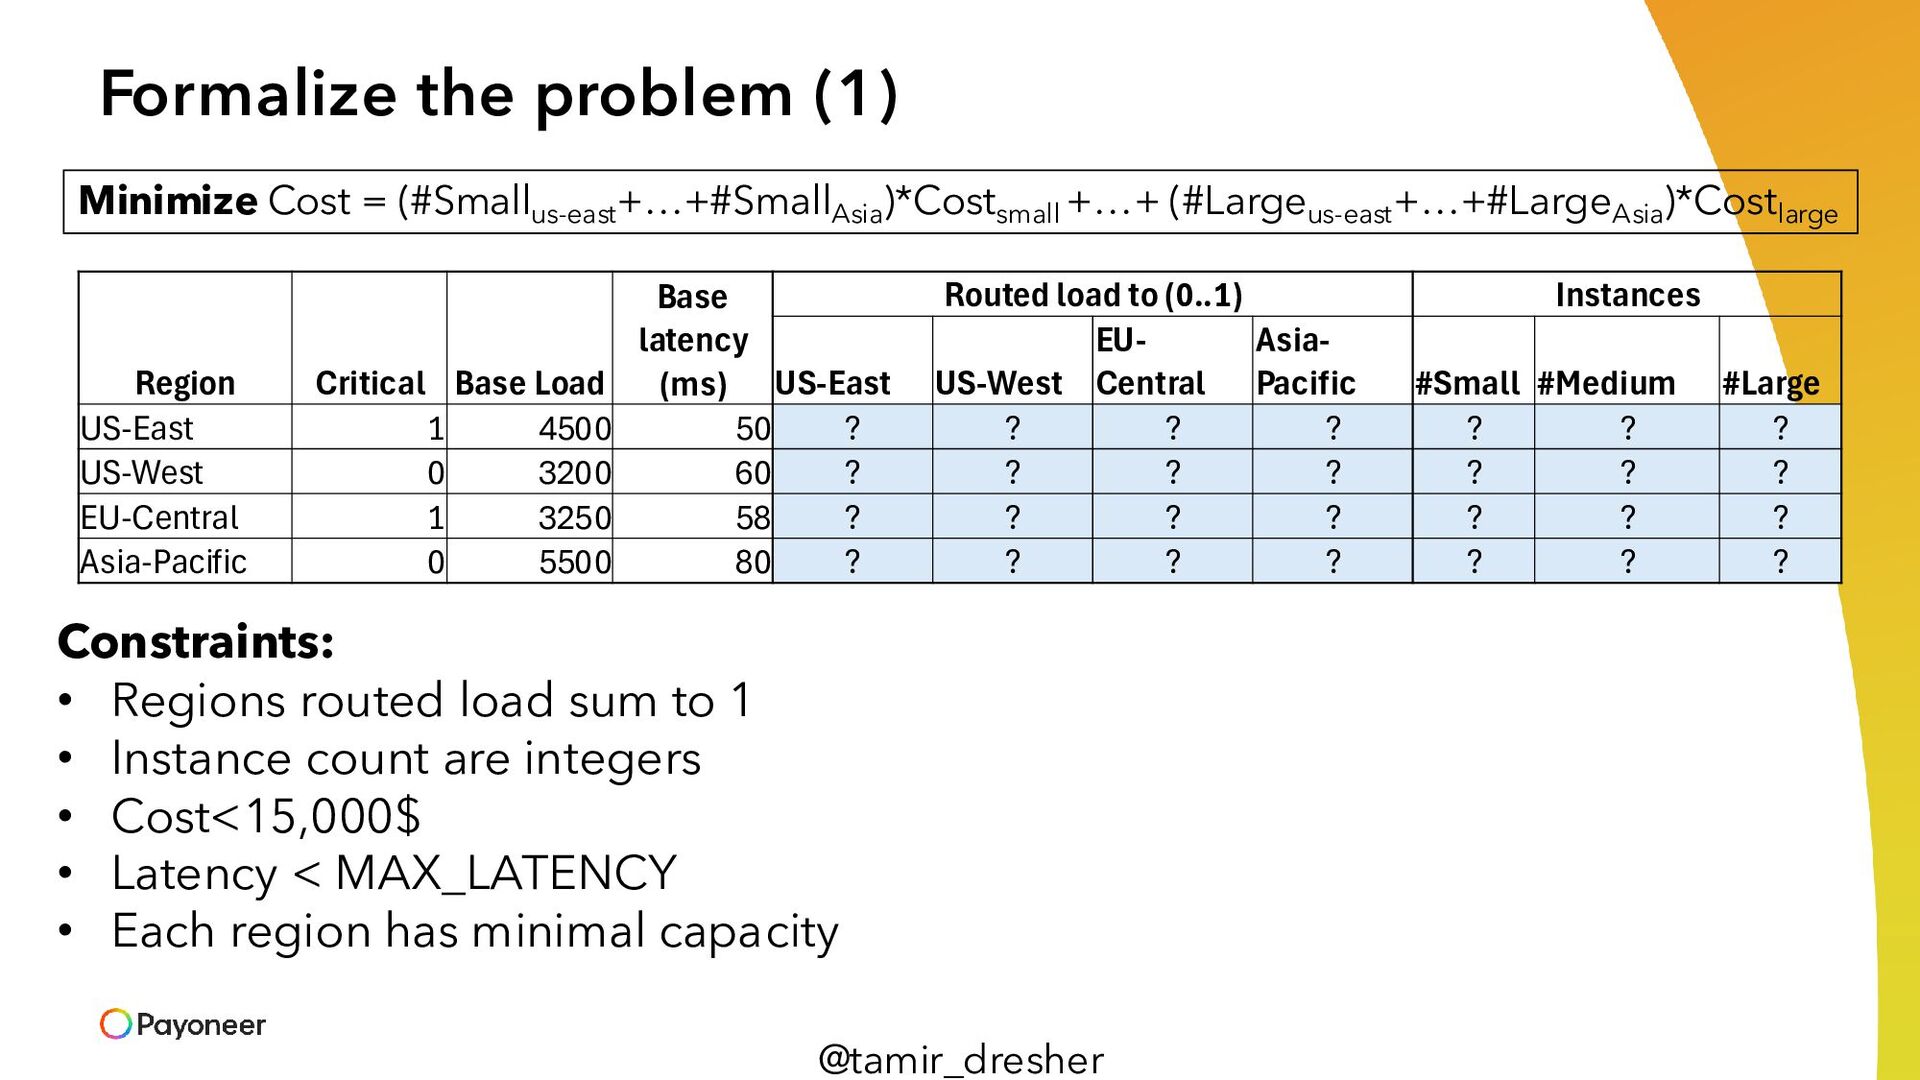
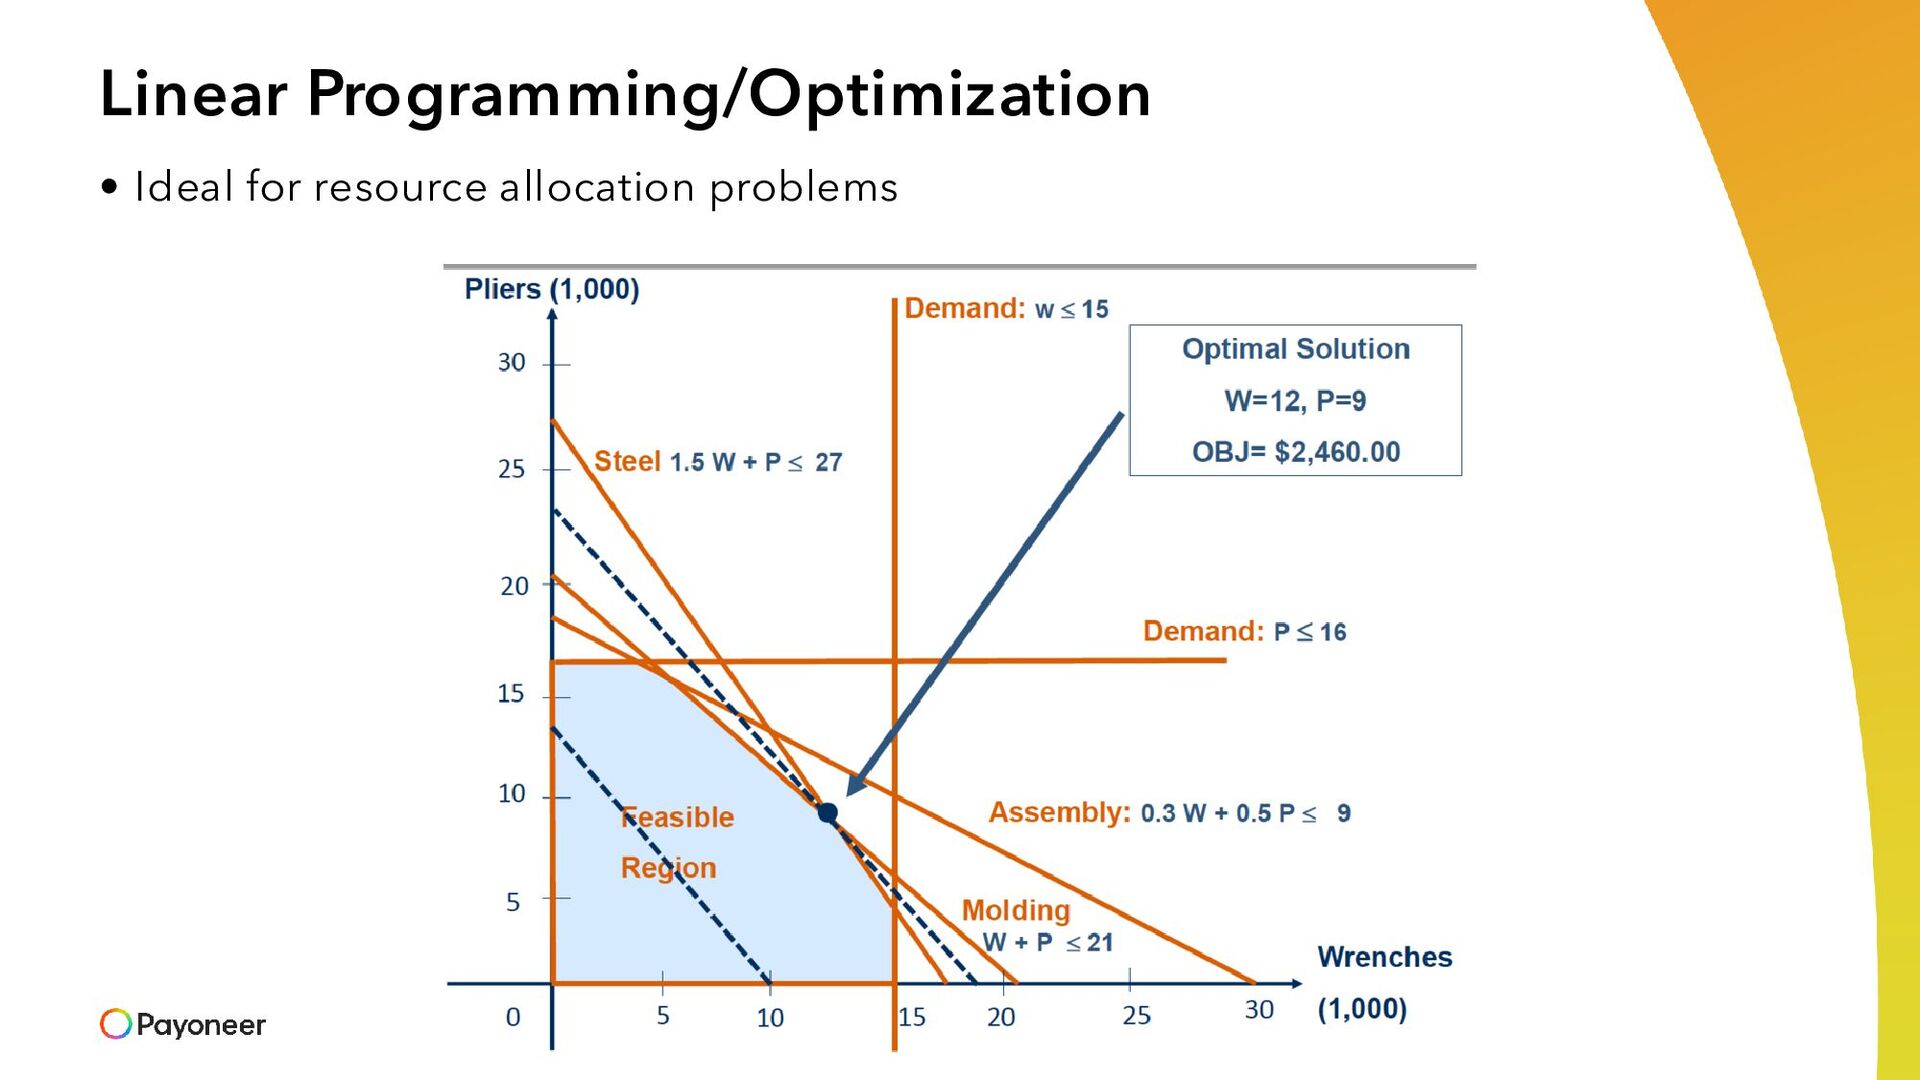
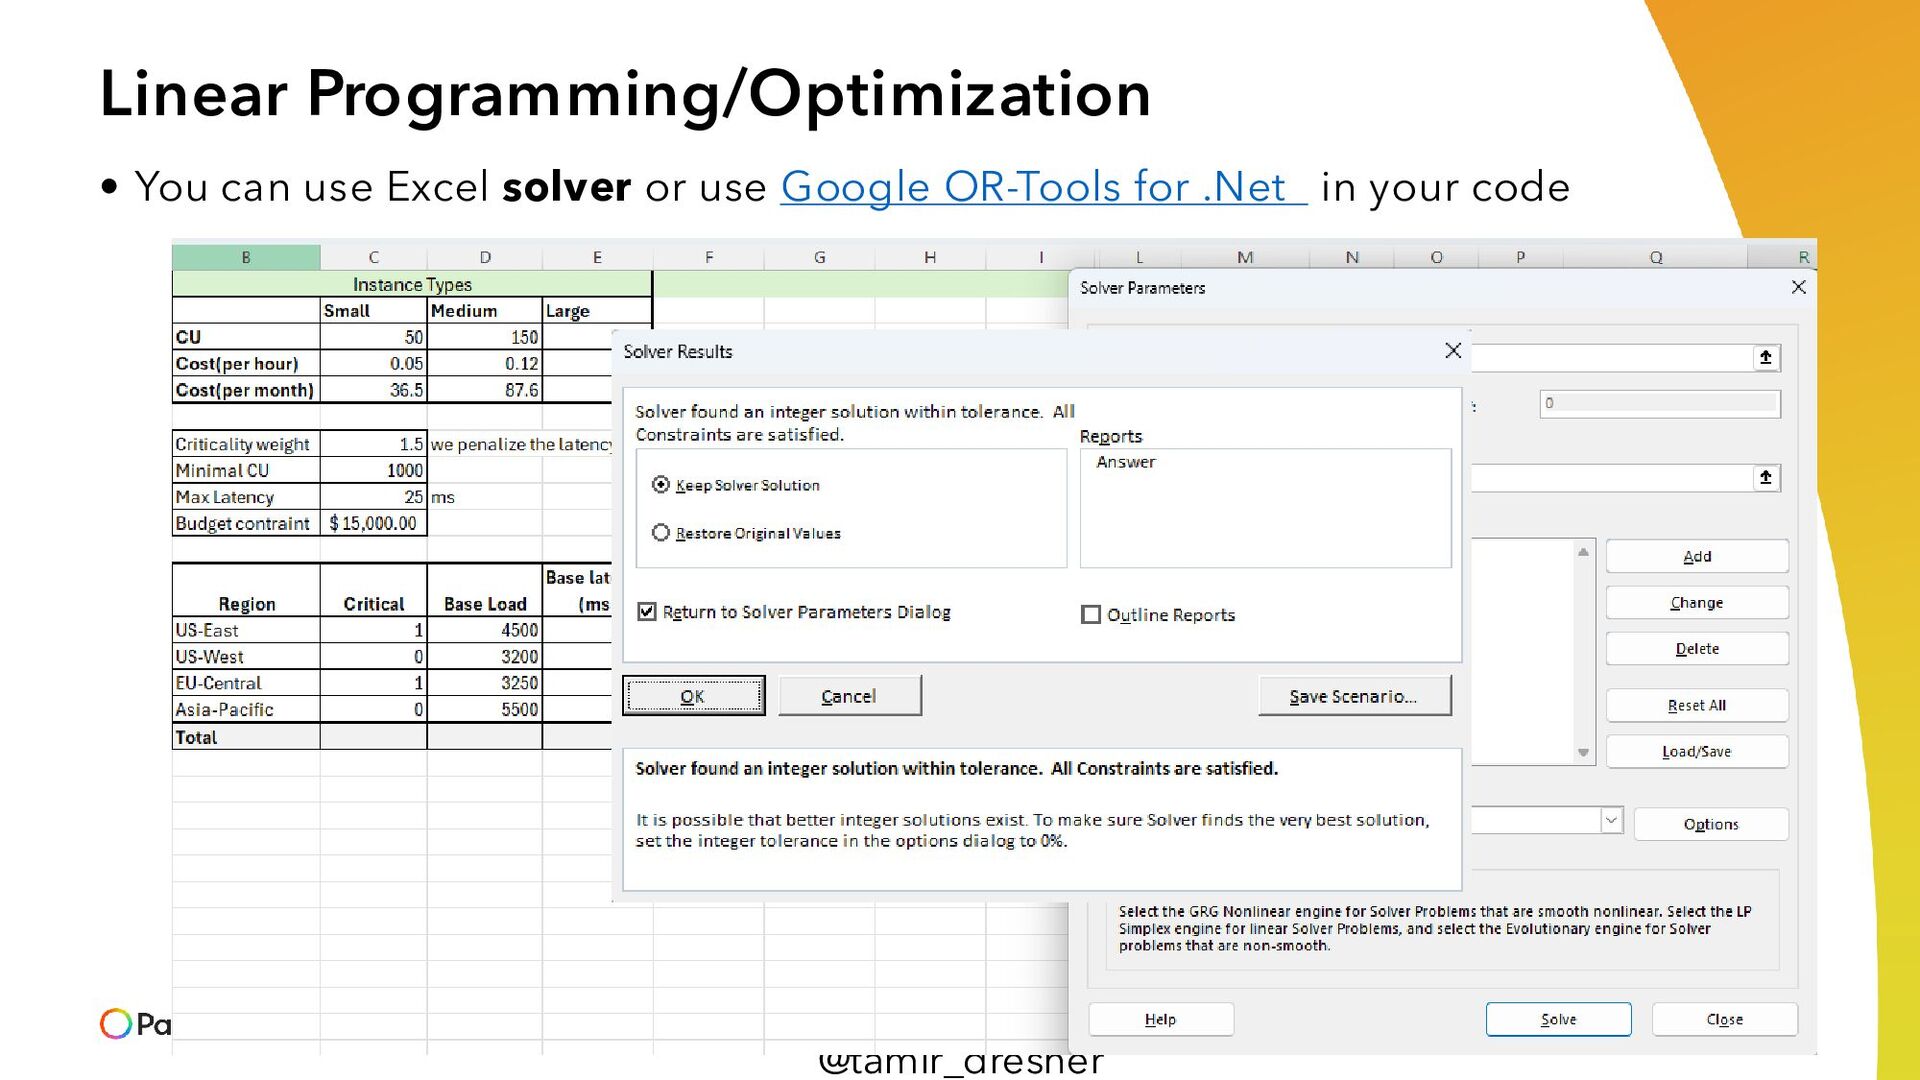
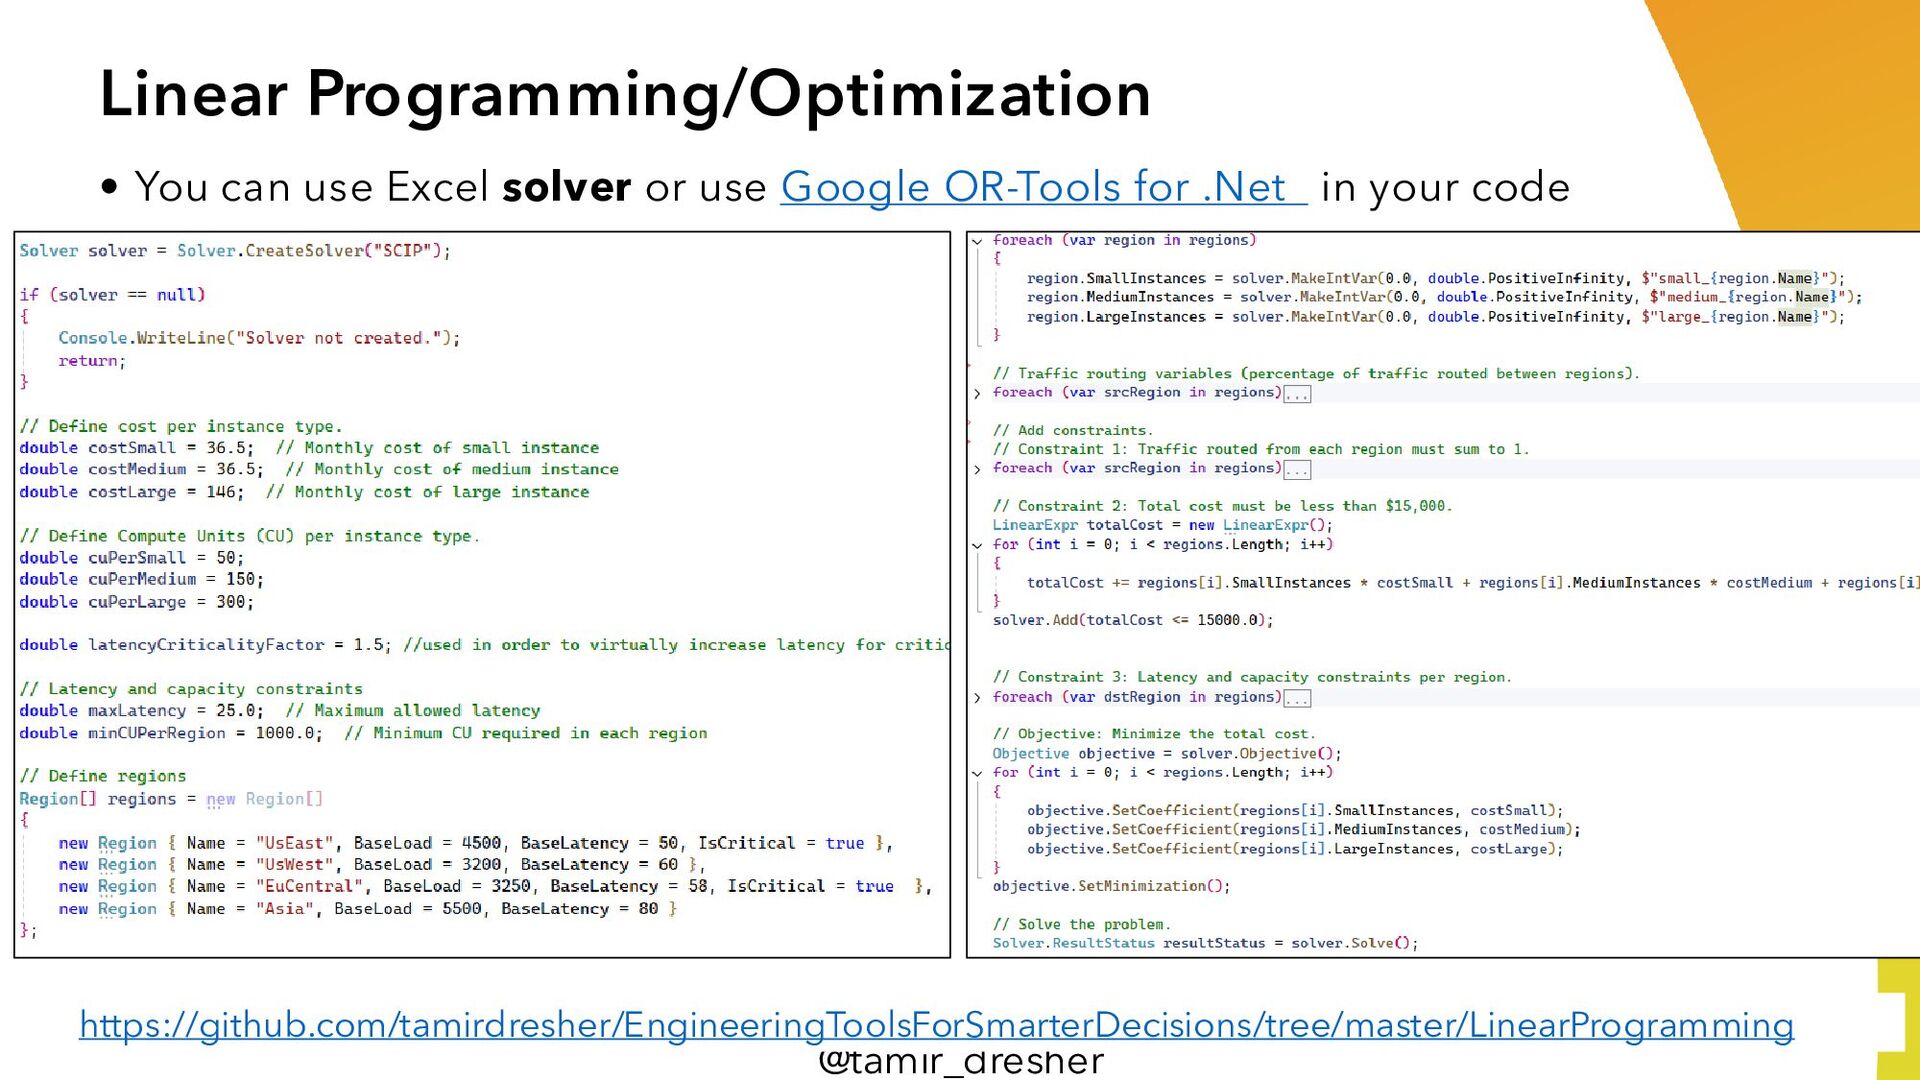
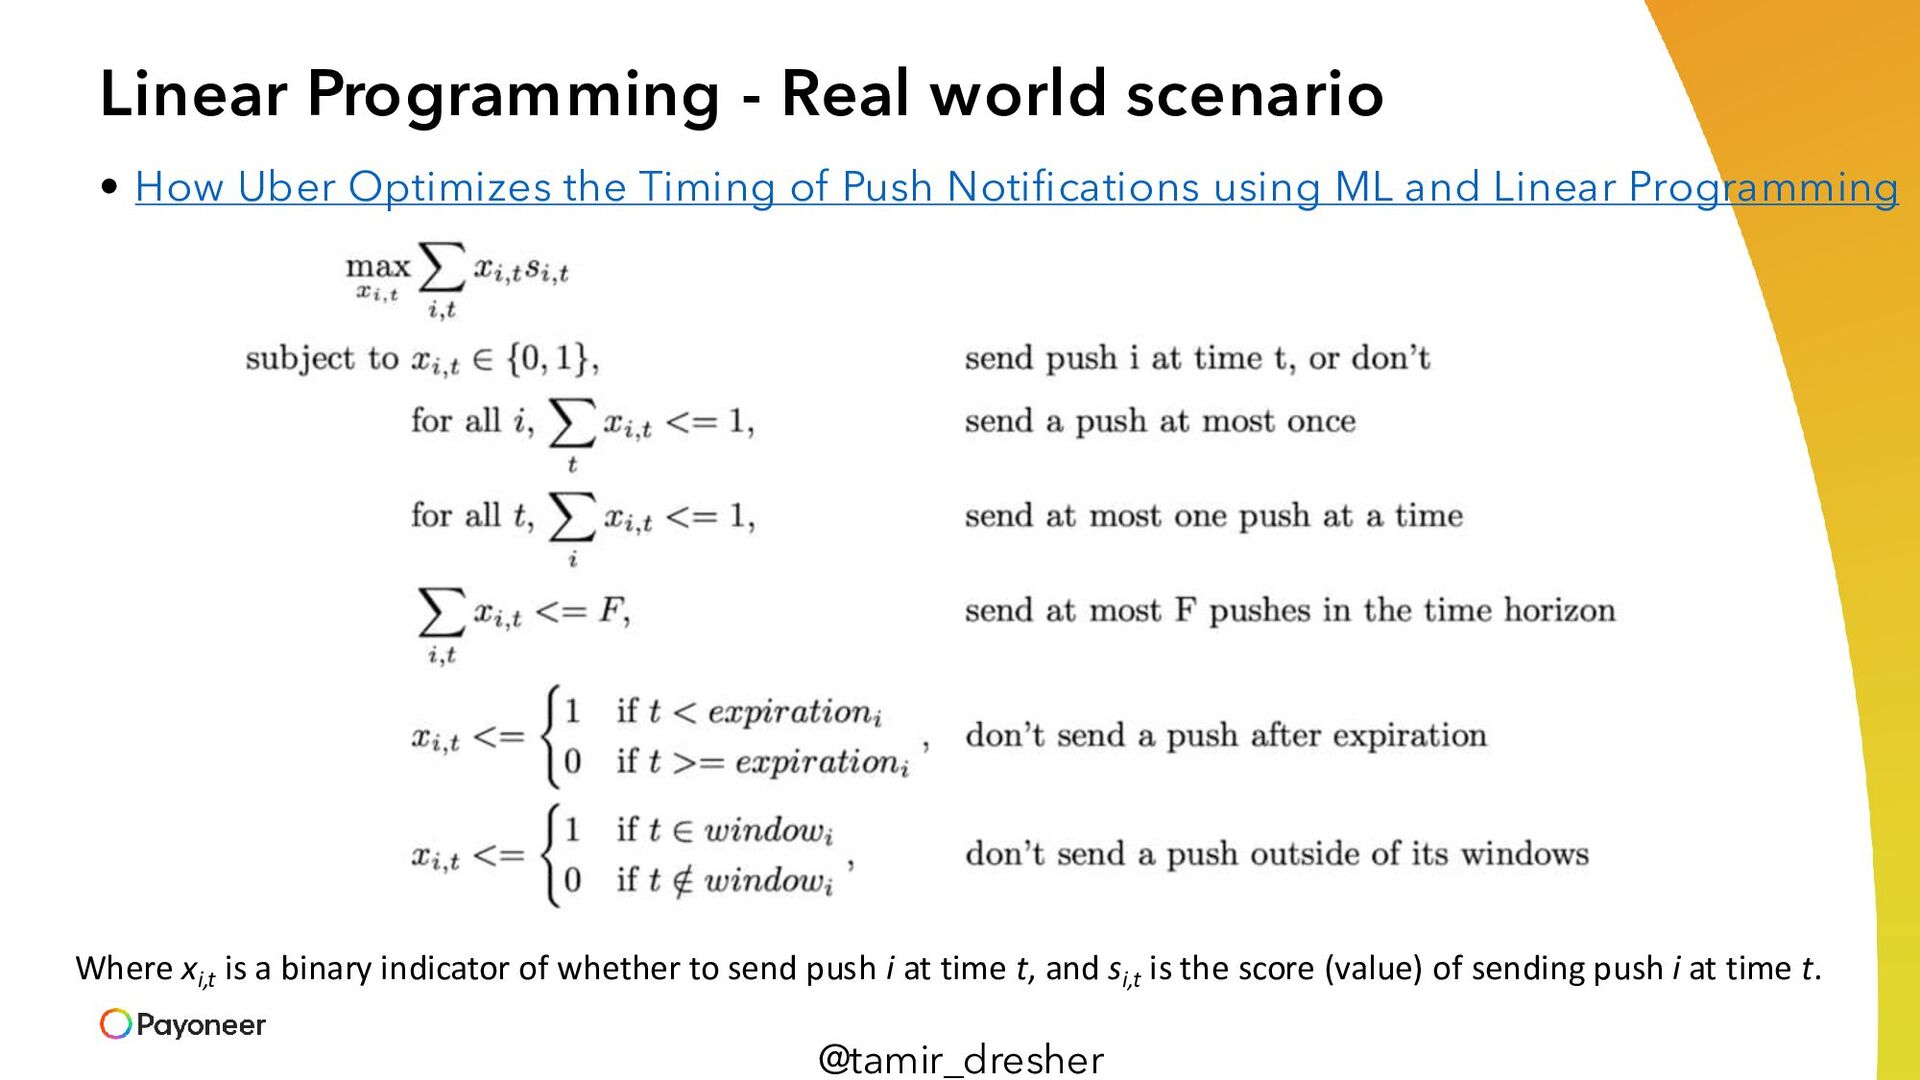
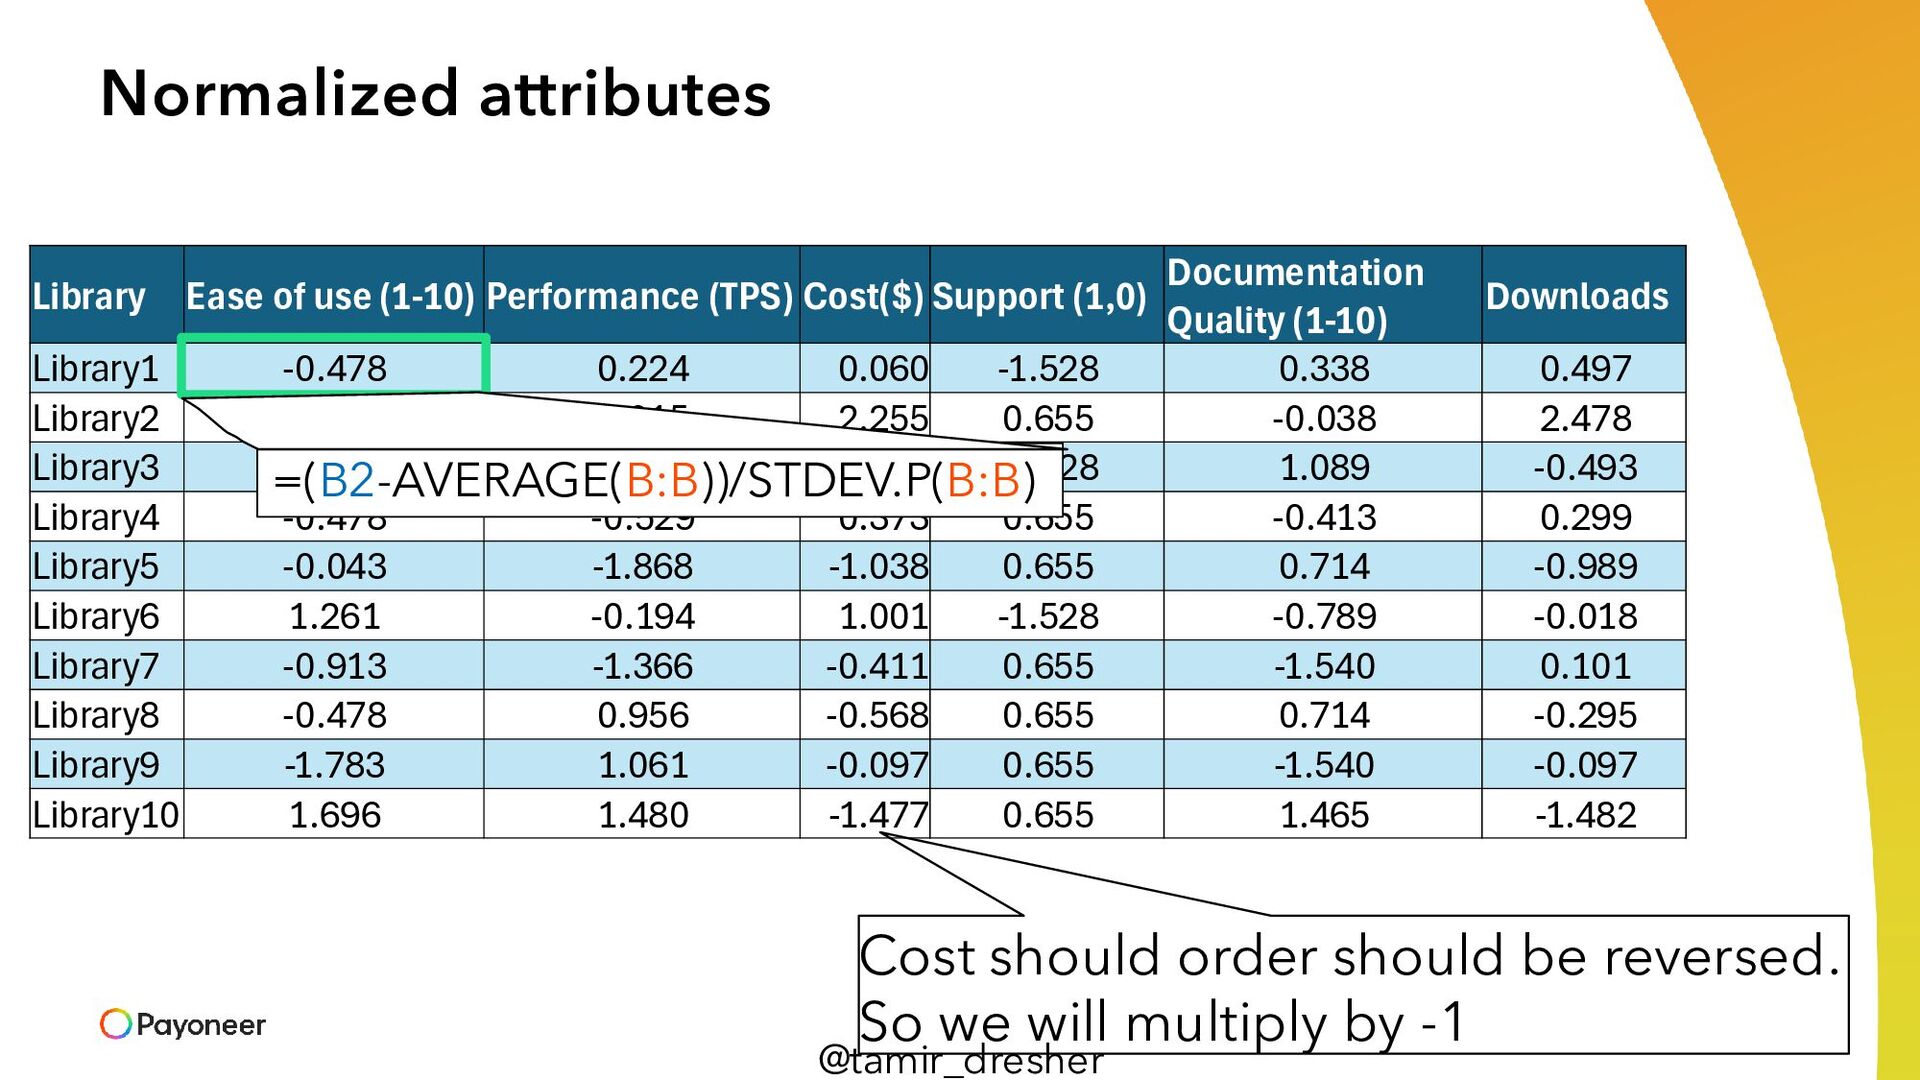
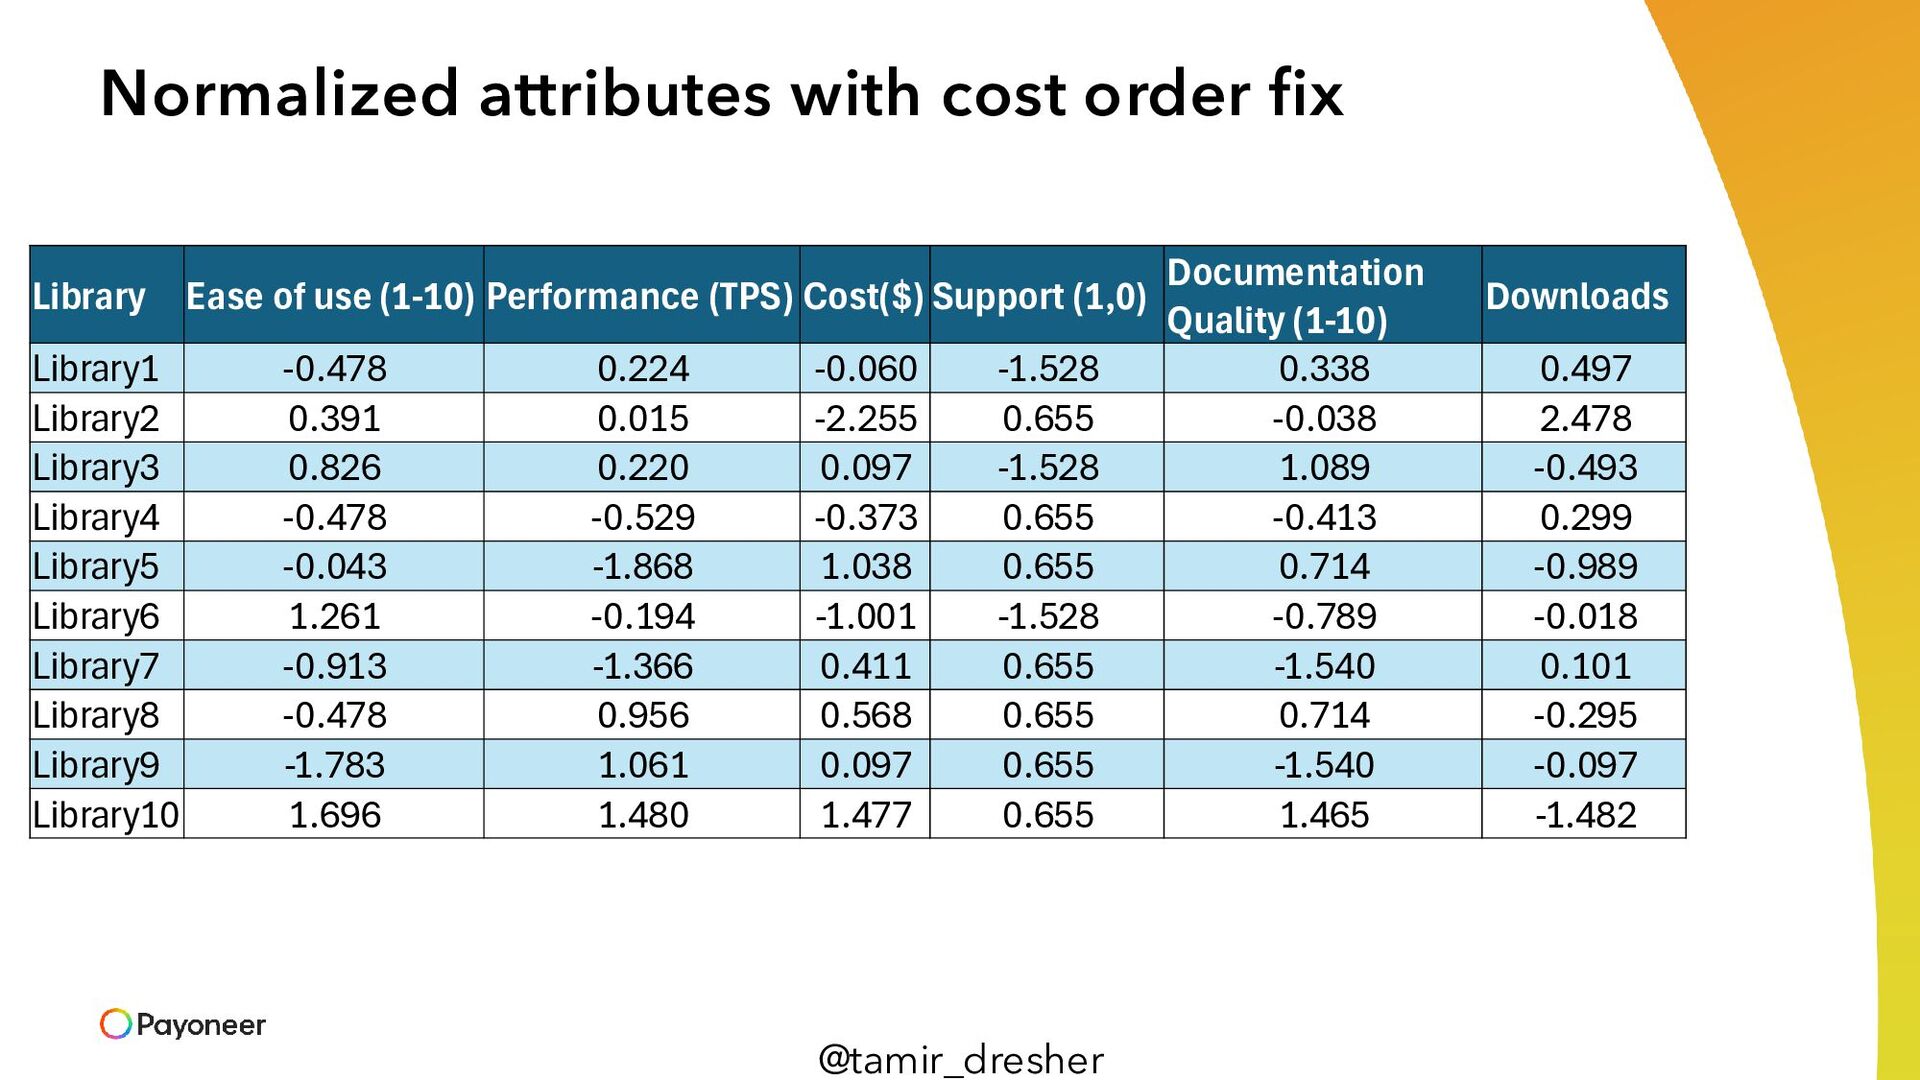
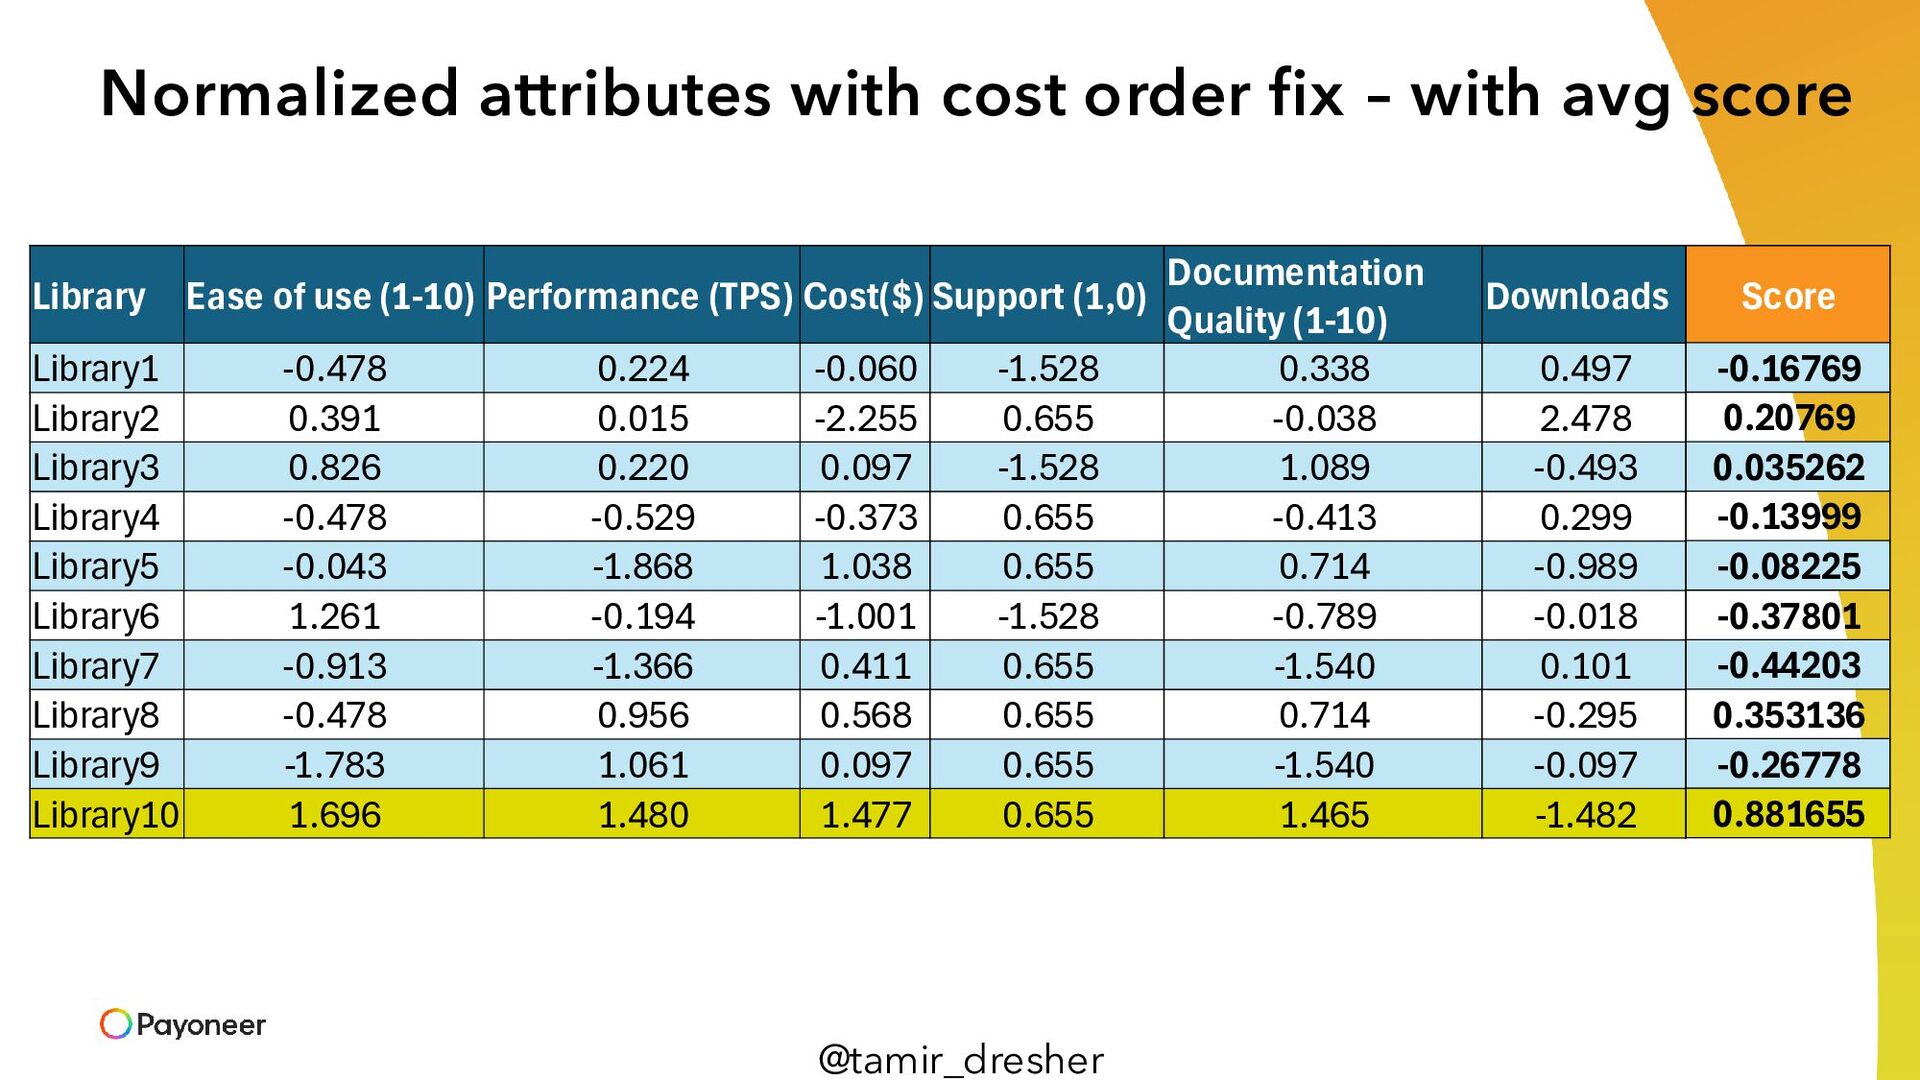
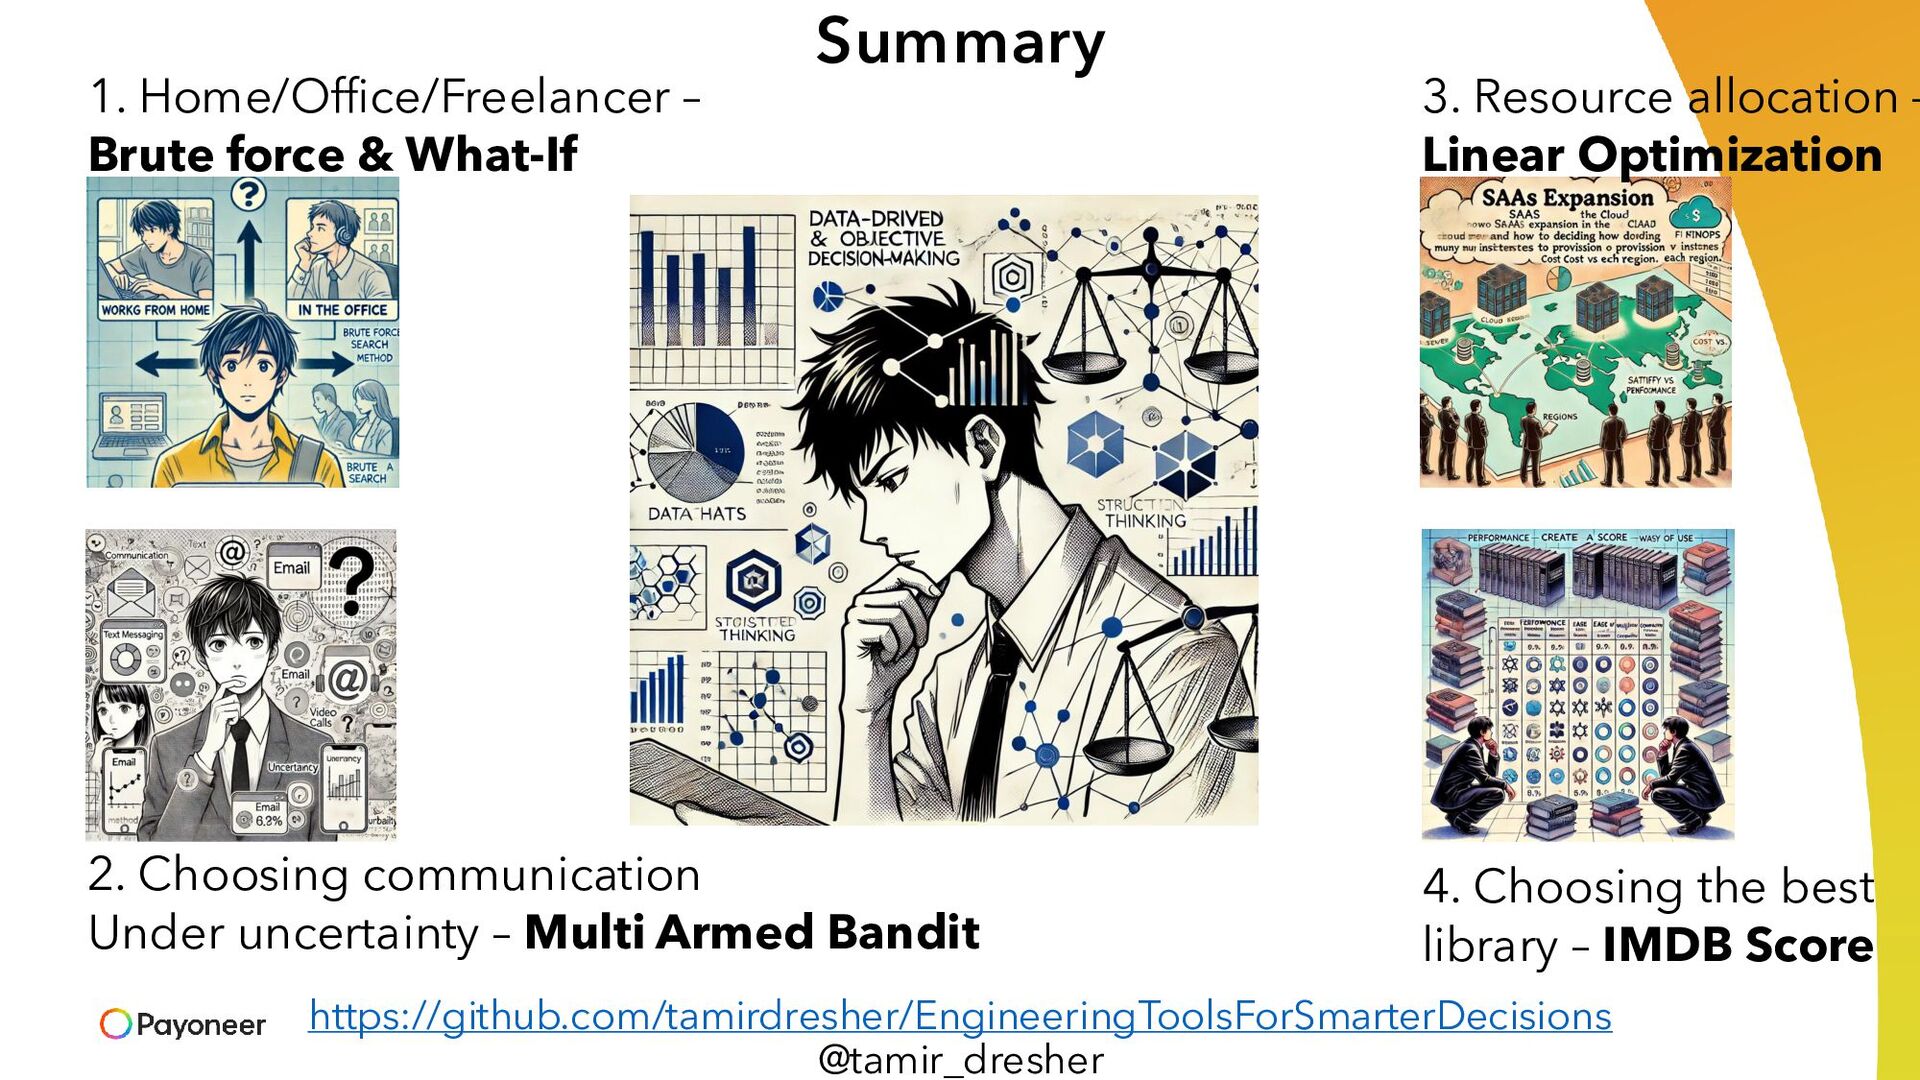
Ever wondered how to make decisions in a more methodical way? Join me in this session to discover how the arms of bandits, hidden spreadsheet tools, and even movie ratings can guide you to smarter engineering decisions. Whether you're allocating budgets in a startup, planning your next refactoring project, choosing the best library, or deciding which features your users will love most, we’ll explore practical methods that turn data into decisions and leave the guesswork behind.

Tamir Dresher

September 26, 2024
Tweet

More Decks by Tamir Dresher

Other Decks in Technology

Transcript

  1. @tamir_dresher Head of Architecture @ Who am I? Software Engineering

    Lecturer Ruppin Academic Center & My Books:
  2. @tamir_dresher Example 1: Work from home or office or take

    Freelancer • We were given a project which we estimate will take 360 Man-Days to complete • 10 people team - FTEs (Full time employees) and Freelancers each with a different cost • FTEs – Can work at home or at the office – Office has a cost and if more than 2 days, cost increase • Freelancers – Has lesser productivity than FTE but lower cost – Cost increase if more than 8 freelancers • What is the ideal combination of FTEs and Freelancers, and how many office days?
  3. @tamir_dresher Brute force • Let’s run over all the possible

    values of our variables • We can run a script BUT Excel’s build-in What-If feature is much faster
  4. @tamir_dresher Brute force • Let’s run over all the possible

    values of our variables • We can run a script BUT Excel’s build-in What-If feature is much faster Step 1 Write all values for variable 1 as rows, and all values for variable 2 as columns
  5. @tamir_dresher Brute force • Let’s run over all the possible

    values of our variables • We can run a script BUT Excel’s build-in What-If feature is much faster Step 2 Reference you target function in the upper left cell of the table
  6. @tamir_dresher Brute force • Let’s run over all the possible

    values of our variables • We can run a script BUT Excel’s build-in What-If feature is much faster Step 3 • Mark the table • Open What-If -> Data Table under the Data tab in the ribbon • Then reference the cell of the variable the top row represents and the variable the left column represents
  7. @tamir_dresher Brute force • Let’s run over all the possible

    values of our variables • We can run a script BUT Excel’s build-in What-If feature is much faster
  8. @tamir_dresher Tip 2 – Colorize your cells • Use Conditional

    Formatting to quickly find Minimal and Maximal values
  9. @tamir_dresher Brute force • Let’s run over all the possible

    values of our variables • We can run a script BUT Excel’s build-in What-If feature is much faster
  10. @tamir_dresher Example 2: Choosing the best communication method • We

    are adding a new recommendation capability to our product and the team has 2 candidate possible algorithms. We are not sure which one will perform better (which one will lead to most clicks) • Naïve A/B Testing will expose each algorithm to 50% of the users for a period of time and then compare the results. • But If one algorithm is clearly better, we might be losing significant revenue while continuing to show the underperforming one during the test period
  11. @tamir_dresher My restaurant search Corporate headquarters A B C D

    Even a broken clock shows the right time twice a day
  12. @tamir_dresher My restaurant search Corporate headquarters A B C D

    Multi Armed Bandit approach (Thompson sampling) 0 0.05 0.1 0.15 0.2 0.25 1 2 3 4 5 probability 0 0.05 0.1 0.15 0.2 0.25 1 2 3 4 5 probability 0 0.05 0.1 0.15 0.2 0.25 1 2 3 4 5 probability 0 0.05 0.1 0.15 0.2 0.25 1 2 3 4 5 probability
  13. @tamir_dresher My restaurant search Corporate headquarters A B C D

    Multi Armed Bandit approach (Thompson sampling) 0 0.05 0.1 0.15 0.2 0.25 1 2 3 4 5 probability 0 0.05 0.1 0.15 0.2 0.25 1 2 3 4 5 probability 0 0.05 0.1 0.15 0.2 0.25 1 2 3 4 5 probability 0 0.05 0.1 0.15 0.2 0.25 1 2 3 4 5 probability 0 1
  14. @tamir_dresher My restaurant search Corporate headquarters A B C D

    Multi Armed Bandit approach (Thompson sampling) 0 0.05 0.1 0.15 0.2 0.25 1 2 3 4 5 probability 0 0.05 0.1 0.15 0.2 0.25 1 2 3 4 5 probability 0 0.05 0.1 0.15 0.2 0.25 1 2 3 4 5 probability 0 0.05 0.1 0.15 0.2 0.25 1 2 3 4 5 probability 0 1 0.2 0.4 0.6 0.8 1 2 3 4 5
  15. @tamir_dresher My restaurant search Corporate headquarters A B C D

    Multi Armed Bandit approach (Thompson sampling) 0 0.05 0.1 0.15 0.2 0.25 1 2 3 4 5 probability 0 0.05 0.1 0.15 0.2 0.25 1 2 3 4 5 probability 0 0.05 0.1 0.15 0.2 0.25 1 2 3 4 5 probability 0 0.05 0.1 0.15 0.2 0.25 1 2 3 4 5 probability 0 1 0.2 0.4 0.6 0.8 1 2 3 4 5 random.NextDouble(); -> 0.5
  16. @tamir_dresher My restaurant search Corporate headquarters A B C D

    Multi Armed Bandit approach (Thompson sampling) 0 0.05 0.1 0.15 0.2 0.25 1 2 3 4 5 probability 0 0.05 0.1 0.15 0.2 0.25 1 2 3 4 5 probability 0 0.05 0.1 0.15 0.2 0.25 1 2 3 4 5 probability 0 0.05 0.1 0.15 0.2 0.25 1 2 3 4 5 probability Random sample: 3 Random sample: 2 Random sample: 4 Random sample: 1
  17. @tamir_dresher My restaurant search Corporate headquarters A B C D

    Multi Armed Bandit approach (Thompson sampling) 0 0.05 0.1 0.15 0.2 0.25 1 2 3 4 5 probability 0 0.05 0.1 0.15 0.2 0.25 1 2 3 4 5 probability 0 0.05 0.1 0.15 0.2 0.25 1 2 3 4 5 probability 0 0.05 0.1 0.15 0.2 0.25 1 2 3 4 5 probability Random sample: 3 Random sample: 2 Random sample: 4 Random sample: 1
  18. @tamir_dresher My restaurant search Corporate headquarters A B C D

    Multi Armed Bandit approach (Thompson sampling) 0 0.05 0.1 0.15 0.2 0.25 1 2 3 4 5 probability 0 0.05 0.1 0.15 0.2 0.25 1 2 3 4 5 probability 0 0.05 0.1 0.15 0.2 0.25 1 2 3 4 5 probability
  19. @tamir_dresher My restaurant search Corporate headquarters A B C D

    Multi Armed Bandit approach (Thompson sampling) 0 0.05 0.1 0.15 0.2 0.25 1 2 3 4 5 probability 0 0.05 0.1 0.15 0.2 0.25 1 2 3 4 5 probability 0 0.05 0.1 0.15 0.2 0.25 1 2 3 4 5 probability 0 0.05 0.1 0.15 0.2 0.25 0.3 0.35 0.4 1 2 3 4 5 probability
  20. @tamir_dresher My restaurant search Corporate headquarters A B C D

    Multi Armed Bandit approach (Thompson sampling) 0 0.05 0.1 0.15 0.2 0.25 1 2 3 4 5 probability 0 0.05 0.1 0.15 0.2 0.25 1 2 3 4 5 probability 0 0.05 0.1 0.15 0.2 0.25 1 2 3 4 5 probability 0 0.05 0.1 0.15 0.2 0.25 0.3 0.35 0.4 1 2 3 4 5 probability
  21. @tamir_dresher My restaurant search Corporate headquarters A B C D

    Multi Armed Bandit approach (Thompson sampling) 0 0.05 0.1 0.15 0.2 0.25 1 2 3 4 5 probability 0 0.05 0.1 0.15 0.2 0.25 1 2 3 4 5 probability 0 0.05 0.1 0.15 0.2 0.25 1 2 3 4 5 probability 0 0.05 0.1 0.15 0.2 0.25 0.3 0.35 0.4 1 2 3 4 5 probability Random sample: 4 Random sample: 2 Random sample: 3 Random sample: 1
  22. @tamir_dresher My restaurant search Corporate headquarters A B C D

    Multi Armed Bandit approach (Thompson sampling) 0 0.05 0.1 0.15 0.2 0.25 1 2 3 4 5 probability 0 0.05 0.1 0.15 0.2 0.25 1 2 3 4 5 probability 0 0.05 0.1 0.15 0.2 0.25 1 2 3 4 5 probability 0 0.05 0.1 0.15 0.2 0.25 0.3 0.35 0.4 1 2 3 4 5 probability
  23. @tamir_dresher My restaurant search Corporate headquarters A B C D

    Multi Armed Bandit approach (Thompson sampling) 0 0.05 0.1 0.15 0.2 0.25 1 2 3 4 5 probability 0 0.05 0.1 0.15 0.2 0.25 1 2 3 4 5 probability 0 0.05 0.1 0.15 0.2 0.25 0.3 0.35 0.4 1 2 3 4 5 probability
  24. @tamir_dresher Multi Armed Bandit - summary • Balancing exploration (trying

    new options) and exploitation (choosing the best- known option) across multiple choices (e.g., restaurants, features). • The goal is to maximize reward over time by dynamically updating the selection process based on feedback. • Thompson sampling – generate a random value per each item/option by using it distribution array and select the item with the highest value – Beta distribution is a preferred way to do so
  25. @tamir_dresher Example 3: SaaS expansion in the cloud • Our

    SaaS product becomes massively popular and has been expanded into multiple regions in the cloud. Each region has different load and base latency. We want to optimize the cost while maintaining high performance and availability to all users • Decisions to make: – How many instance per each resource type in each region? – How to distribute the load between the regions? • Constraints: – Each region must provide at least 100,000 compute units (CU) – Latency must stay below a certain threshold – Some regions are critical and should have lower latency and availability – Our budget has a limit of 15K USD
  26. @tamir_dresher Formalize the problem (1) Region Critical Base Load Base

    latency (ms) Routed load to (0..1) Instances US-East US-West EU- Central Asia- Pacific #Small #Medium #Large US-East 1 4500 50 ? ? ? ? ? ? ? US-West 0 3200 60 ? ? ? ? ? ? ? EU-Central 1 3250 58 ? ? ? ? ? ? ? Asia-Pacific 0 5500 80 ? ? ? ? ? ? ? 𝑅𝑒𝑔𝑖𝑜𝑛 𝐿𝑎𝑡𝑒𝑛𝑐𝑦 = 𝐵𝑎𝑠𝑒𝐿𝑎𝑡𝑒𝑛𝑐𝑦 × 𝑅𝑒𝑔𝑖𝑜𝑛 𝐿𝑜𝑎𝑑 𝐶𝑜𝑚𝑝𝑢𝑡𝑒 𝑈𝑛𝑖𝑡𝑠 × 1 𝐶𝑟𝑖𝑡𝑖𝑐𝑎𝑙𝑖𝑡𝑦 𝑊𝑒𝑖𝑔ℎ𝑡 Increase Latency to virtually demand more resources Minimize Cost = (#Smallus-east +…+#SmallAsia )*Costsmall +…+ (#Largeus-east +…+#LargeAsia )*Costlarge
  27. @tamir_dresher Formalize the problem (1) Region Critical Base Load Base

    latency (ms) Routed load to (0..1) Instances US-East US-West EU- Central Asia- Pacific #Small #Medium #Large US-East 1 4500 50 ? ? ? ? ? ? ? US-West 0 3200 60 ? ? ? ? ? ? ? EU-Central 1 3250 58 ? ? ? ? ? ? ? Asia-Pacific 0 5500 80 ? ? ? ? ? ? ? Constraints: • Regions routed load sum to 1 • Instance count are integers • Cost<15,000$ • Latency < MAX_LATENCY • Each region has minimal capacity Minimize Cost = (#Smallus-east +…+#SmallAsia )*Costsmall +…+ (#Largeus-east +…+#LargeAsia )*Costlarge
  28. @tamir_dresher Linear Programming/Optimization • You can use Excel solver or

    use Google OR-Tools for .Net in your code https://github.com/tamirdresher/EngineeringToolsForSmarterDecisions/tree/master/LinearProgramming
  29. @tamir_dresher Linear Programming - Real world scenario • How Uber

    Optimizes the Timing of Push Notifications using ML and Linear Programming Where xi,t is a binary indicator of whether to send push i at time t, and si,t is the score (value) of sending push i at time t.
  30. @tamir_dresher Example 4: Deciding which Framework/Library to use • You're

    tasked with choosing a third-party library for the upcoming project. you need to consider several factors to ensure you pick the right one from 10 potential libraries. Each library is evaluated based on these attributes: 1. Ease of Use 2. Performance 3. Cost 4. Support and Community 5. Documentation Quality 6. Downloads/Stars
  31. @tamir_dresher Example 4: Deciding which Framework/Library to use Library Ease

    of use (1-10) Performance (TPS) Cost($) Support (1,0) Documentation Quality (1-10) Downloads Library1 5 700 500 0 7 1000 Library2 7 650 1200 1 6 2000 Library3 8 699 450 0 9 500 Library4 5 520 600 1 5 900 Library5 6 200 150 1 8 250 Library6 9 600 800 0 4 740 Library7 4 320 350 1 2 800 Library8 5 875 300 1 8 600 Library9 2 900 450 1 2 700 Library10 10 1000 10 1 10 1 Issues: • Scale is not comparable • For cost, larger value should give lower score • How should we take #Downloads into account
  32. @tamir_dresher Normalizing the data • Each attribute has different scales

    of importance attributes like cost (which have a wider range) have a disproportionate impact on the decision • min-max normalization – transform to a range of [0,1] 𝑁𝑜𝑟𝑚𝑎𝑙𝑖𝑧𝑒𝑑 𝑉𝑎𝑙𝑢𝑒 = 𝑉𝑎𝑙𝑢𝑒 − 𝑀𝑖𝑛 𝑀𝑎𝑥 − 𝑀𝑖𝑛 • Z-score – transforms to a range of [-1,1] 𝑍 = 𝑉𝑎𝑙𝑢𝑒 − 𝐴𝑣𝑒𝑟𝑎𝑔𝑒 𝑆𝑡𝑑𝐷𝑒𝑣 (ןקת תייטס) min-max makes numbers fit between 0 and 1, while z-score shows how far each number is from the average, using the idea of "how spread out" the numbers are.
  33. @tamir_dresher Normalized attributes Library Ease of use (1-10) Performance (TPS)

    Cost($) Support (1,0) Documentation Quality (1-10) Downloads Library1 -0.478 0.224 0.060 -1.528 0.338 0.497 Library2 0.391 0.015 2.255 0.655 -0.038 2.478 Library3 0.826 0.220 -0.097 -1.528 1.089 -0.493 Library4 -0.478 -0.529 0.373 0.655 -0.413 0.299 Library5 -0.043 -1.868 -1.038 0.655 0.714 -0.989 Library6 1.261 -0.194 1.001 -1.528 -0.789 -0.018 Library7 -0.913 -1.366 -0.411 0.655 -1.540 0.101 Library8 -0.478 0.956 -0.568 0.655 0.714 -0.295 Library9 -1.783 1.061 -0.097 0.655 -1.540 -0.097 Library10 1.696 1.480 -1.477 0.655 1.465 -1.482 =(B2-AVERAGE(B:B))/STDEV.P(B:B) Cost should order should be reversed. So we will multiply by -1
  34. @tamir_dresher Normalized attributes with cost order fix Library Ease of

    use (1-10) Performance (TPS) Cost($) Support (1,0) Documentation Quality (1-10) Downloads Library1 -0.478 0.224 -0.060 -1.528 0.338 0.497 Library2 0.391 0.015 -2.255 0.655 -0.038 2.478 Library3 0.826 0.220 0.097 -1.528 1.089 -0.493 Library4 -0.478 -0.529 -0.373 0.655 -0.413 0.299 Library5 -0.043 -1.868 1.038 0.655 0.714 -0.989 Library6 1.261 -0.194 -1.001 -1.528 -0.789 -0.018 Library7 -0.913 -1.366 0.411 0.655 -1.540 0.101 Library8 -0.478 0.956 0.568 0.655 0.714 -0.295 Library9 -1.783 1.061 0.097 0.655 -1.540 -0.097 Library10 1.696 1.480 1.477 0.655 1.465 -1.482
  35. @tamir_dresher Normalized attributes with cost order fix – with avg

    score Library Ease of use (1-10) Performance (TPS) Cost($) Support (1,0) Documentation Quality (1-10) Downloads Library1 -0.478 0.224 -0.060 -1.528 0.338 0.497 Library2 0.391 0.015 -2.255 0.655 -0.038 2.478 Library3 0.826 0.220 0.097 -1.528 1.089 -0.493 Library4 -0.478 -0.529 -0.373 0.655 -0.413 0.299 Library5 -0.043 -1.868 1.038 0.655 0.714 -0.989 Library6 1.261 -0.194 -1.001 -1.528 -0.789 -0.018 Library7 -0.913 -1.366 0.411 0.655 -1.540 0.101 Library8 -0.478 0.956 0.568 0.655 0.714 -0.295 Library9 -1.783 1.061 0.097 0.655 -1.540 -0.097 Library10 1.696 1.480 1.477 0.655 1.465 -1.482 Score -0.16769 0.20769 0.035262 -0.13999 -0.08225 -0.37801 -0.44203 0.353136 -0.26778 0.881655
  36. @tamir_dresher IMDB Score 𝐼𝑀𝐷𝐵 𝑆𝑐𝑜𝑟𝑒 = 𝑁𝑢𝑚𝑏𝑒𝑟𝑂𝑓𝑉𝑜𝑡𝑒𝑠 ∗ 𝑀𝑜𝑣𝑖𝑒𝐴𝑣𝑔𝑅𝑎𝑡𝑖𝑛𝑔 +

    𝑚𝑖𝑛𝑉𝑜𝑡𝑒𝑠 ∗ 𝐴𝑣𝑔𝑅𝑎𝑡𝑖𝑛𝑔𝑂𝑓𝐴𝑙𝑙𝑀𝑜𝑣𝑖𝑒𝑠 𝑁𝑢𝑚𝑏𝑒𝑟𝑂𝑓𝑉𝑜𝑡𝑒𝑠 + 𝑚𝑖𝑛𝑉𝑜𝑡𝑒𝑠 𝐿𝑖𝑏𝑟𝑎𝑟𝑦 𝑆𝑐𝑜𝑟𝑒 = 𝐷𝑜𝑤𝑛𝑙𝑜𝑎𝑑𝑠 ∗ 𝐿𝑖𝑏𝐴𝑣𝑔𝑆𝑐𝑜𝑟𝑒 + 𝑚𝑖𝑛𝐷𝑜𝑤𝑛𝑙𝑜𝑎𝑑𝑠 ∗ 𝐴𝑣𝑔𝑆𝑐𝑜𝑟𝑒 𝐷𝑜𝑤𝑛𝑙𝑜𝑎𝑑𝑠 + 𝑚𝑖𝑛𝐷𝑜𝑤𝑛𝑙𝑜𝑎𝑑𝑠
  37. @tamir_dresher Example 4: Deciding which Framework/Library to use Library Ease

    of use (1-10) Performance (TPS) Cost($) Support (1,0) Documentation Quality (1-10) Downloads Score (Normalized + IMDB) Library1 5 700 500 0 7 1000 -0.27329 Library2 7 650 1200 1 6 2000 -0.23461 Library3 8 699 450 0 9 500 0.1175 Library4 5 520 600 1 5 900 -0.20499 Library5 6 200 150 1 8 250 0.070731 Library6 9 600 800 0 4 740 -0.39643 Library7 4 320 350 1 2 800 -0.48942 Library8 5 875 300 1 8 600 0.413856 Library9 2 900 450 1 2 700 -0.26415 Library10 10 1000 10 1 10 1 0.01341 Final results
  38. @tamir_dresher Summary 1. Home/Office/Freelancer – Brute force & What-If 2.

    Choosing communication Under uncertainty – Multi Armed Bandit 3. Resource allocation – Linear Optimization 4. Choosing the best library – IMDB Score https://github.com/tamirdresher/EngineeringToolsForSmarterDecisions