Upgrade to Pro — share decks privately, control downloads, hide ads and more …

Oracle X$TRACE, Background Process Communication and Exotic Wait Events

Tanel Poder
April 19, 2024
8

Oracle X$TRACE, Background Process Communication and Exotic Wait Events

Video recordings available at:

https://tanelpoder.com/videos/

Tanel Poder

April 19, 2024
Tweet

Transcript

  1. 1 Oracle Background Process Communication, Exotic Wait Events and Some

    Tracing too https://tanelpoder.com @tanelpoder
  2. 2 Advanced Oracle Troubleshooting Training By Tanel Poder | https://blog.tanelpoder.com/seminar/

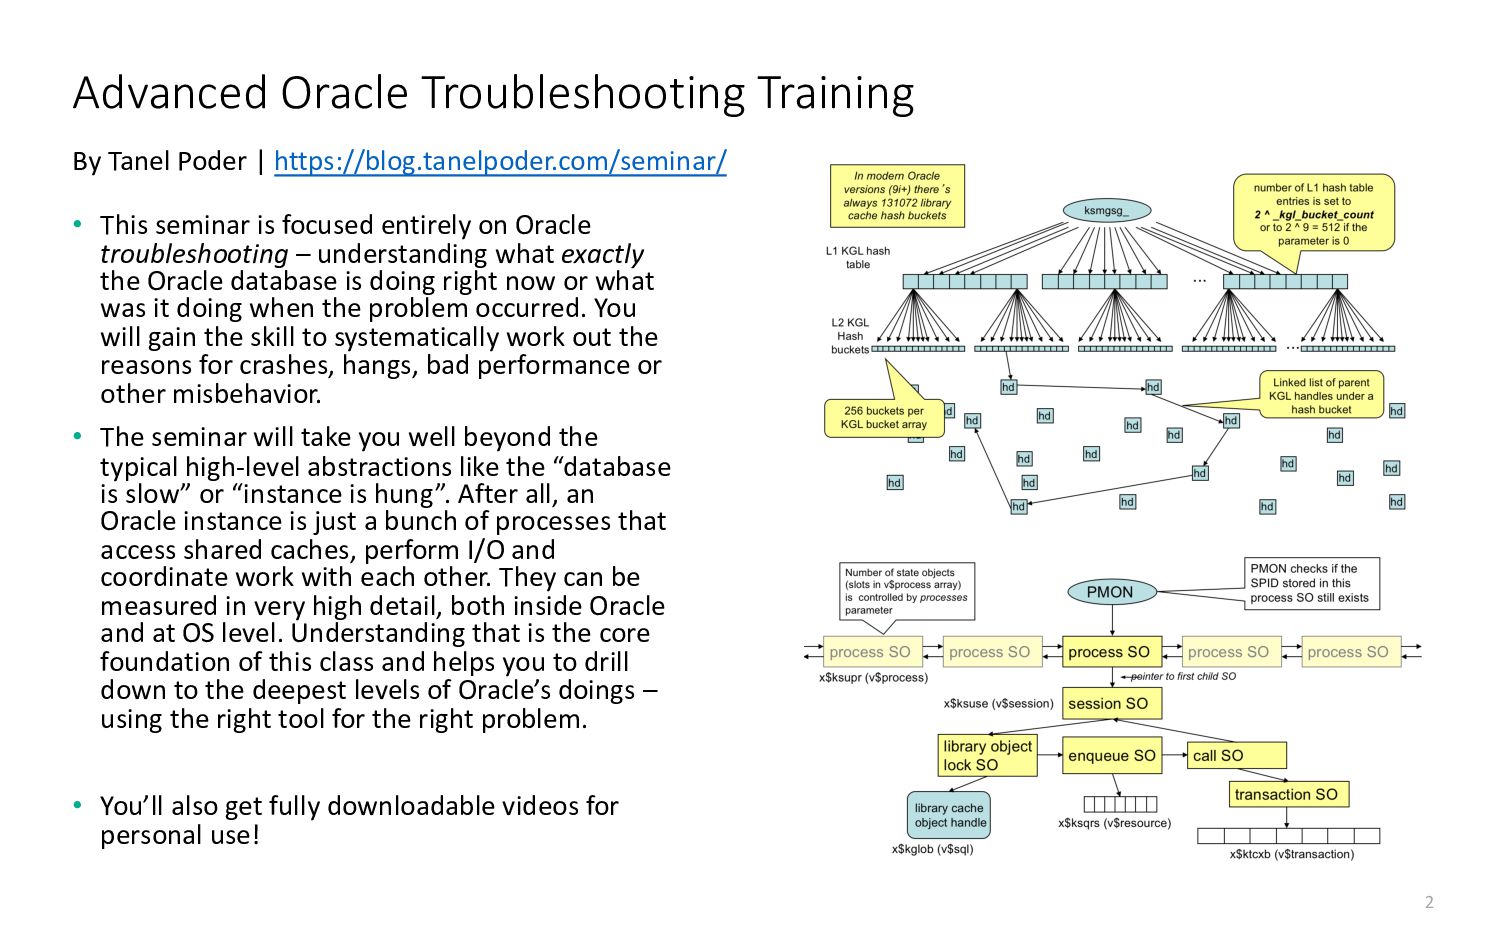
    • This seminar is focused entirely on Oracle troubleshooting – understanding what exactly the Oracle database is doing right now or what was it doing when the problem occurred. You will gain the skill to systematically work out the reasons for crashes, hangs, bad performance or other misbehavior. • The seminar will take you well beyond the typical high-level abstractions like the “database is slow” or “instance is hung”. After all, an Oracle instance is just a bunch of processes that access shared caches, perform I/O and coordinate work with each other. They can be measured in very high detail, both inside Oracle and at OS level. Understanding that is the core foundation of this class and helps you to drill down to the deepest levels of Oracle’s doings – using the right tool for the right problem. • You’ll also get fully downloadable videos for personal use!
  3. 3 • This is a hacking session, not formal training

    with slides and structure • Mostly hands on in sqlplus and shell • Demos will break • Wait Events • DISPLAY_NAME • Transient wait events • KST Tracing / X$TRACE • Multi-level (nested) wait events • Background Process communication • KSR Channels, Actions & Messages • X$TRACING the reliable message wait event Topics
  4. 7 Transient Wait Events - Process State Dump Where did

    the “read request” wait events go?!
  5. 8 • KST = Kernel Server Trace • @oddc kst

    • Always enabled in-memory ring buffer tracing • trace_enabled = true (enable in memory tracing) • _trace_buffers = ALL:256 (trace buffer sizes per process) • X$TRACE & X$TRACE_EVENTS • @xt.sql @xtall.sql • ALTER TRACING ENABLE “event#:level:OPID” • ALTER TRACING ENABLE “10706:1:ALL” -- Global Enqueue KST tracing • Multiple IPC and RAC CIC events are always enabled by default • @grp event x$trace • http://download.oracle.com/owsf_2003/40248_cai.ppt KST Tracing
  6. 9 KST Tracing • KST Trace buckets are dumped on

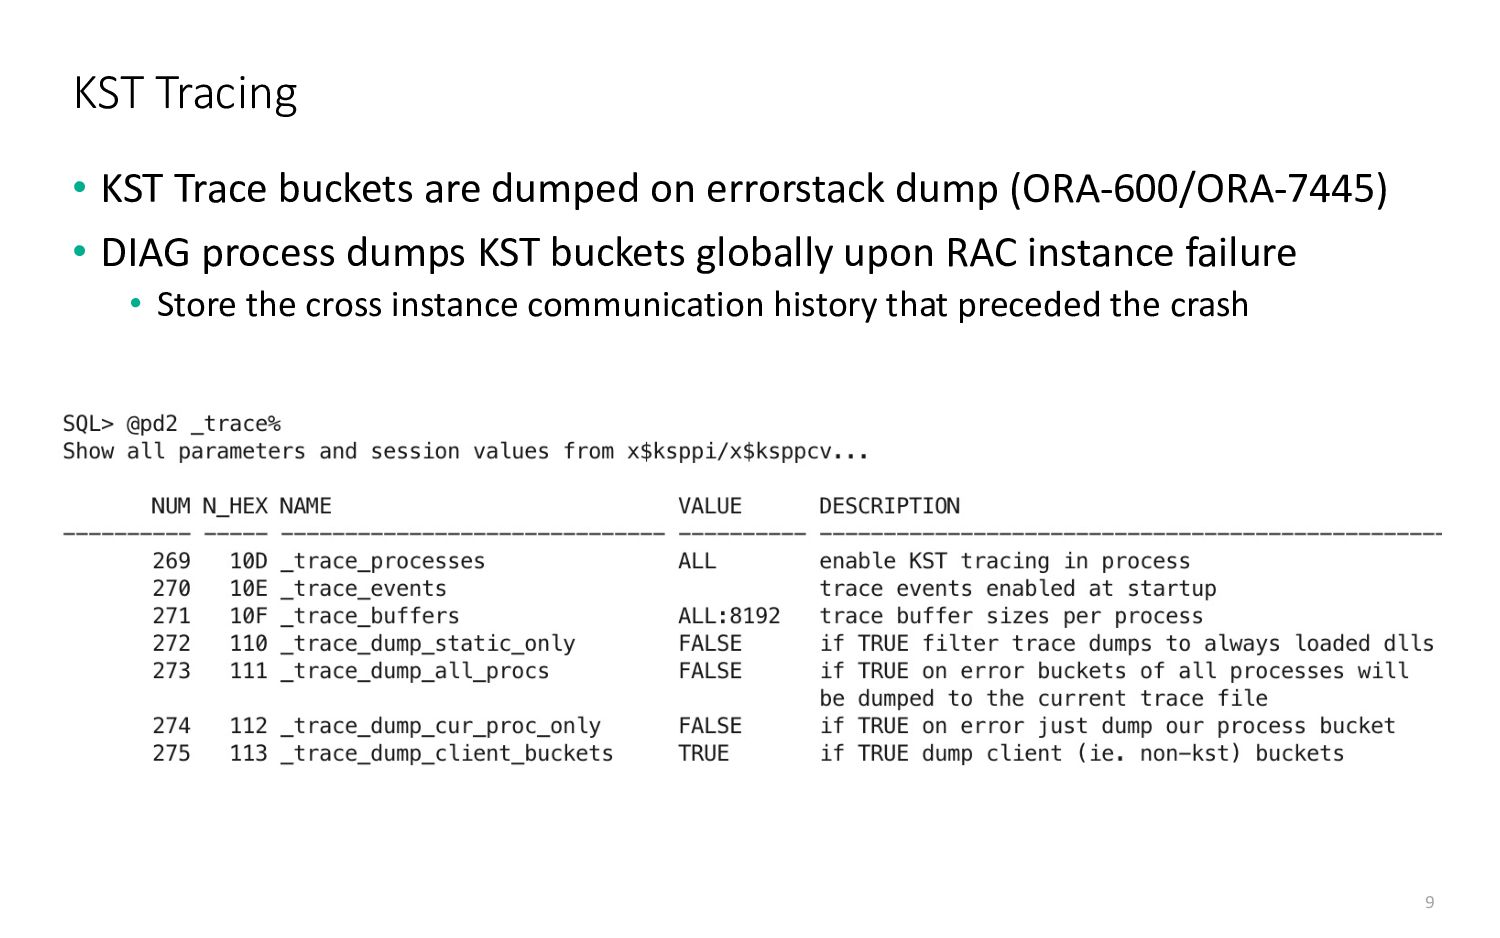
    errorstack dump (ORA-600/ORA-7445) • DIAG process dumps KST buckets globally upon RAC instance failure • Store the cross instance communication history that preceded the crash
  7. 10 • Usually they show up when complex communication is

    needed between Oracle DB and ASM/Grid/CSS processes • ALTER DATABASE DATAFILE x RESIZE....; • Demo (if have time) Nested (multi-level) Wait Events
  8. 11 • ALTER TABLESPACE x ONLINE • Tablespace on ASM

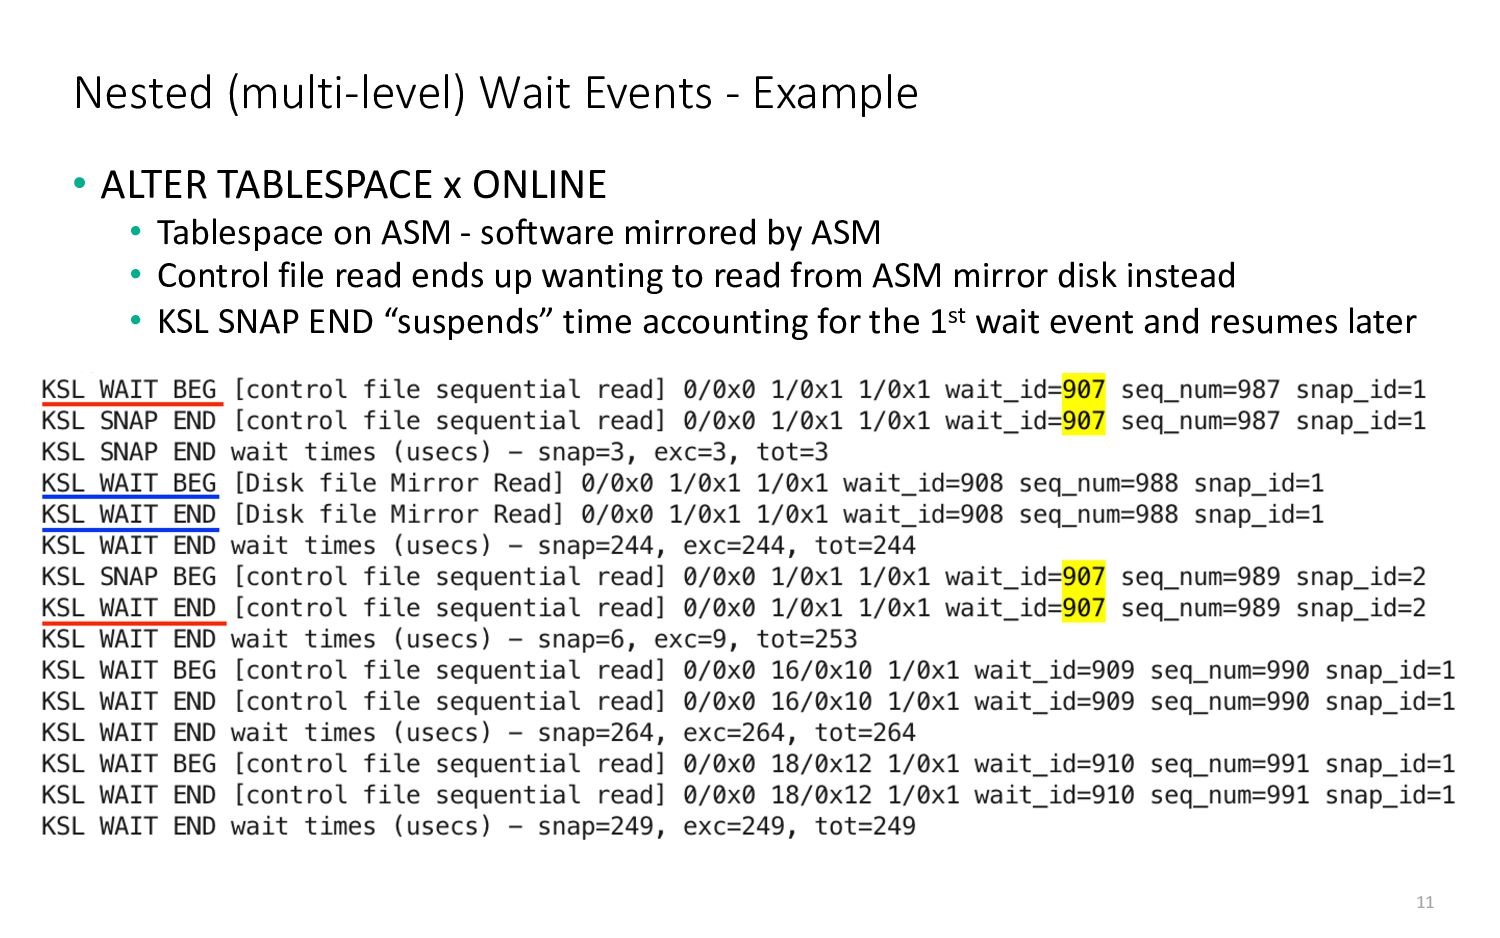
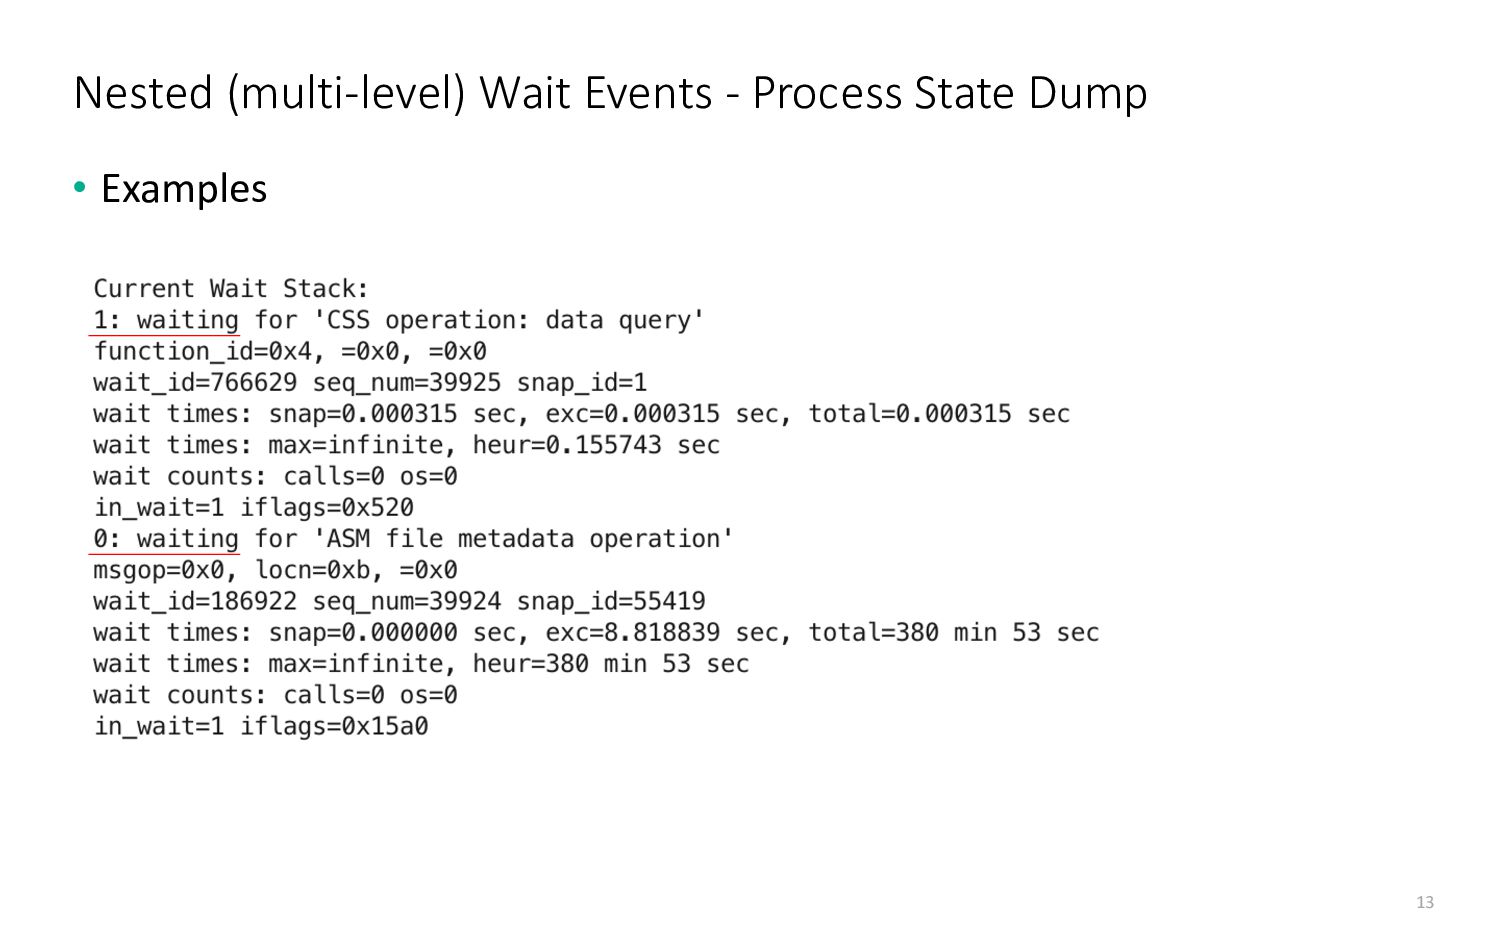
    - software mirrored by ASM • Control file read ends up wanting to read from ASM mirror disk instead • KSL SNAP END “suspends” time accounting for the 1st wait event and resumes later Nested (multi-level) Wait Events - Example
  9. 16 • Not all background processes communicate the same way

    • Unix semaphores are just used for process sleep/wakeup - not for messaging “payload” • Similar with thread-level post/wait with futexes • LGWR in 11.2.0.3+ can avoid foreground wakeup syscall overhead • Foregrounds poll for sync completion instead of waiting for semaphore post • _use_adaptive_log_file_sync • https://fritshoogland.wordpress.com/2015/09/29/how-the-log-writer-and-foreground-processes- work-together-on-commit/ • ORADEBUG works by sending a SIGUSR2 signal to the inspected process • The signal handler in the target process will do the dumping • RAC cross-instance calls are also different • Higher level messaging over network sockets Background process communication - sleep/wakeup (post/wait)
  10. 17 • Used for storing & exchanging message payloads •

    @channels.sql 1=1 • V$CHANNEL_WAITS • X$MESSAGES • X$KSBTABACT (background process “action“ list) KSR Communication Channels
  11. 18 • @segcached soe.% • @grp status,dirty v$bh • alter

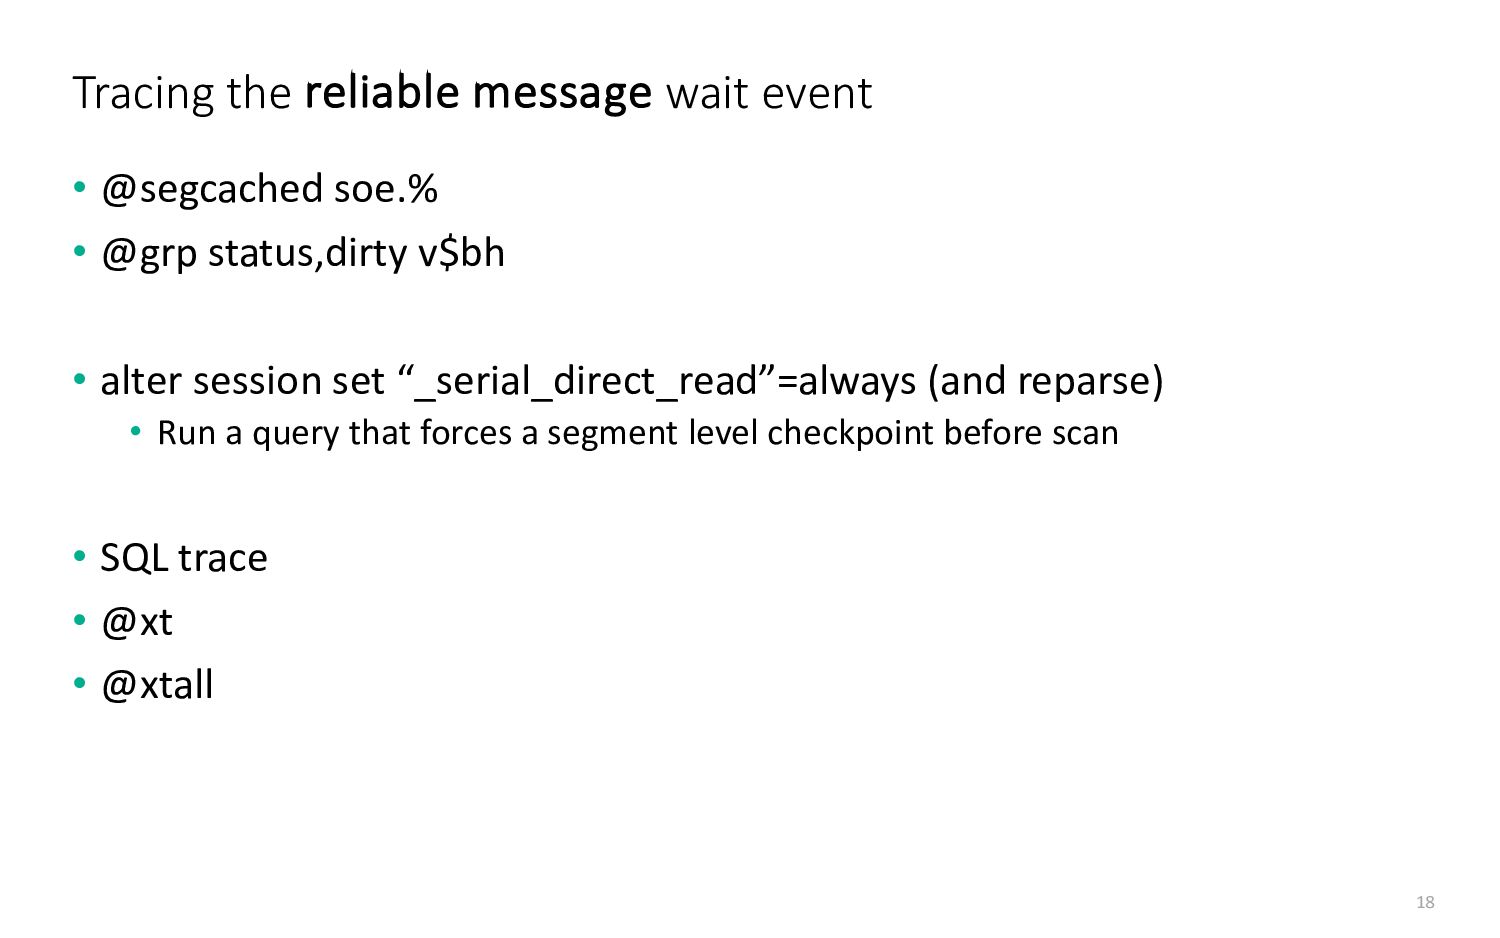
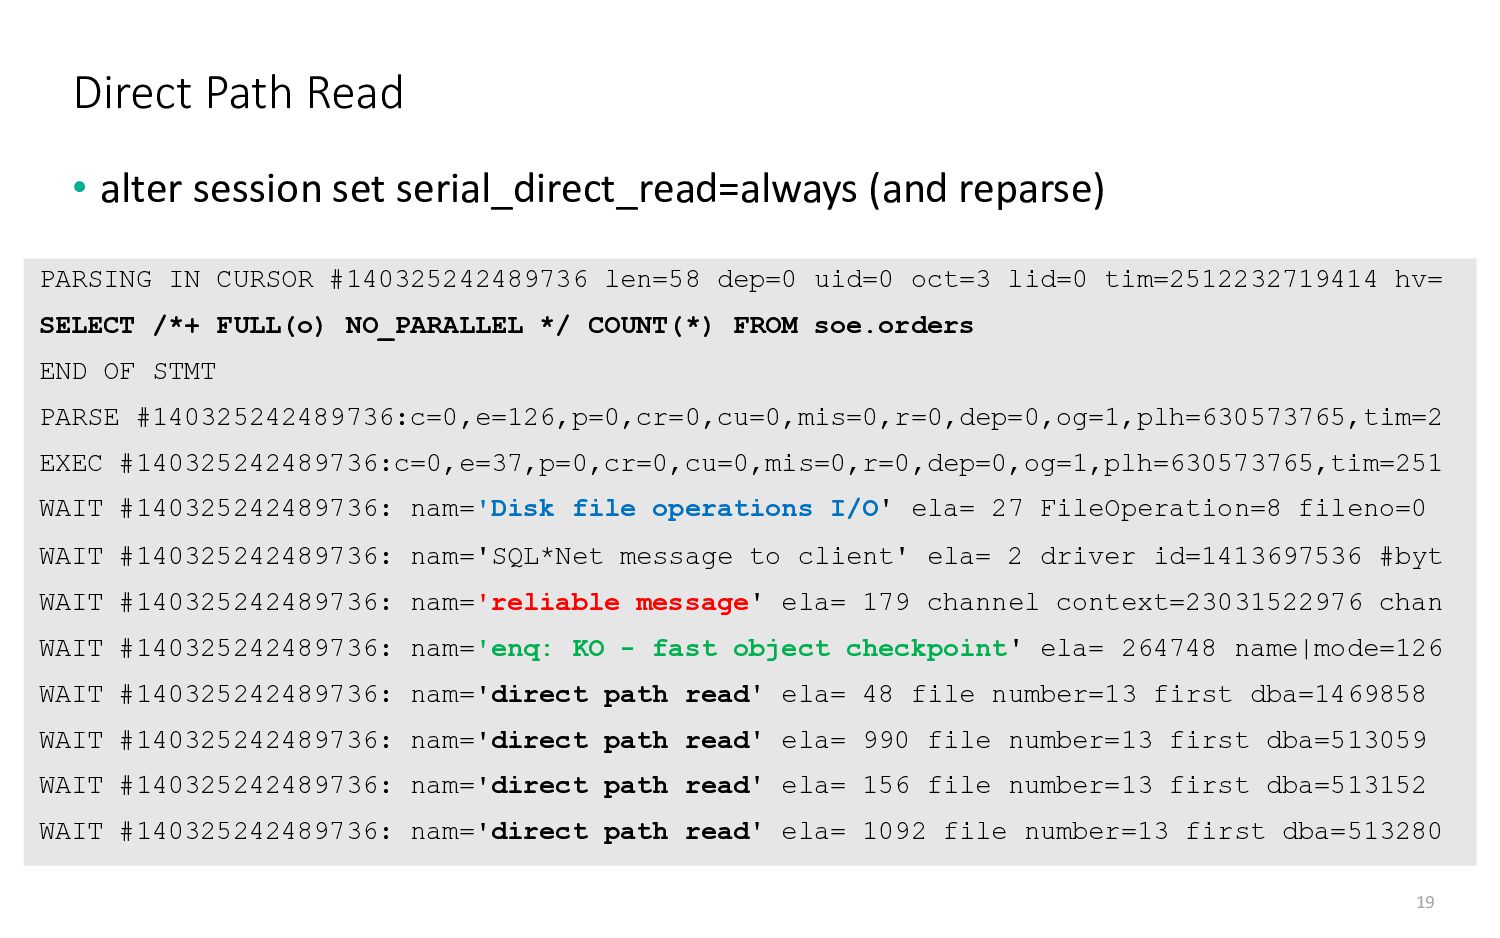
    session set “_serial_direct_read”=always (and reparse) • Run a query that forces a segment level checkpoint before scan • SQL trace • @xt • @xtall Tracing the reliable message wait event
  12. 19 PARSING IN CURSOR #140325242489736 len=58 dep=0 uid=0 oct=3 lid=0

    tim=2512232719414 hv= SELECT /*+ FULL(o) NO_PARALLEL */ COUNT(*) FROM soe.orders END OF STMT PARSE #140325242489736:c=0,e=126,p=0,cr=0,cu=0,mis=0,r=0,dep=0,og=1,plh=630573765,tim=2 EXEC #140325242489736:c=0,e=37,p=0,cr=0,cu=0,mis=0,r=0,dep=0,og=1,plh=630573765,tim=251 WAIT #140325242489736: nam='Disk file operations I/O' ela= 27 FileOperation=8 fileno=0 WAIT #140325242489736: nam='SQL*Net message to client' ela= 2 driver id=1413697536 #byt WAIT #140325242489736: nam='reliable message' ela= 179 channel context=23031522976 chan WAIT #140325242489736: nam='enq: KO - fast object checkpoint' ela= 264748 name|mode=126 WAIT #140325242489736: nam='direct path read' ela= 48 file number=13 first dba=1469858 WAIT #140325242489736: nam='direct path read' ela= 990 file number=13 first dba=513059 WAIT #140325242489736: nam='direct path read' ela= 156 file number=13 first dba=513152 WAIT #140325242489736: nam='direct path read' ela= 1092 file number=13 first dba=513280 Direct Path Read • alter session set serial_direct_read=always (and reparse)
  13. 20 • The video recording is available at: • https://tanelpoder.com/videos/

    • Advanced Oracle Troubleshooting Training: • https://learn.tanelpoder.com/ • Follow @tanelpoder: • https://twitter.com/tanelpoder Thanks! Hopefully this was fun!