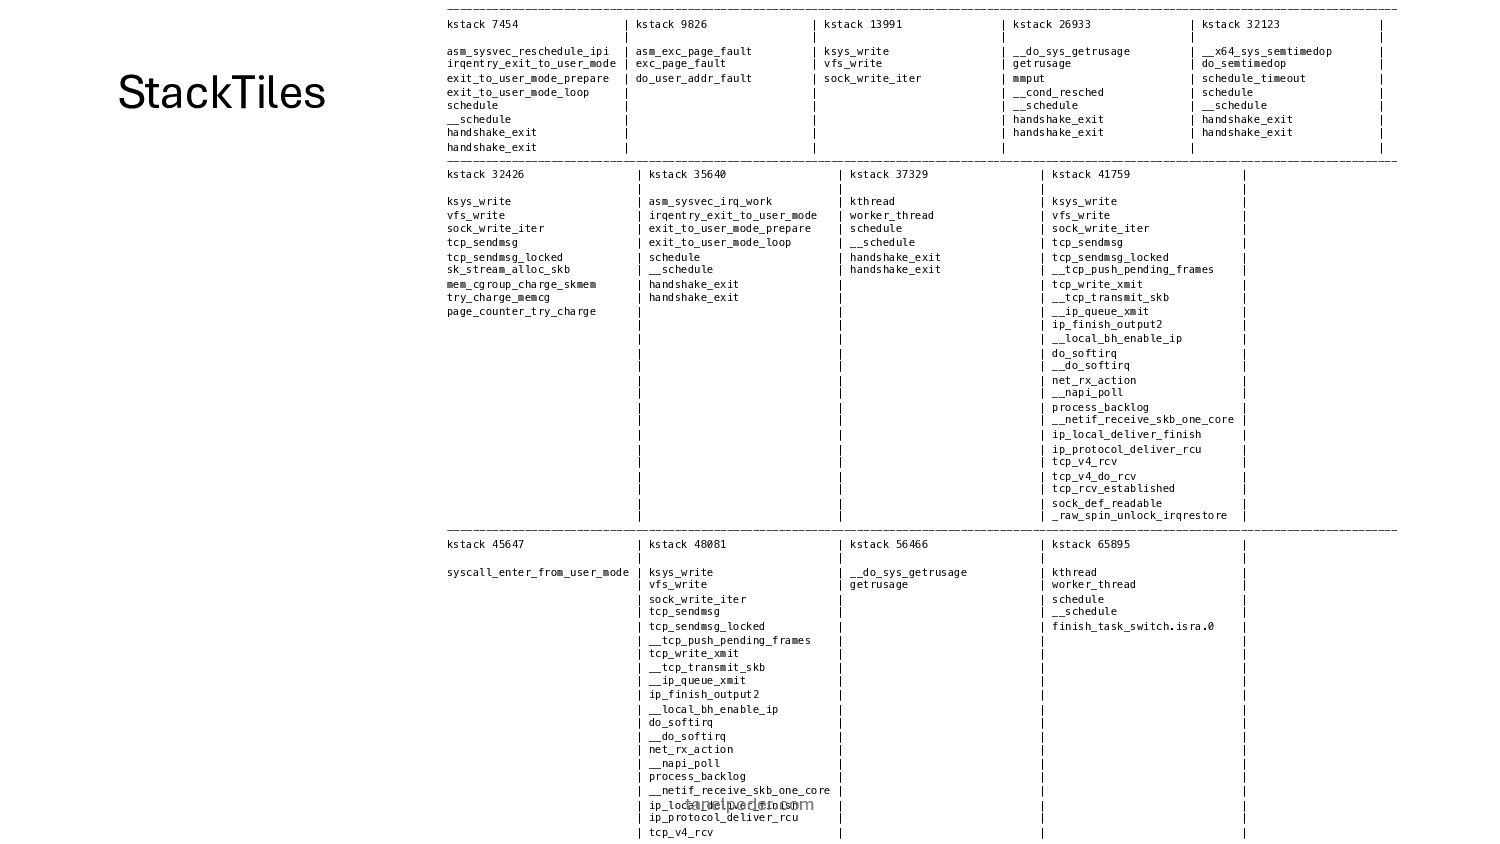
a terminal screen • Structured • Readable • Navigable (search & lookup) • Not fancy, but practical • ... for people who work on command line tanelpoder.com
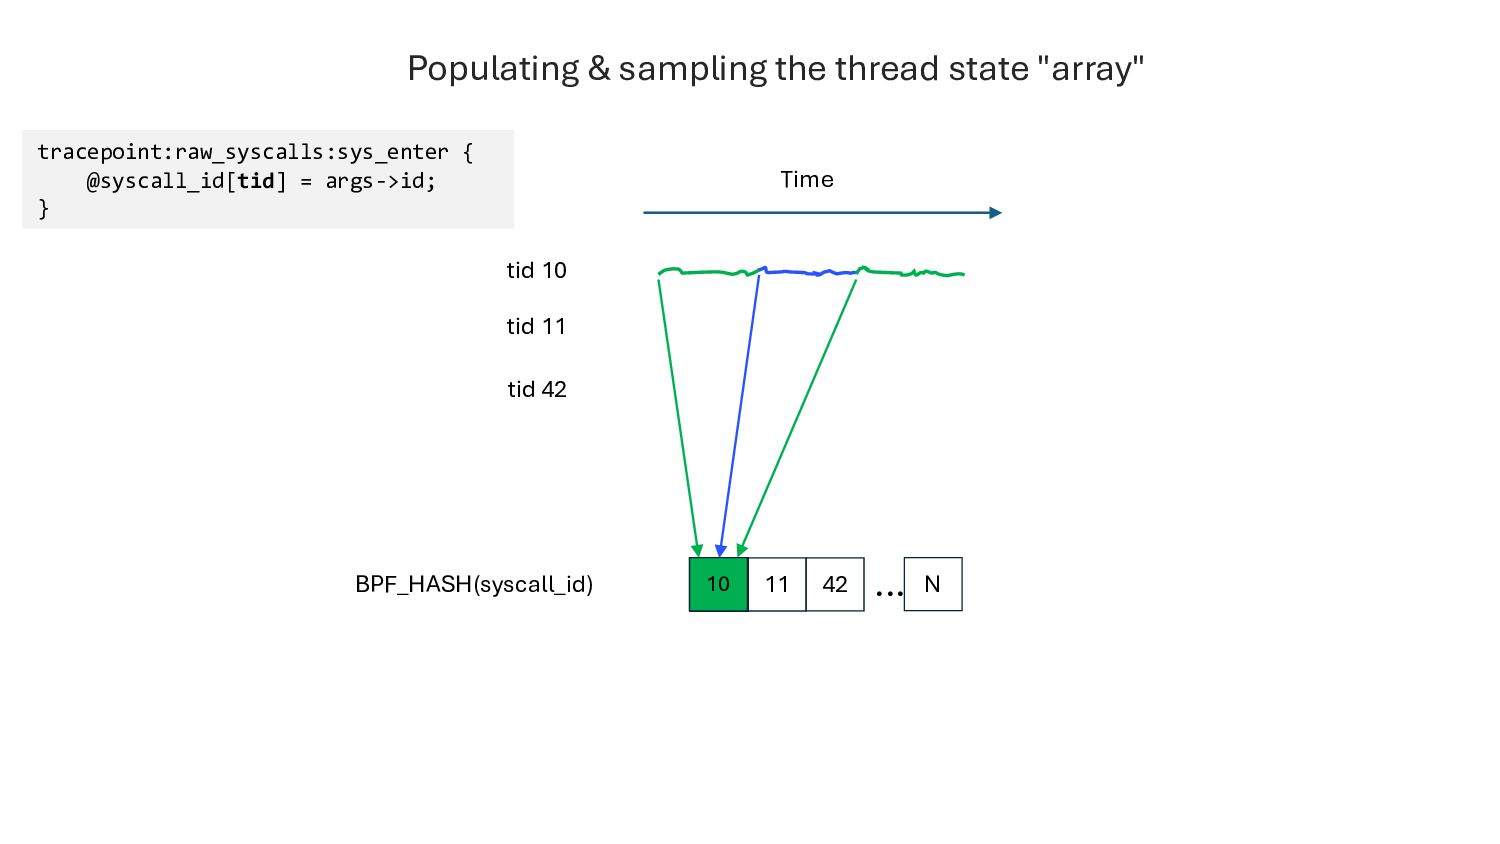
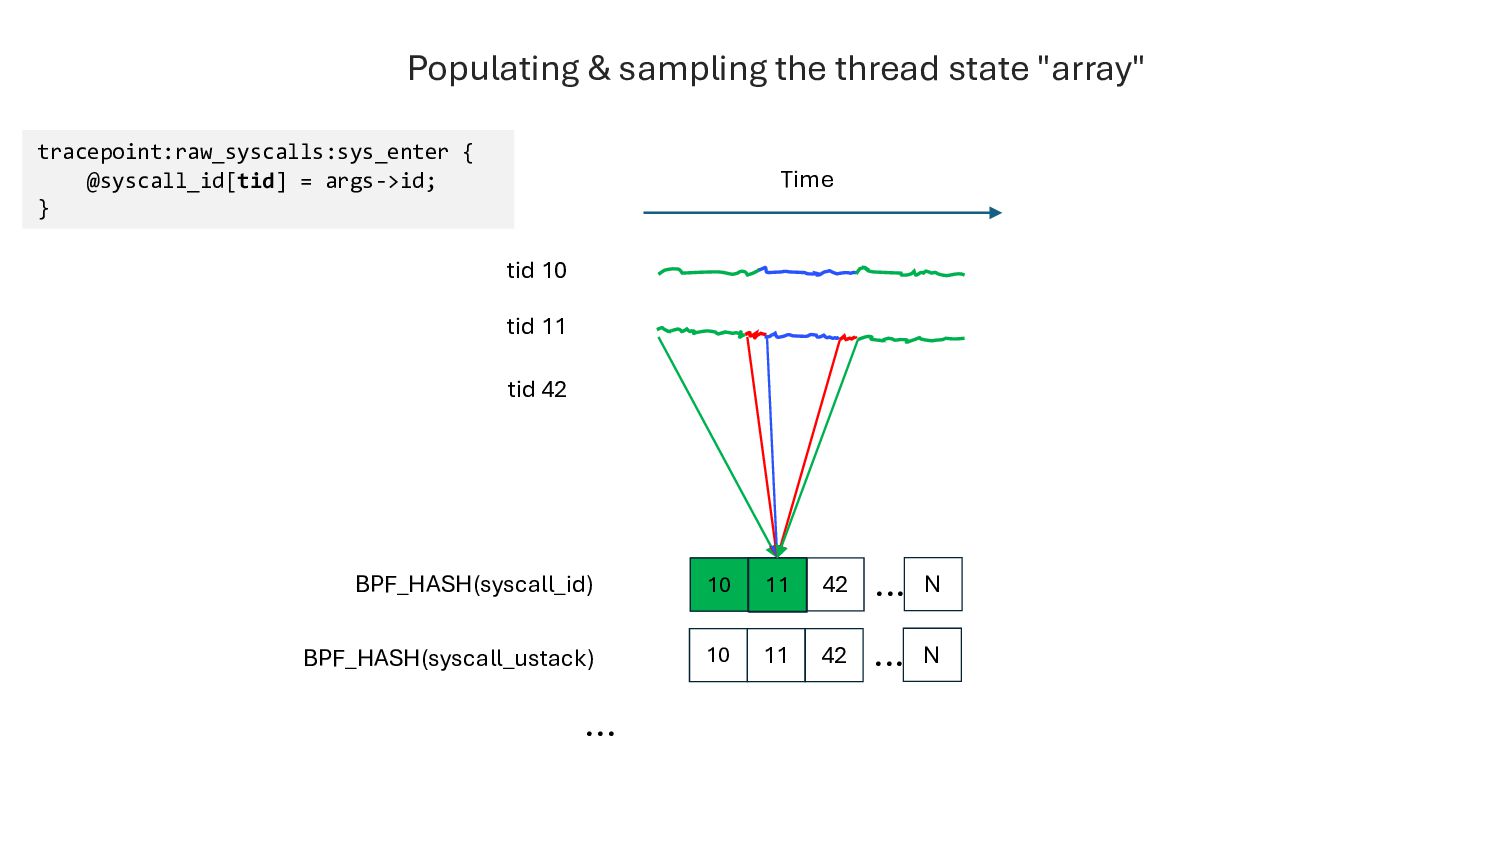
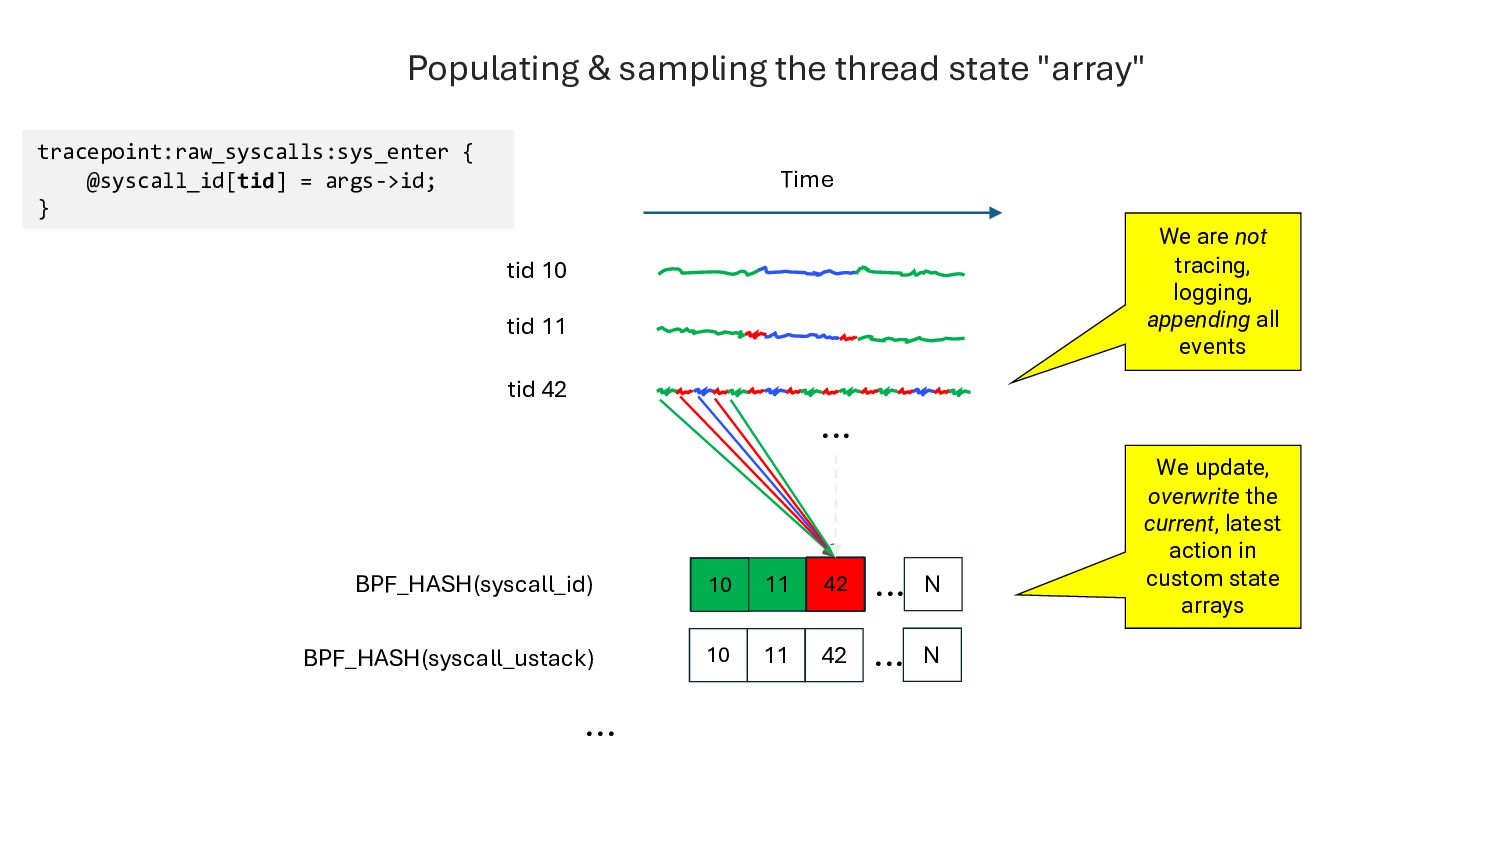
N ... BPF_HASH(syscall_id) 10 42 42 42 42 42 BPF_HASH(syscall_ustack) 10 11 42 N ... ... tracepoint:raw_syscalls:sys_enter { @syscall_id[tid] = args->id; } 42 42 42 42 42 42 We are not tracing, logging, appending all events We update, overwrite the current, latest action in custom state arrays ... Populating & sampling the thread state "array"
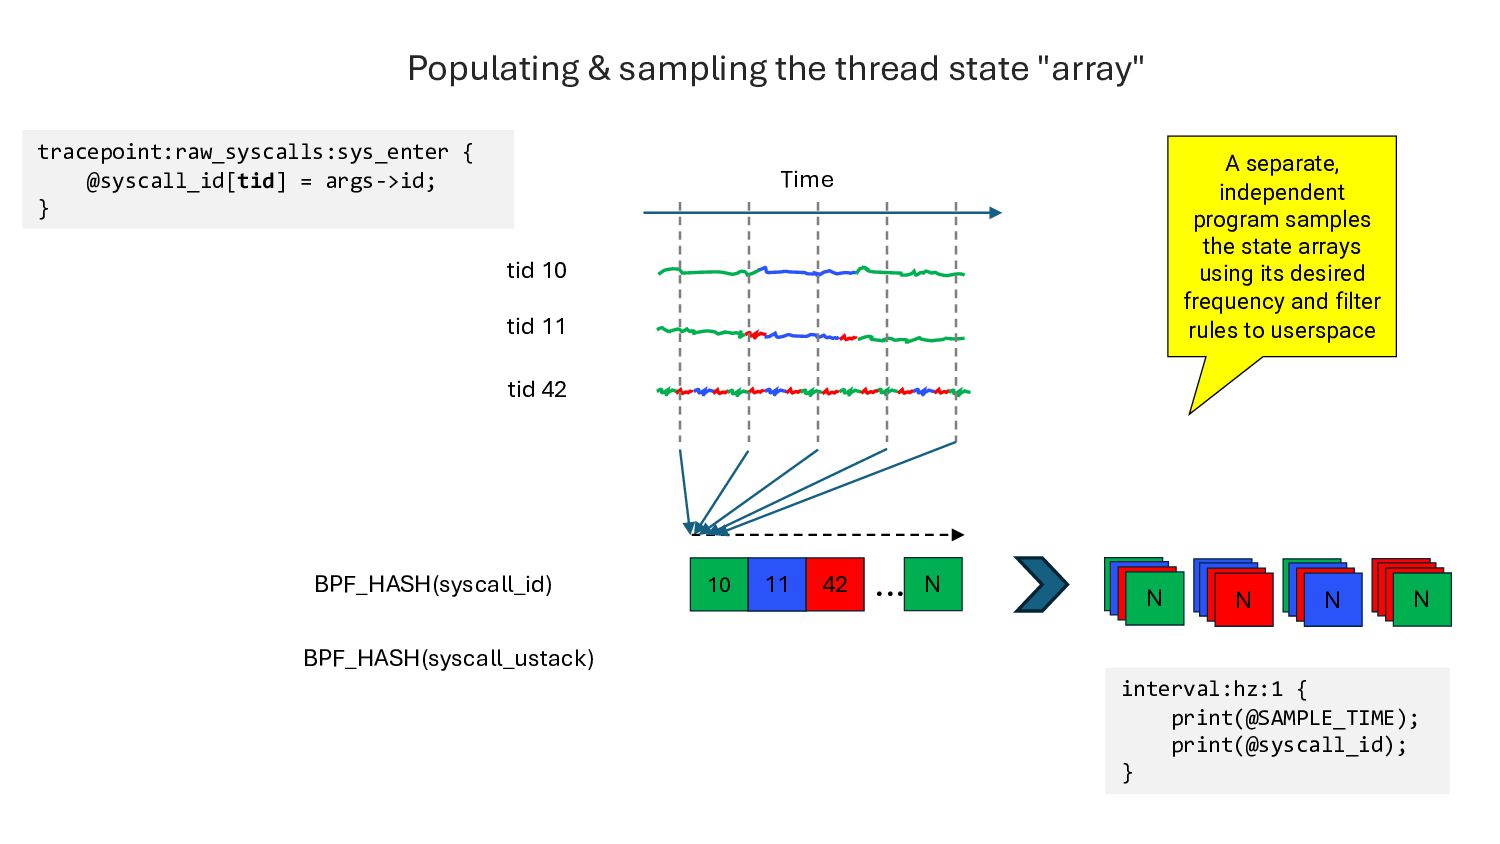
N ... BPF_HASH(syscall_id) tracepoint:raw_syscalls:sys_enter { @syscall_id[tid] = args->id; } A separate, independent program samples the state arrays using its desired frequency and filter rules to userspace BPF_HASH(syscall_ustack) interval:hz:1 { print(@SAMPLE_TIME); print(@syscall_id); } 10 11 42 N 10 11 42 N 10 11 42 N 10 11 42 N Populating & sampling the thread state "array"
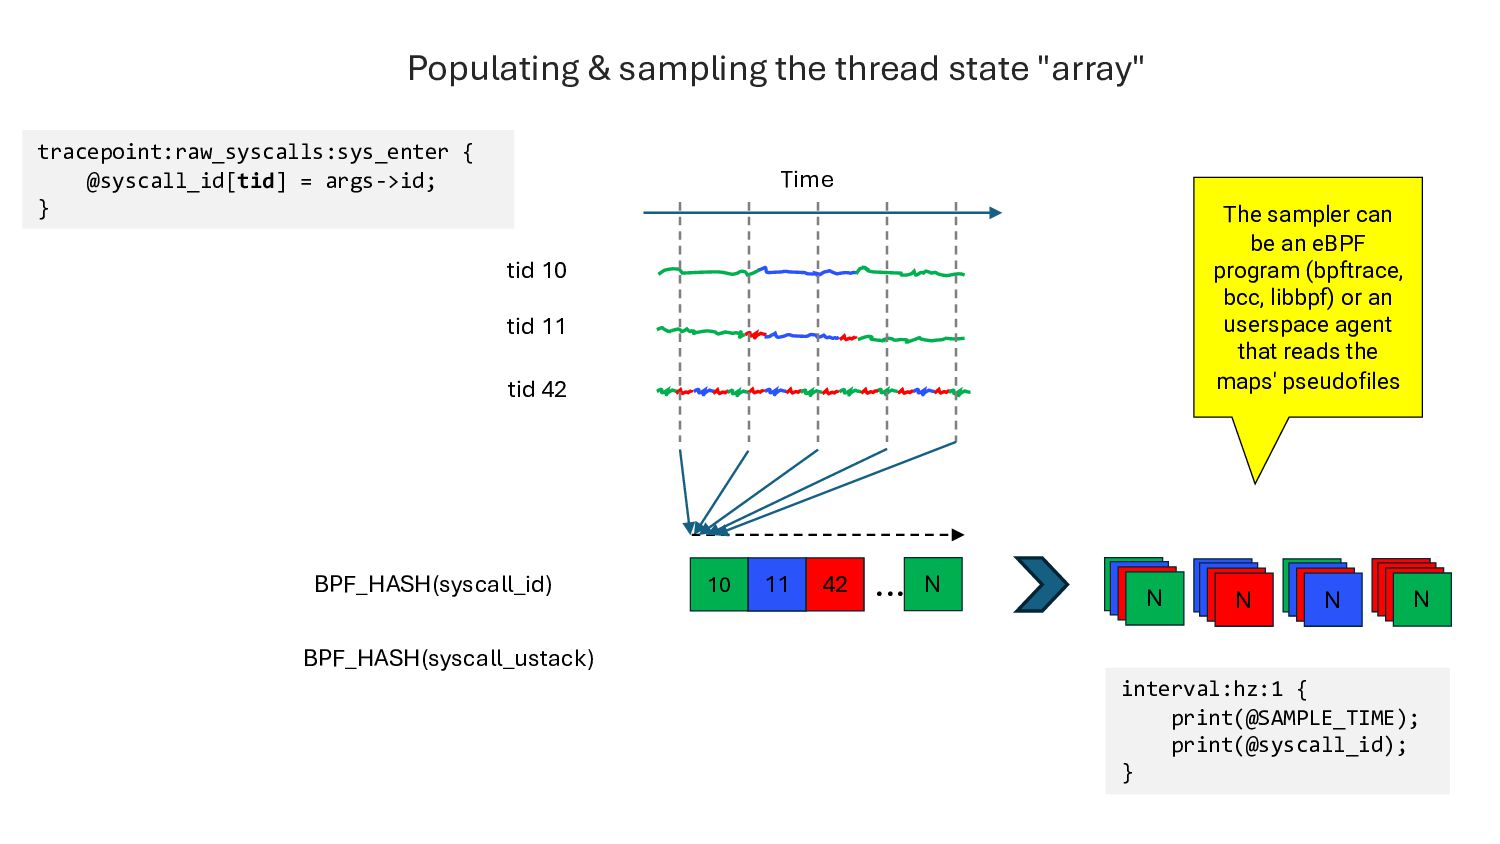
N ... BPF_HASH(syscall_id) tracepoint:raw_syscalls:sys_enter { @syscall_id[tid] = args->id; } BPF_HASH(syscall_ustack) interval:hz:1 { print(@SAMPLE_TIME); print(@syscall_id); } 10 11 42 N 10 11 42 N 10 11 42 N 10 11 42 N The sampler can be an eBPF program (bpftrace, bcc, libbpf) or an userspace agent that reads the maps' pseudofiles Populating & sampling the thread state "array"
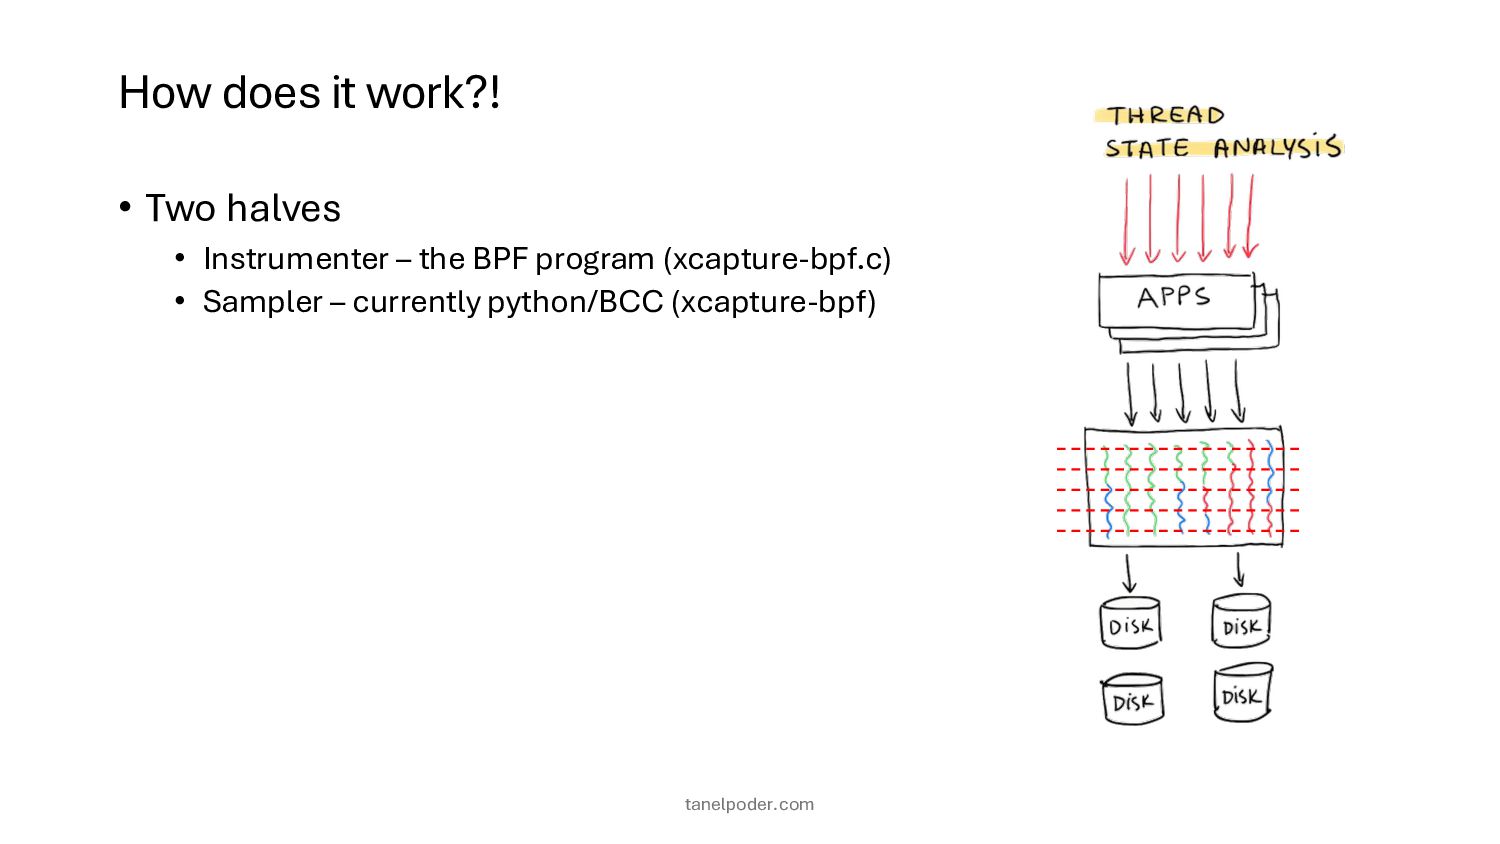
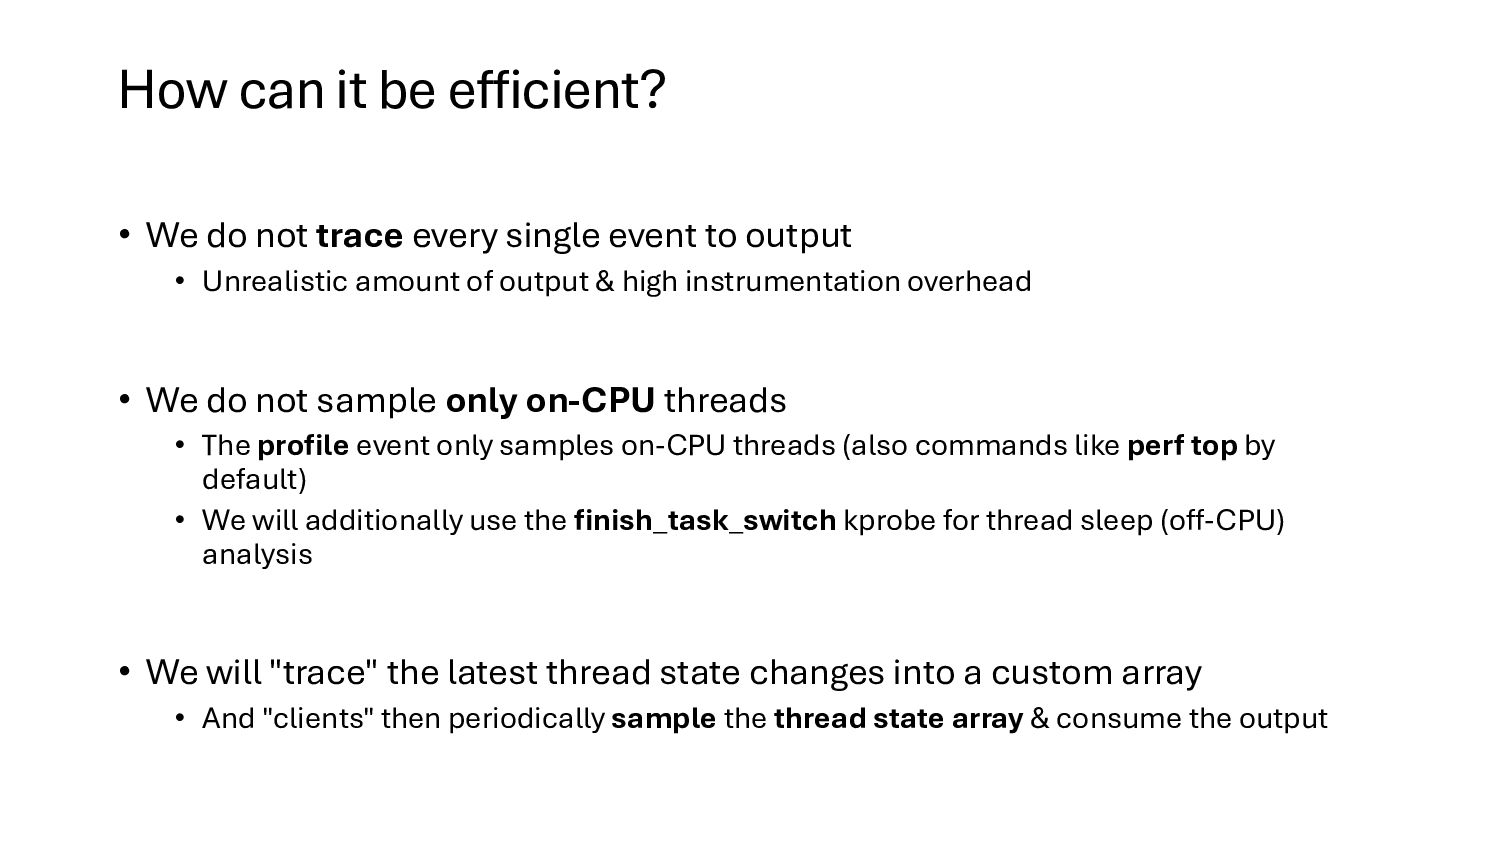
every single event to output • Unrealistic amount of output & high instrumentation overhead • We do not sample only on-CPU threads • The profile event only samples on-CPU threads (also commands like perf top by default) • We will additionally use the finish_task_switch kprobe for thread sleep (off-CPU) analysis • We will "trace" the latest thread state changes into a custom array • And "clients" then periodically sample the thread state array & consume the output
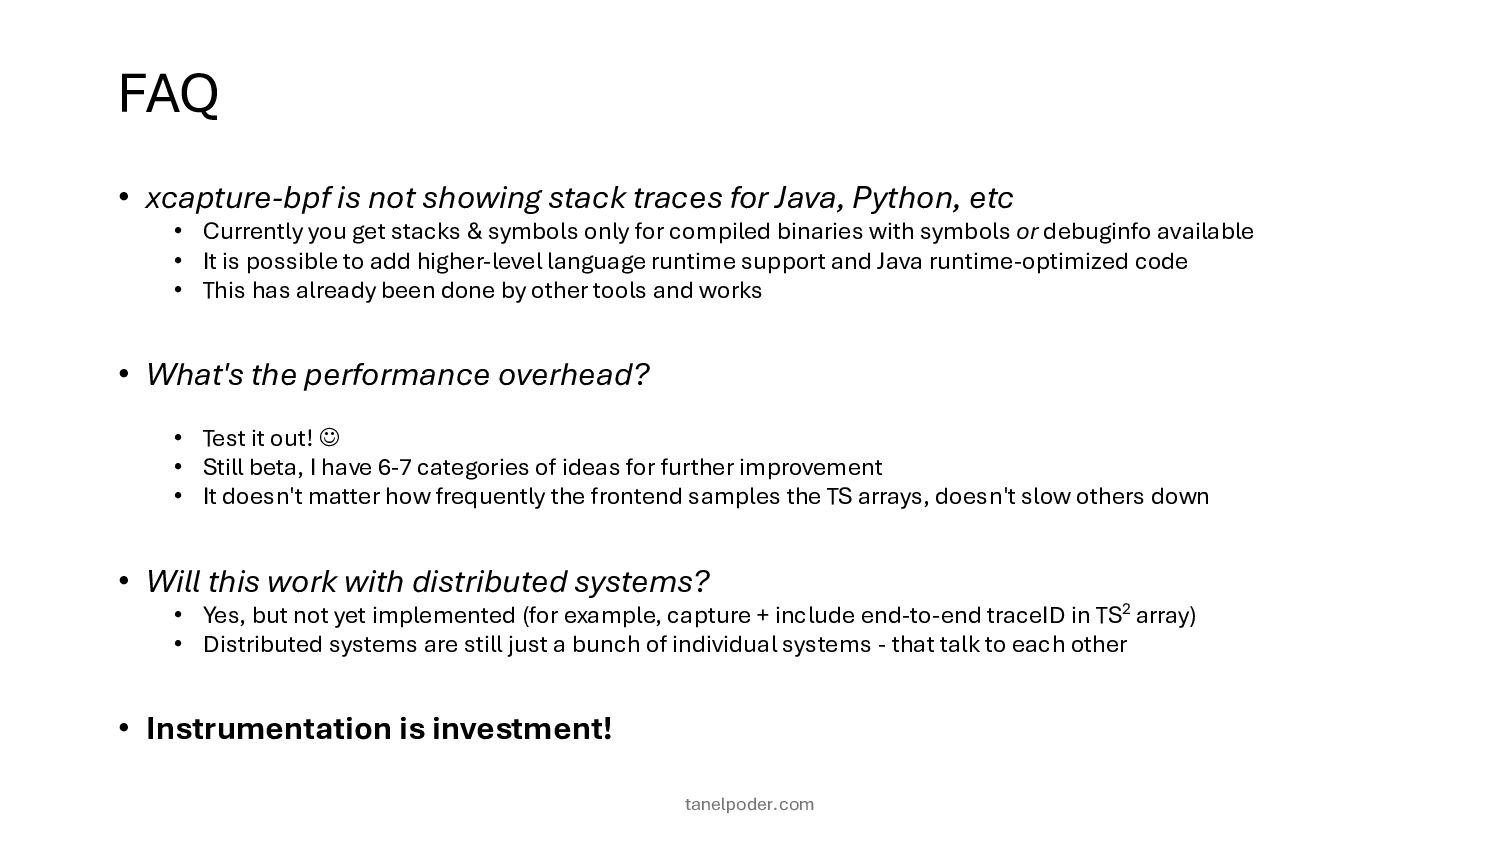
Python, etc • Currently you get stacks & symbols only for compiled binaries with symbols or debuginfo available • It is possible to add higher-level language runtime support and Java runtime-optimized code • This has already been done by other tools and works • What's the performance overhead? • Test it out! J • Still beta, I have 6-7 categories of ideas for further improvement • It doesn't matter how frequently the frontend samples the TS arrays, doesn't slow others down • Will this work with distributed systems? • Yes, but not yet implemented (for example, capture + include end-to-end traceID in TS2 array) • Distributed systems are still just a bunch of individual systems - that talk to each other • Instrumentation is investment! tanelpoder.com
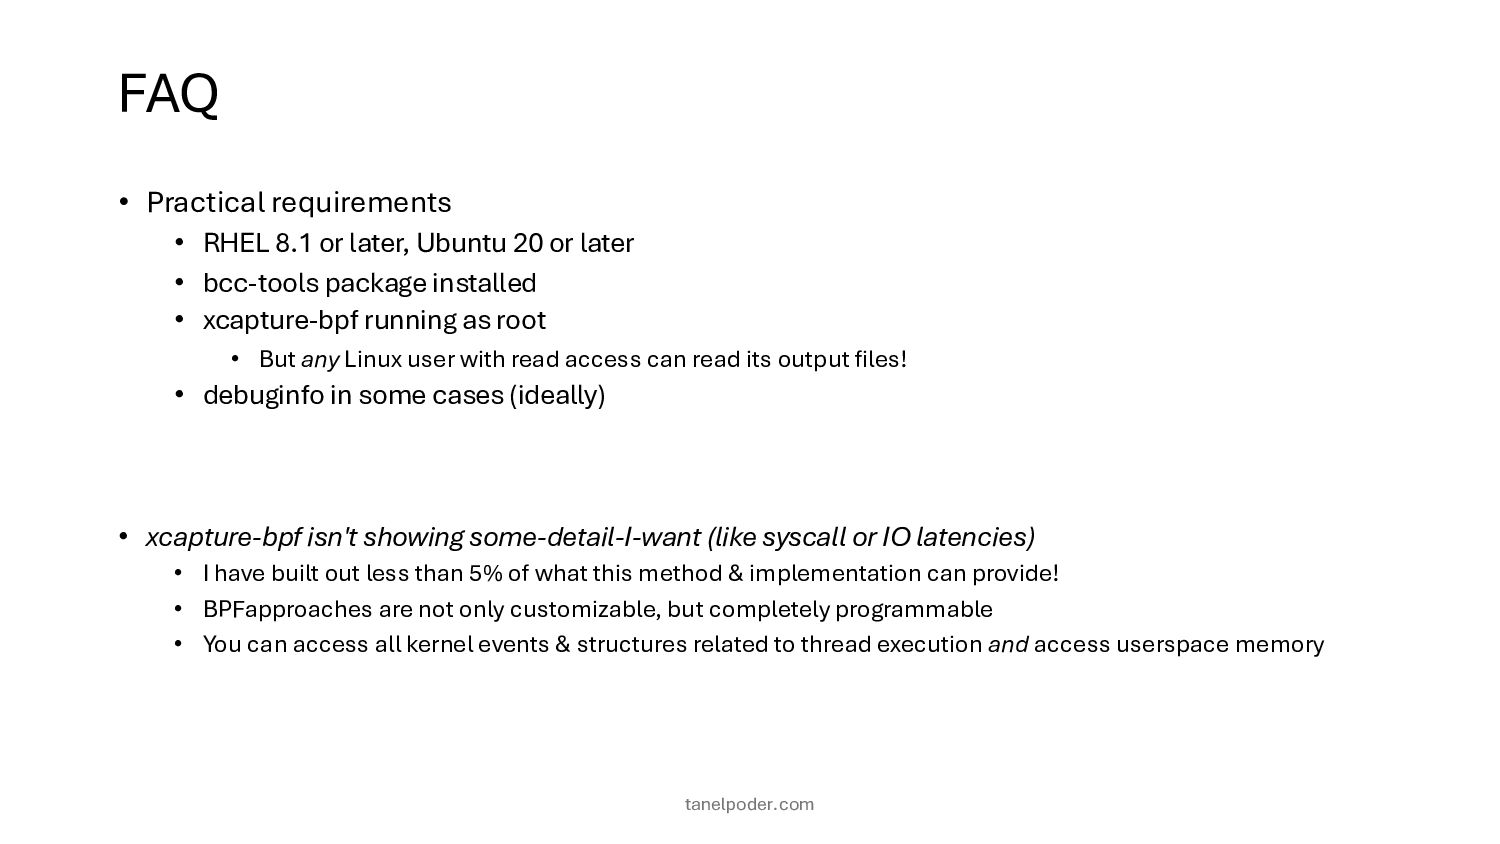
20 or later • bcc-tools package installed • xcapture-bpf running as root • But any Linux user with read access can read its output files! • debuginfo in some cases (ideally) • xcapture-bpf isn't showing some-detail-I-want (like syscall or IO latencies) • I have built out less than 5% of what this method & implementation can provide! • BPFapproaches are not only customizable, but completely programmable • You can access all kernel events & structures related to thread execution and access userspace memory tanelpoder.com
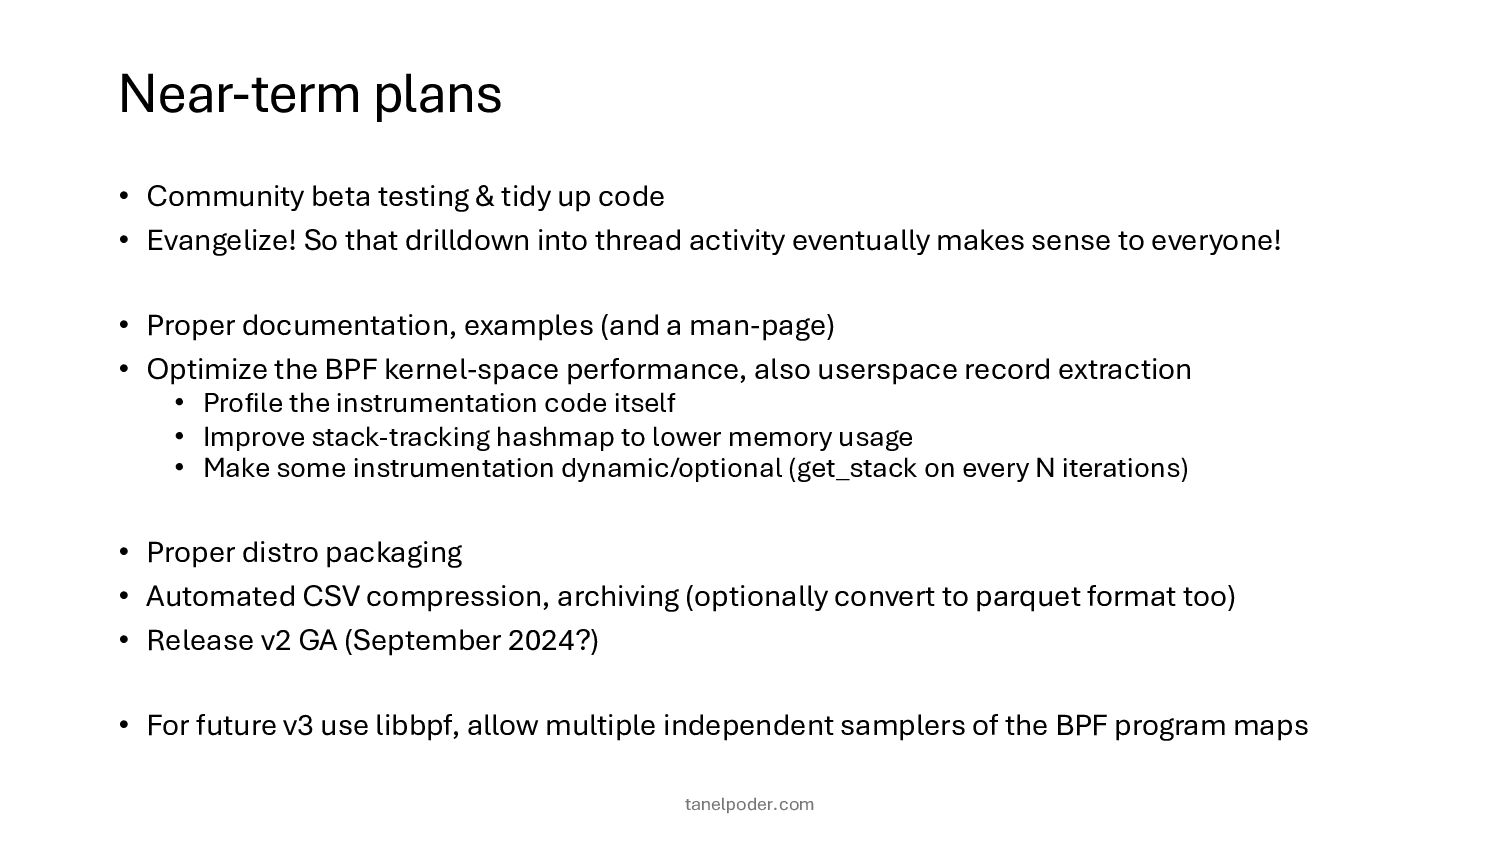
• Evangelize! So that drilldown into thread activity eventually makes sense to everyone! • Proper documentation, examples (and a man-page) • Optimize the BPF kernel-space performance, also userspace record extraction • Profile the instrumentation code itself • Improve stack-tracking hashmap to lower memory usage • Make some instrumentation dynamic/optional (get_stack on every N iterations) • Proper distro packaging • Automated CSV compression, archiving (optionally convert to parquet format too) • Release v2 GA (September 2024?) • For future v3 use libbpf, allow multiple independent samplers of the BPF program maps tanelpoder.com