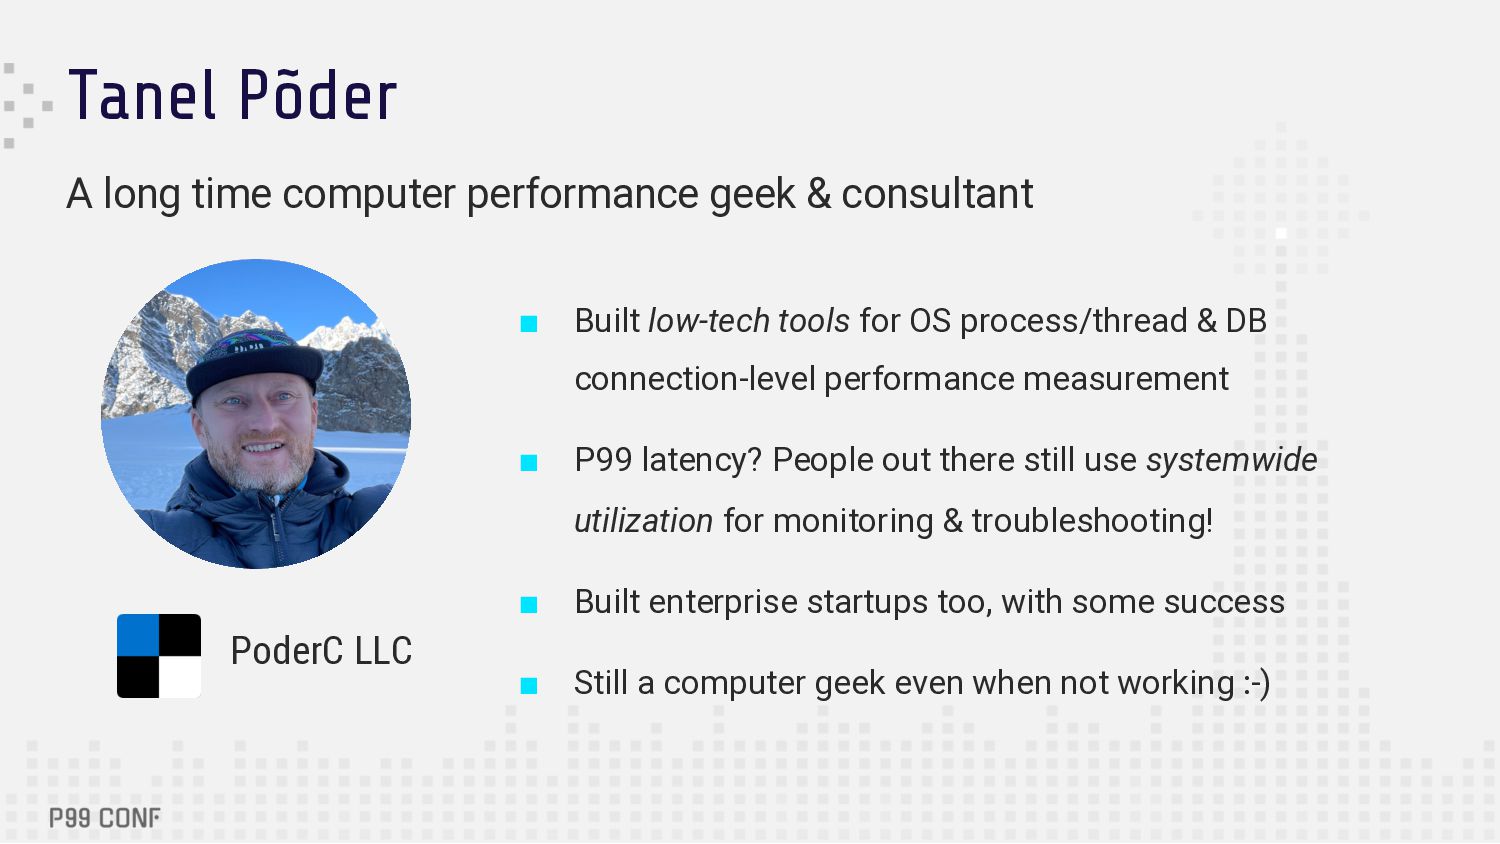
▪ Built low-tech tools for OS process/thread & DB connection-level performance measurement ▪ P99 latency? People out there still use systemwide utilization for monitoring & troubleshooting! ▪ Built enterprise startups too, with some success ▪ Still a computer geek even when not working :-) PoderC LLC
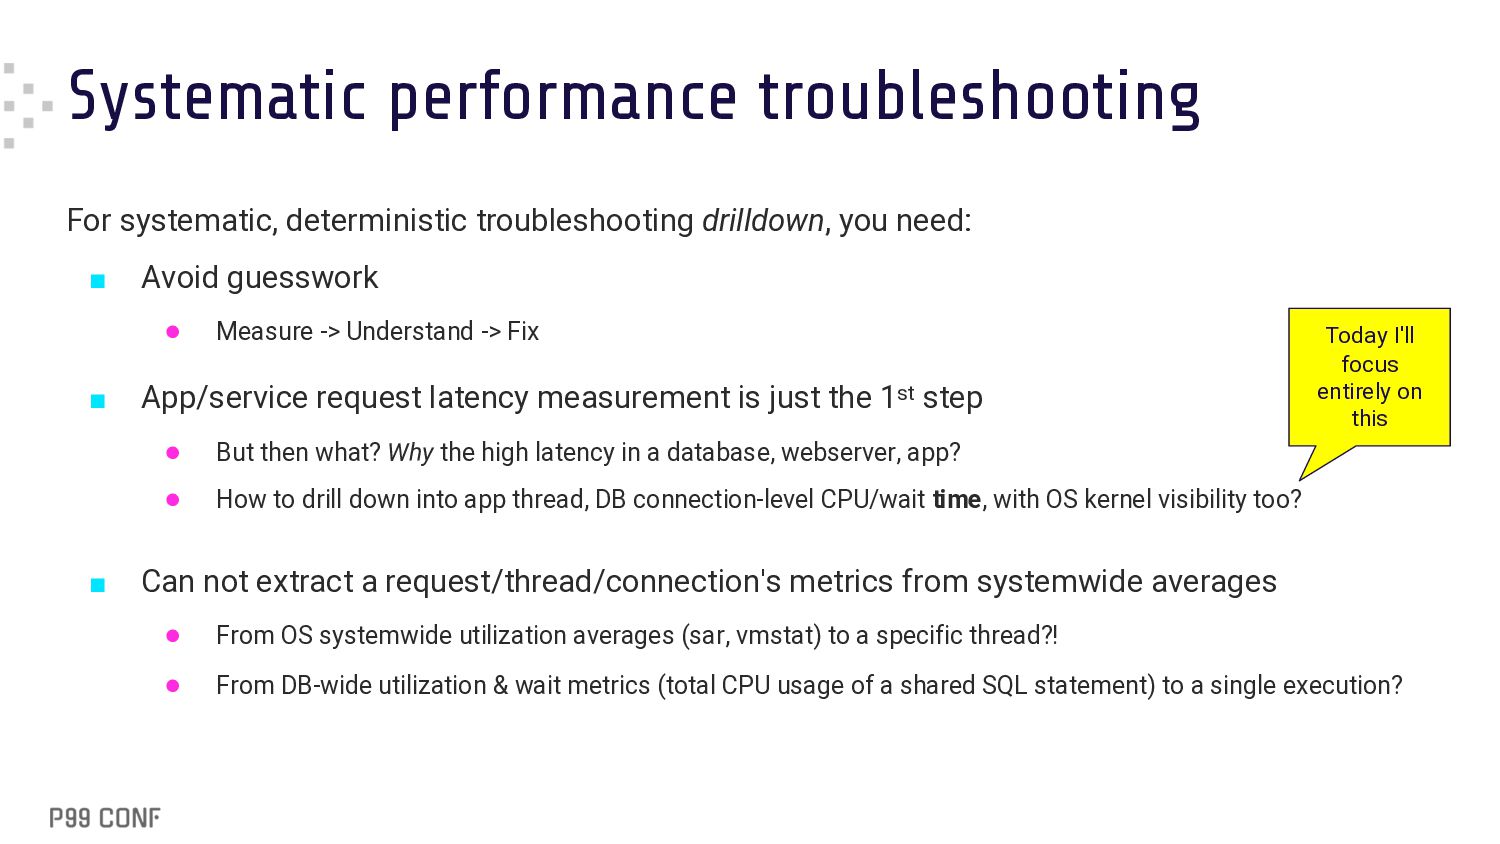
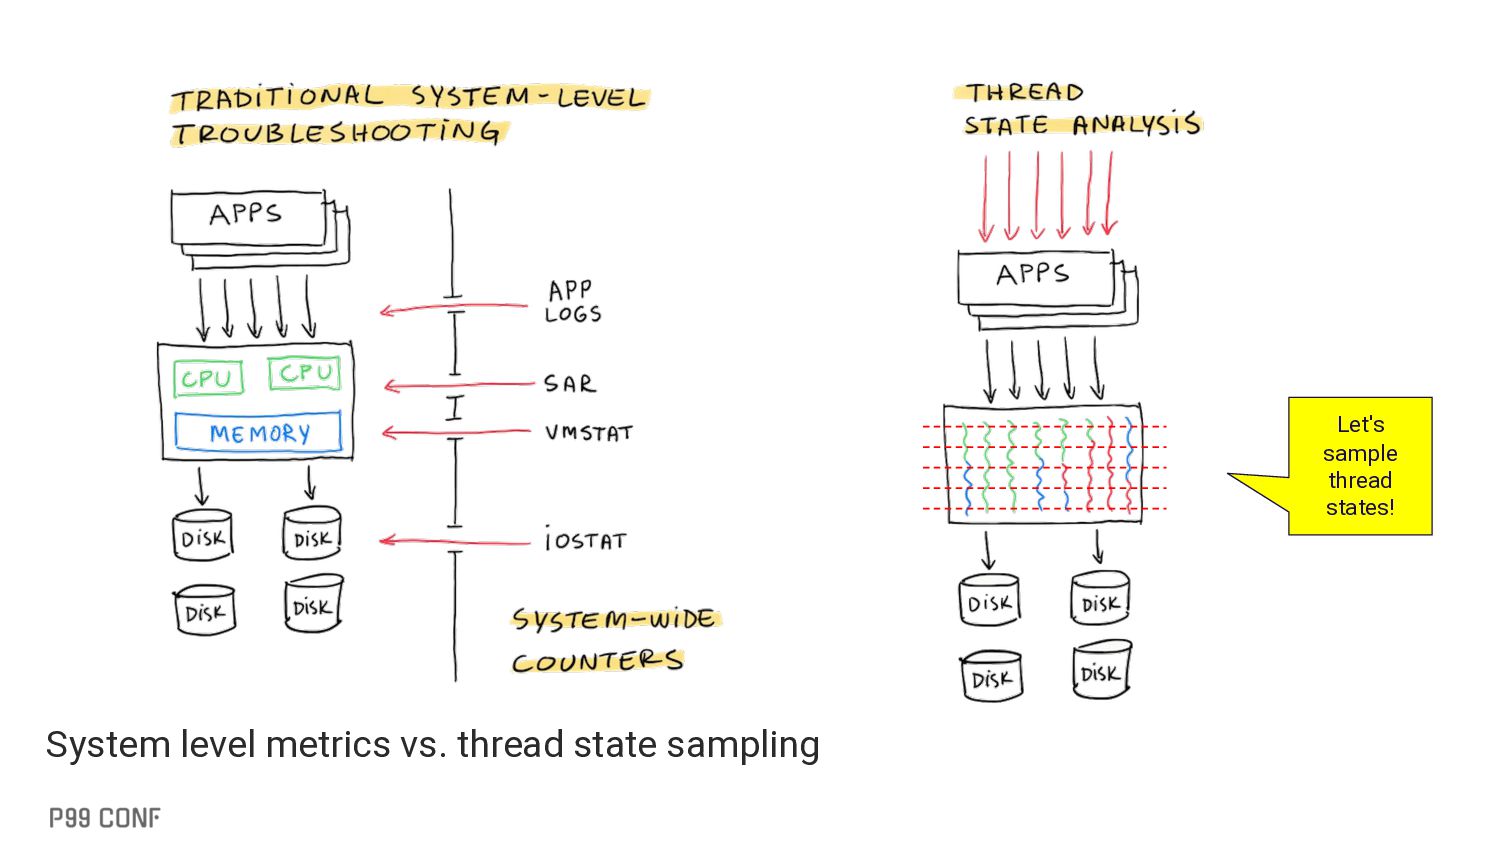
▪ Avoid guesswork • Measure -> Understand -> Fix ▪ App/service request latency measurement is just the 1st step • But then what? Why the high latency in a database, webserver, app? • How to drill down into app thread, DB connection-level CPU/wait time, with OS kernel visibility too? ▪ Can not extract a request/thread/connection's metrics from systemwide averages • From OS systemwide utilization averages (sar, vmstat) to a specific thread?! • From DB-wide utilization & wait metrics (total CPU usage of a shared SQL statement) to a single execution? Today I'll focus entirely on this
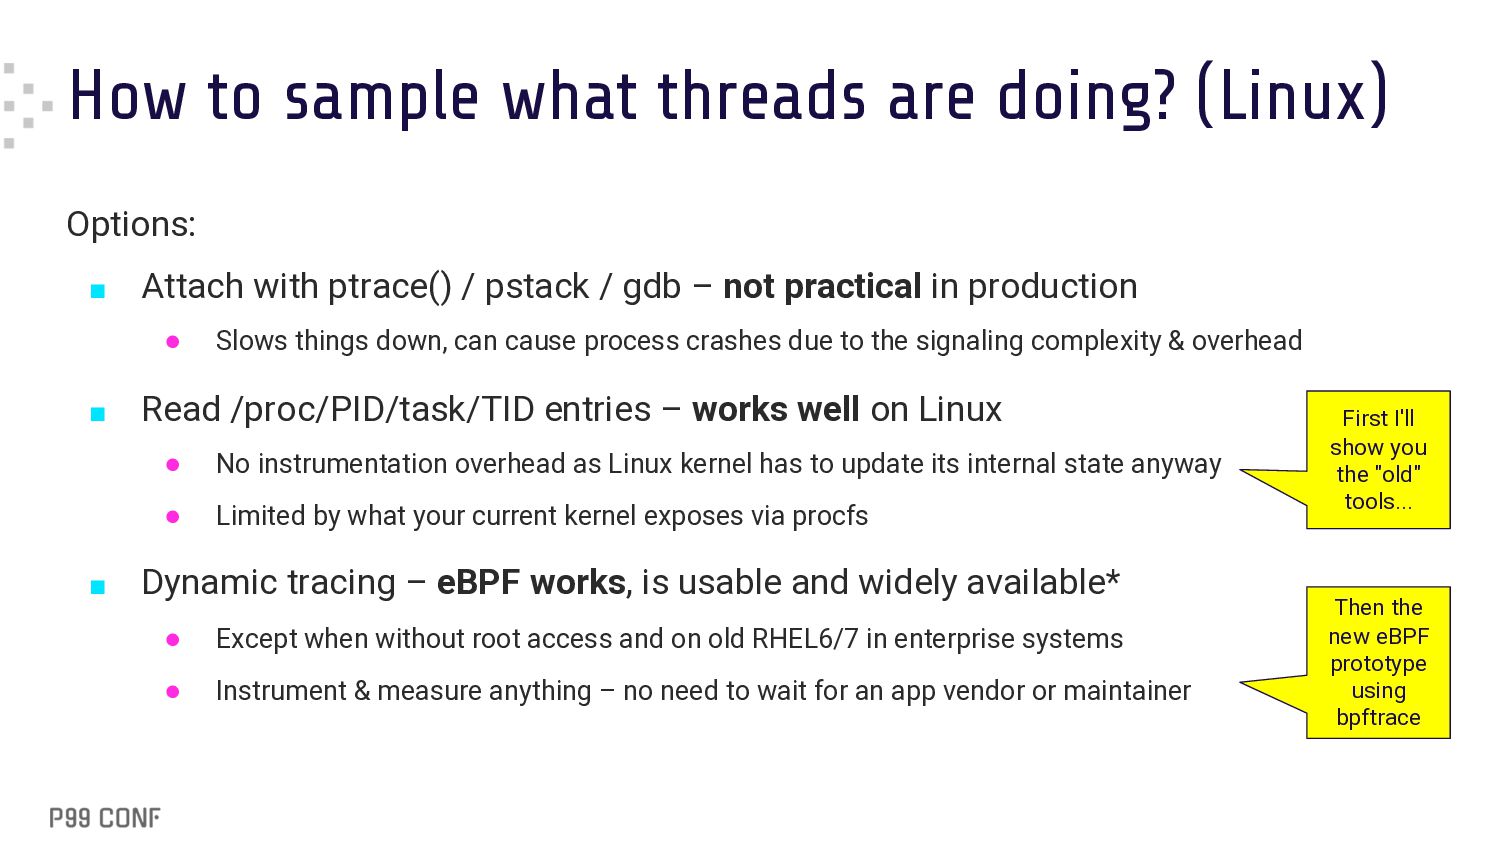
Attach with ptrace() / pstack / gdb – not practical in production • Slows things down, can cause process crashes due to the signaling complexity & overhead ▪ Read /proc/PID/task/TID entries – works well on Linux • No instrumentation overhead as Linux kernel has to update its internal state anyway • Limited by what your current kernel exposes via procfs ▪ Dynamic tracing – eBPF works, is usable and widely available* • Except when without root access and on old RHEL6/7 in enterprise systems • Instrument & measure anything – no need to wait for an app vendor or maintainer First I'll show you the "old" tools... Then the new eBPF prototype using bpftrace
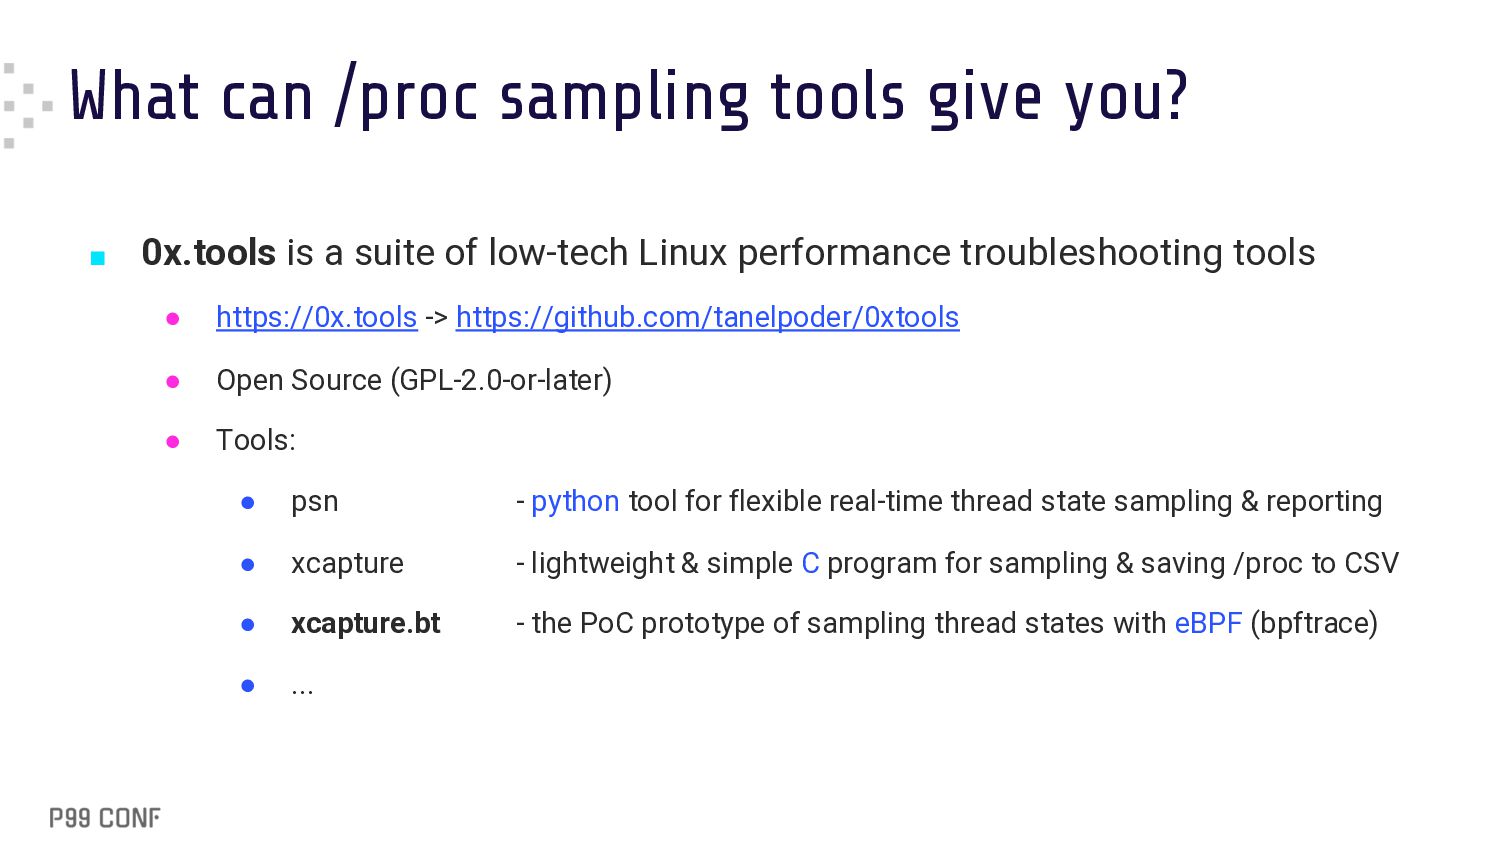
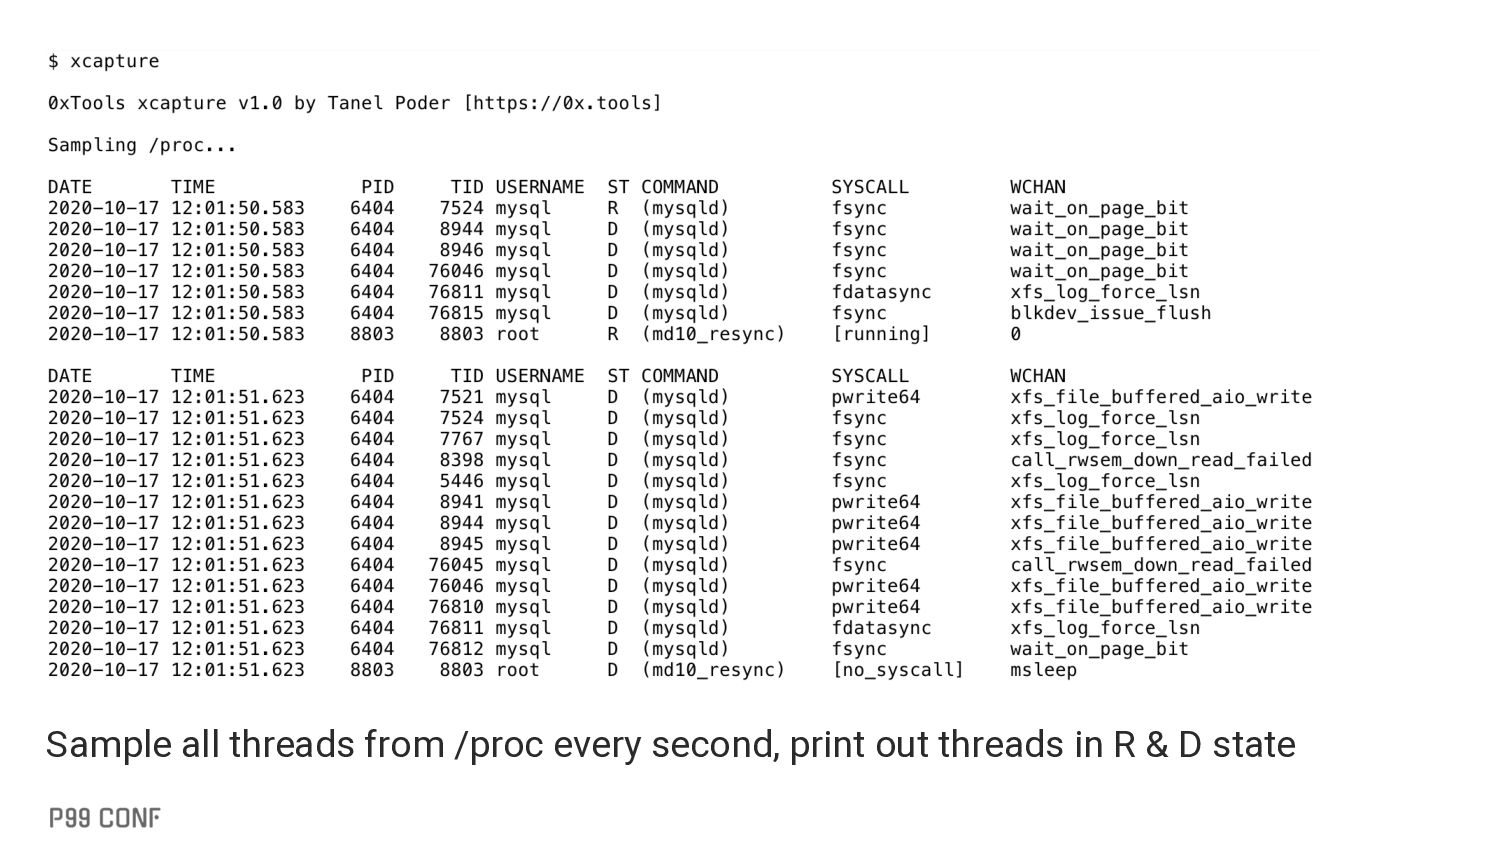
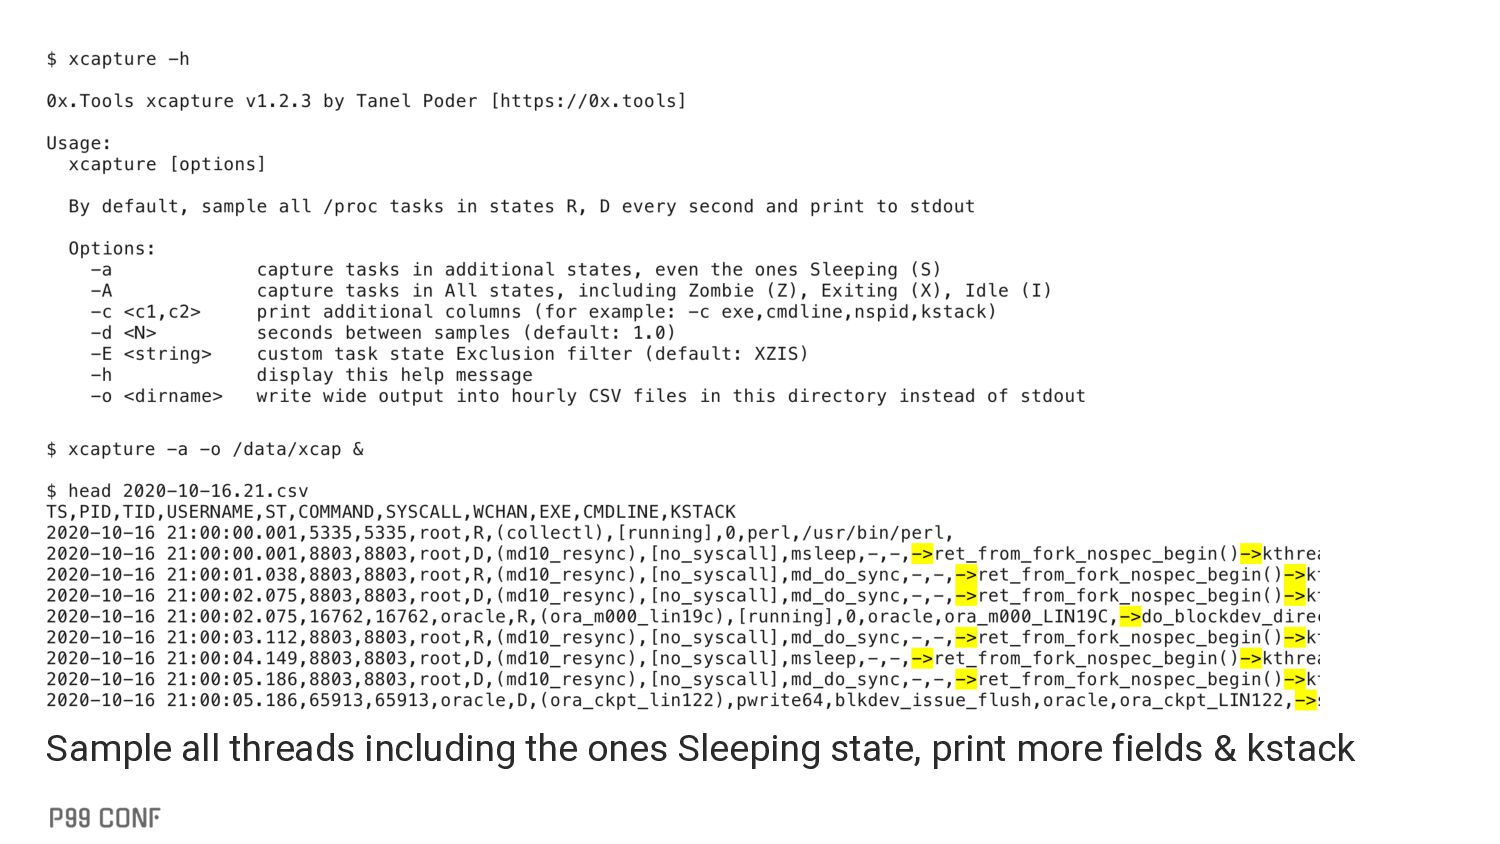
a suite of low-tech Linux performance troubleshooting tools • https://0x.tools -> https://github.com/tanelpoder/0xtools • Open Source (GPL-2.0-or-later) • Tools: • psn - python tool for flexible real-time thread state sampling & reporting • xcapture - lightweight & simple C program for sampling & saving /proc to CSV • xcapture.bt - the PoC prototype of sampling thread states with eBPF (bpftrace) • ...
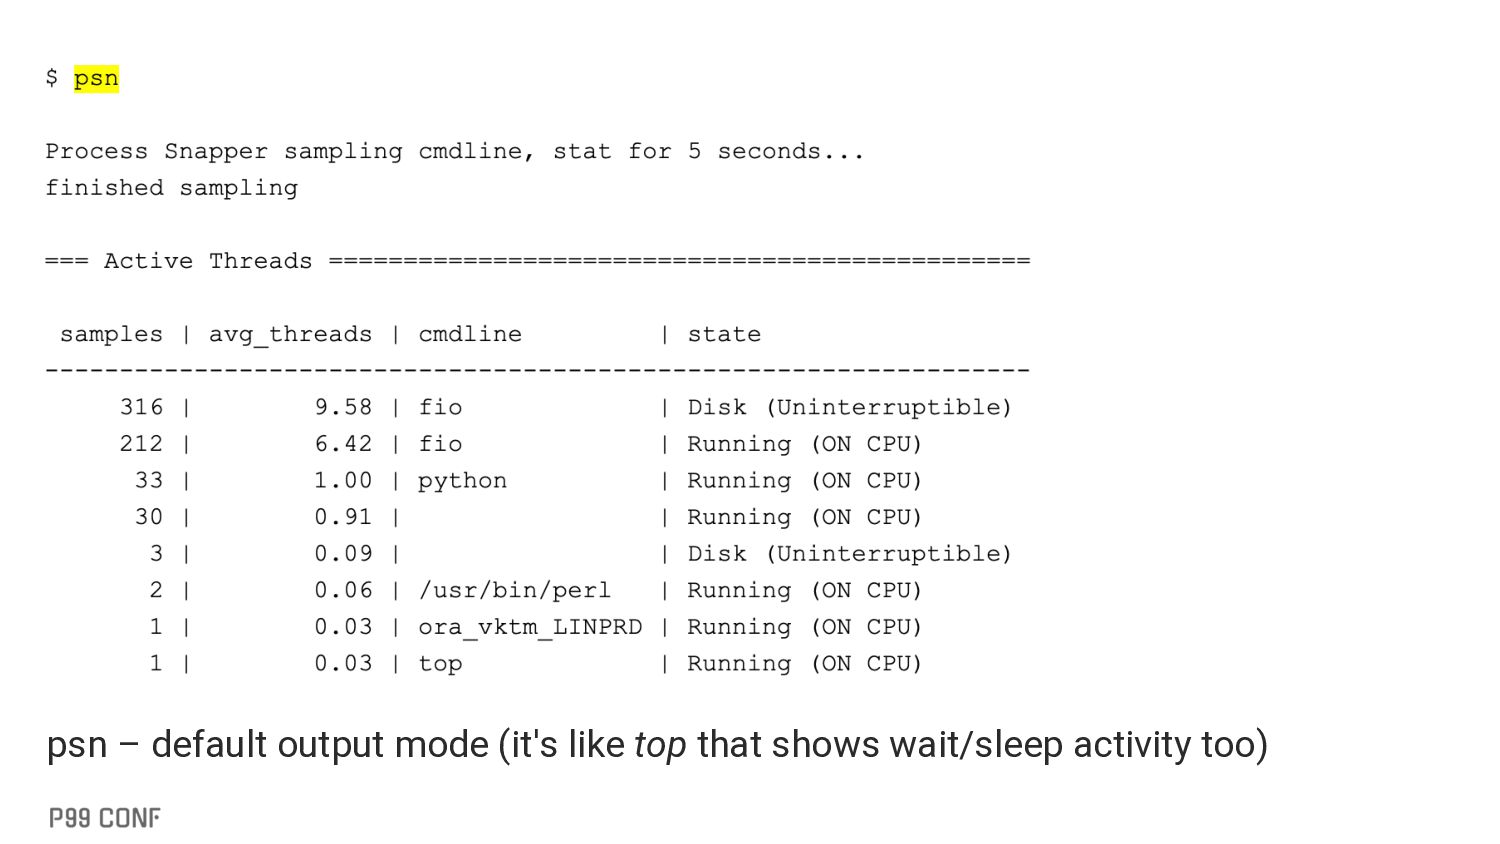
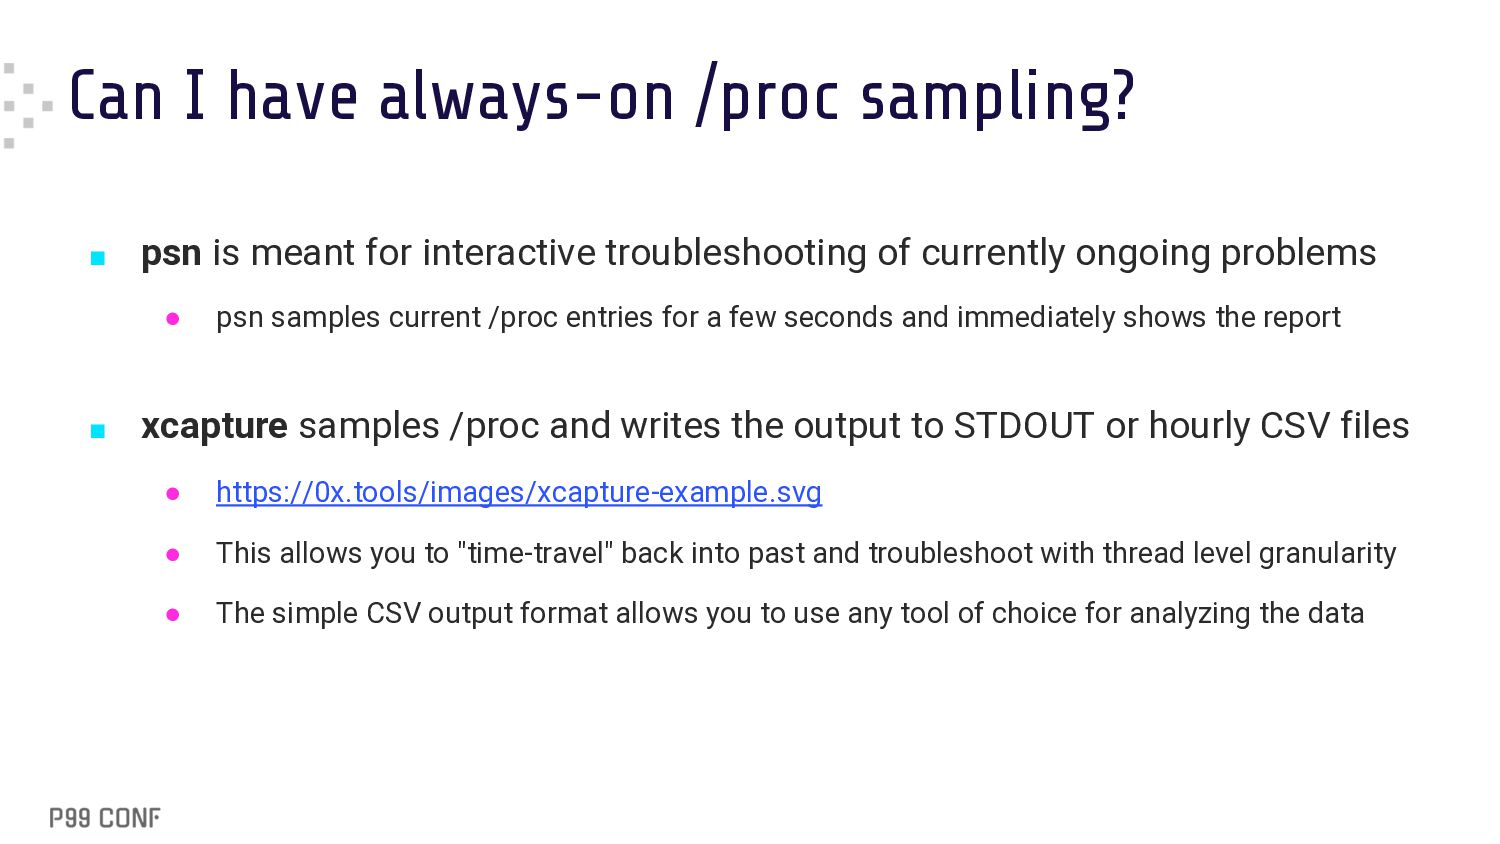
for interactive troubleshooting of currently ongoing problems • psn samples current /proc entries for a few seconds and immediately shows the report ▪ xcapture samples /proc and writes the output to STDOUT or hourly CSV files • https://0x.tools/images/xcapture-example.svg • This allows you to "time-travel" back into past and troubleshoot with thread level granularity • The simple CSV output format allows you to use any tool of choice for analyzing the data
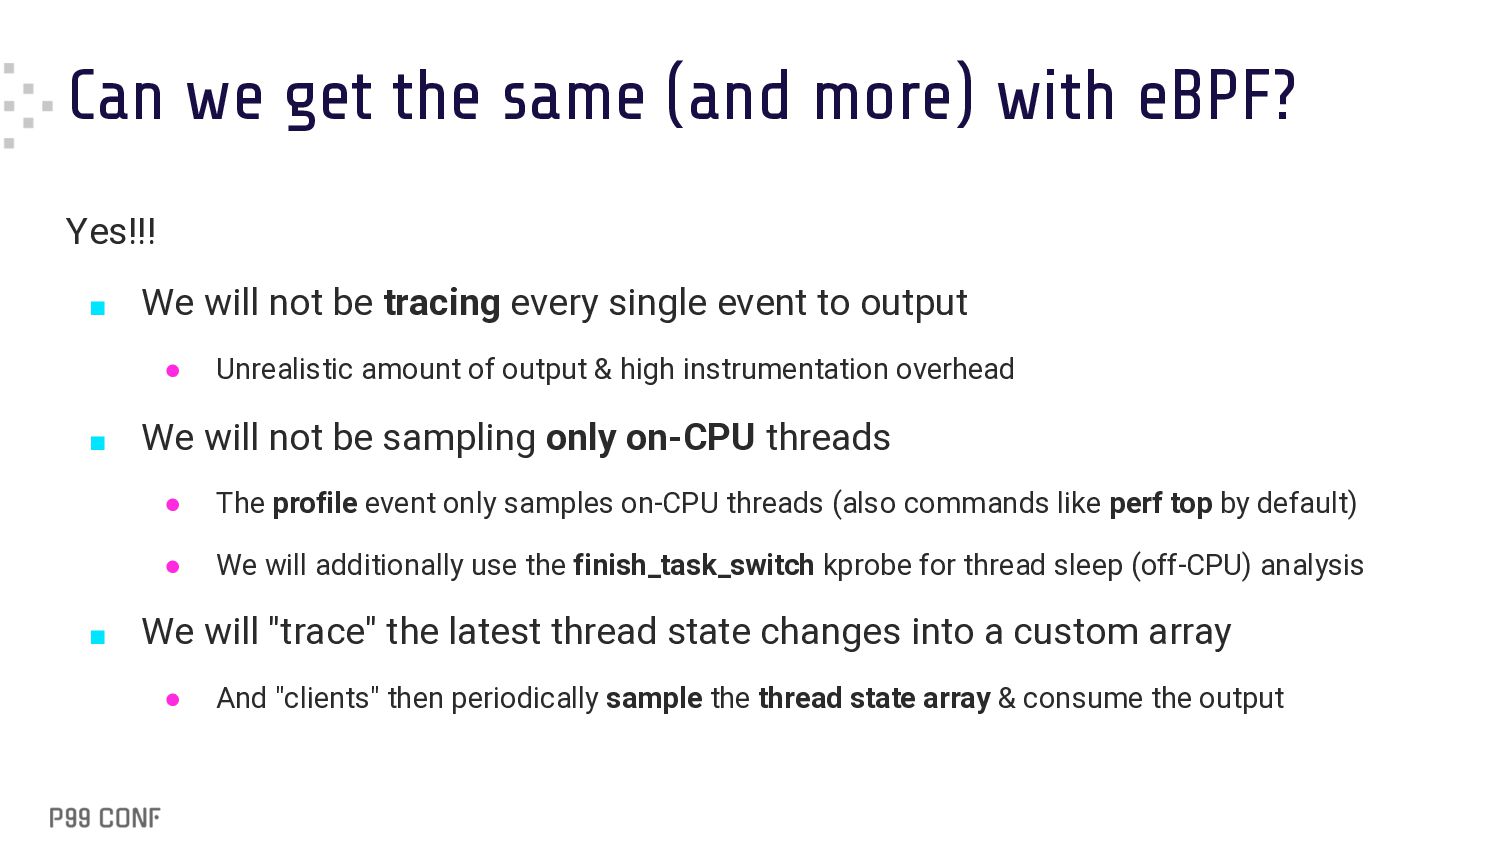
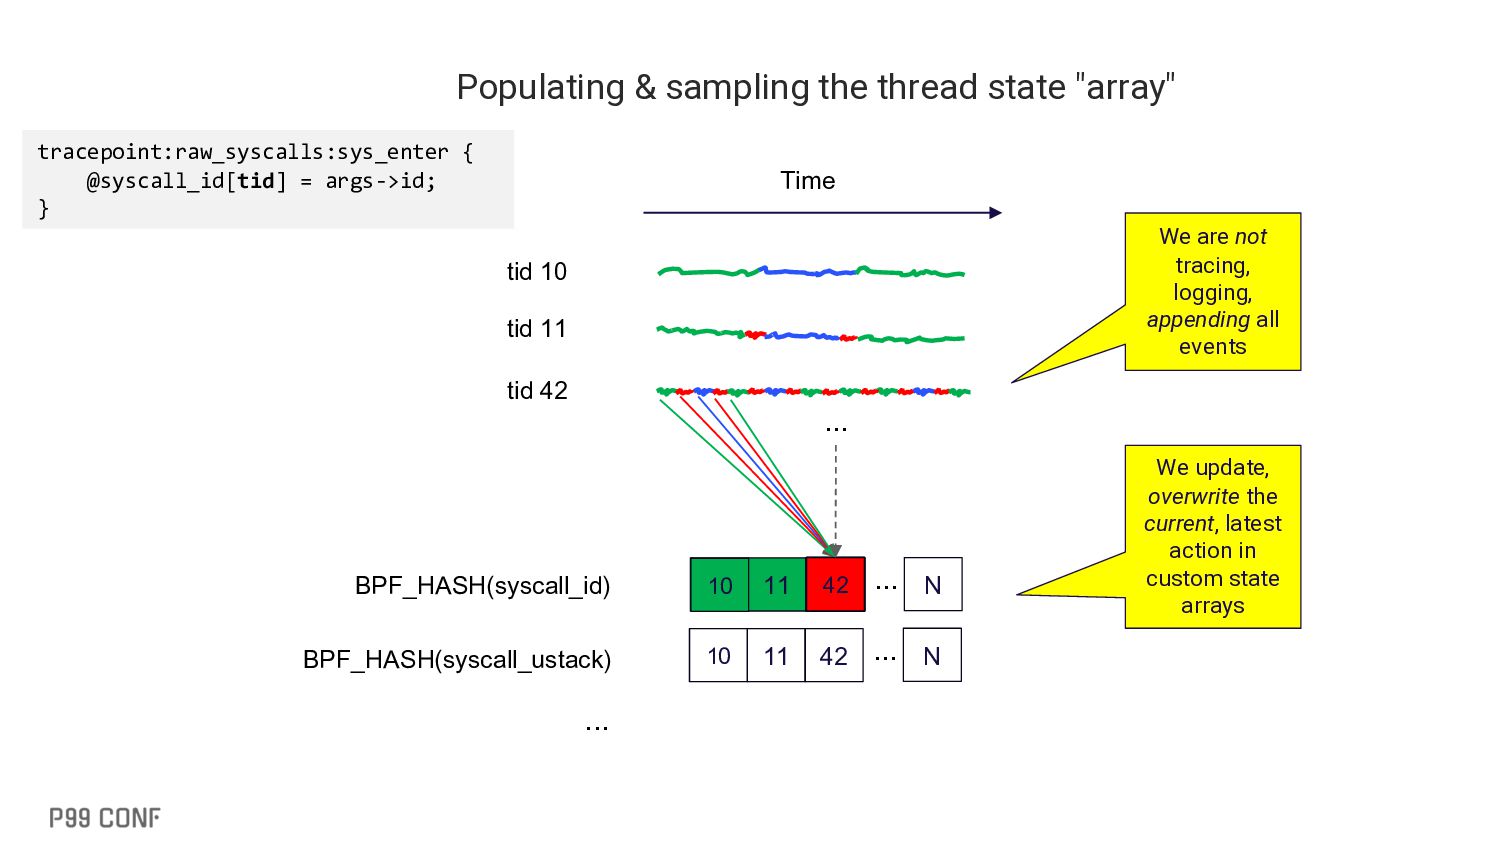
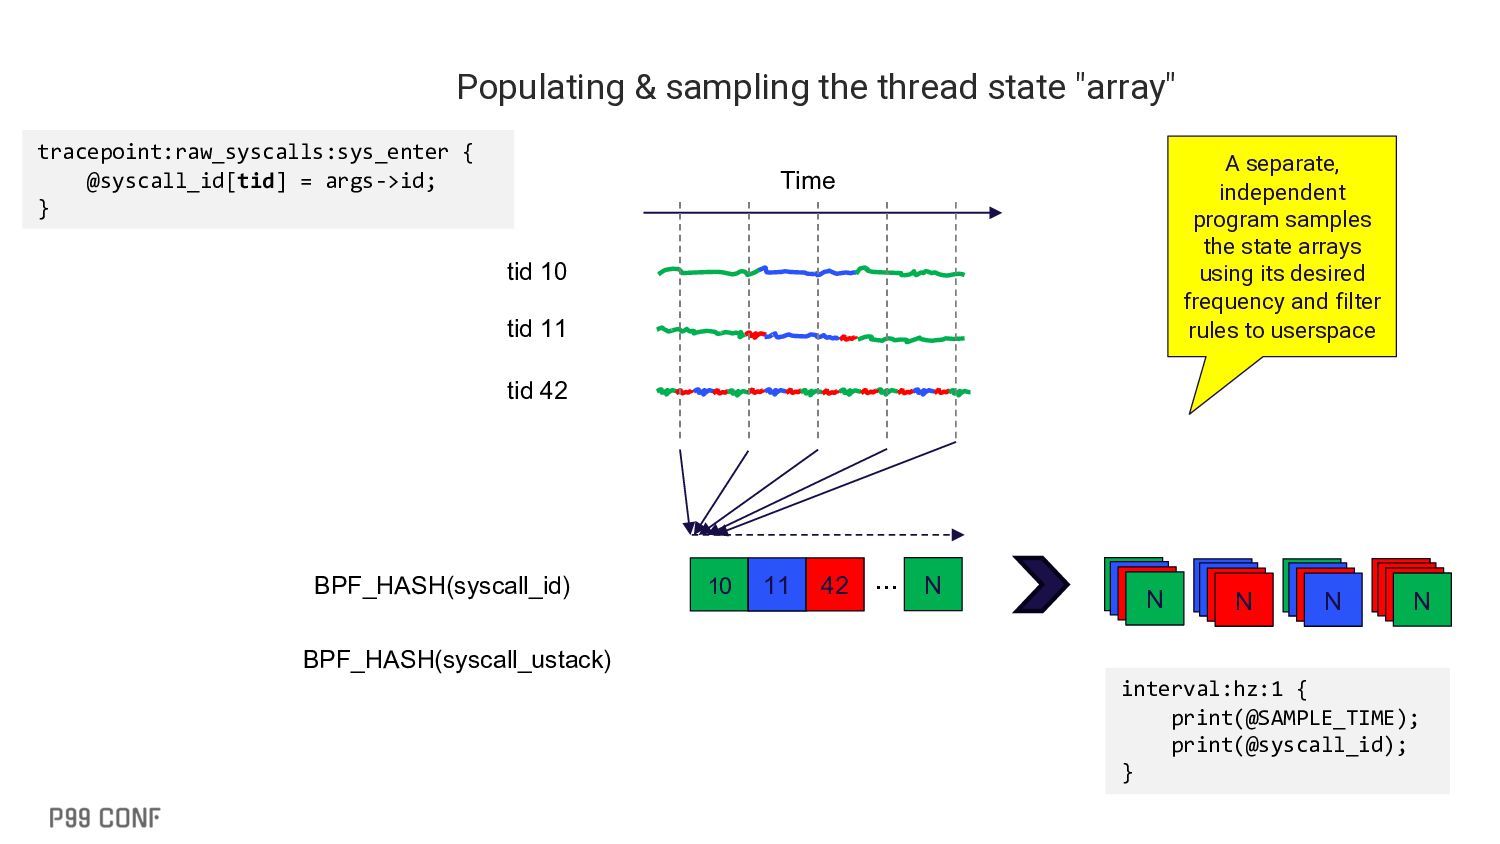
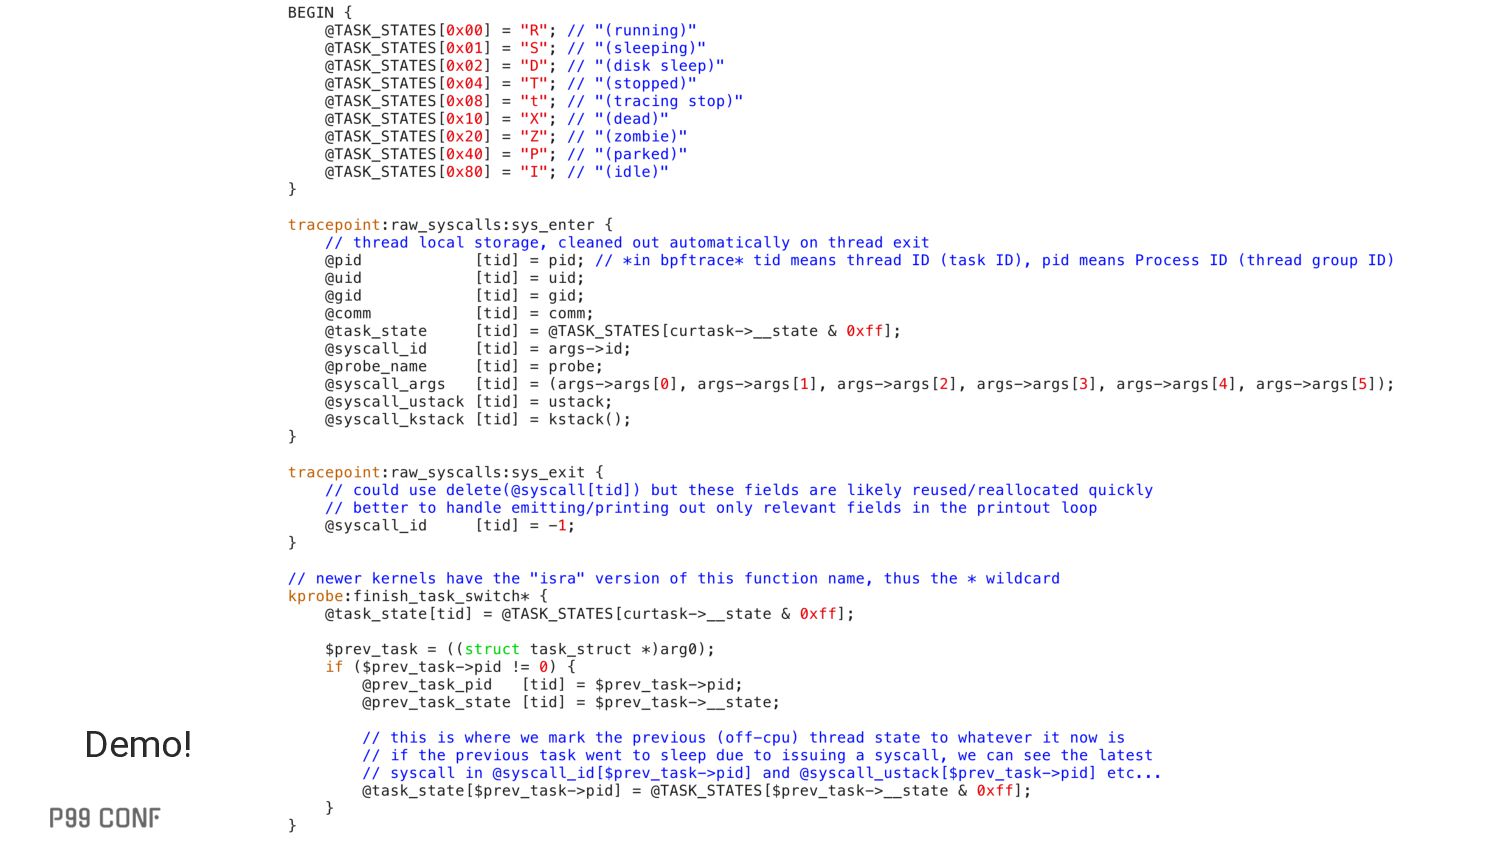
▪ We will not be tracing every single event to output • Unrealistic amount of output & high instrumentation overhead ▪ We will not be sampling only on-CPU threads • The profile event only samples on-CPU threads (also commands like perf top by default) • We will additionally use the finish_task_switch kprobe for thread sleep (off-CPU) analysis ▪ We will "trace" the latest thread state changes into a custom array • And "clients" then periodically sample the thread state array & consume the output
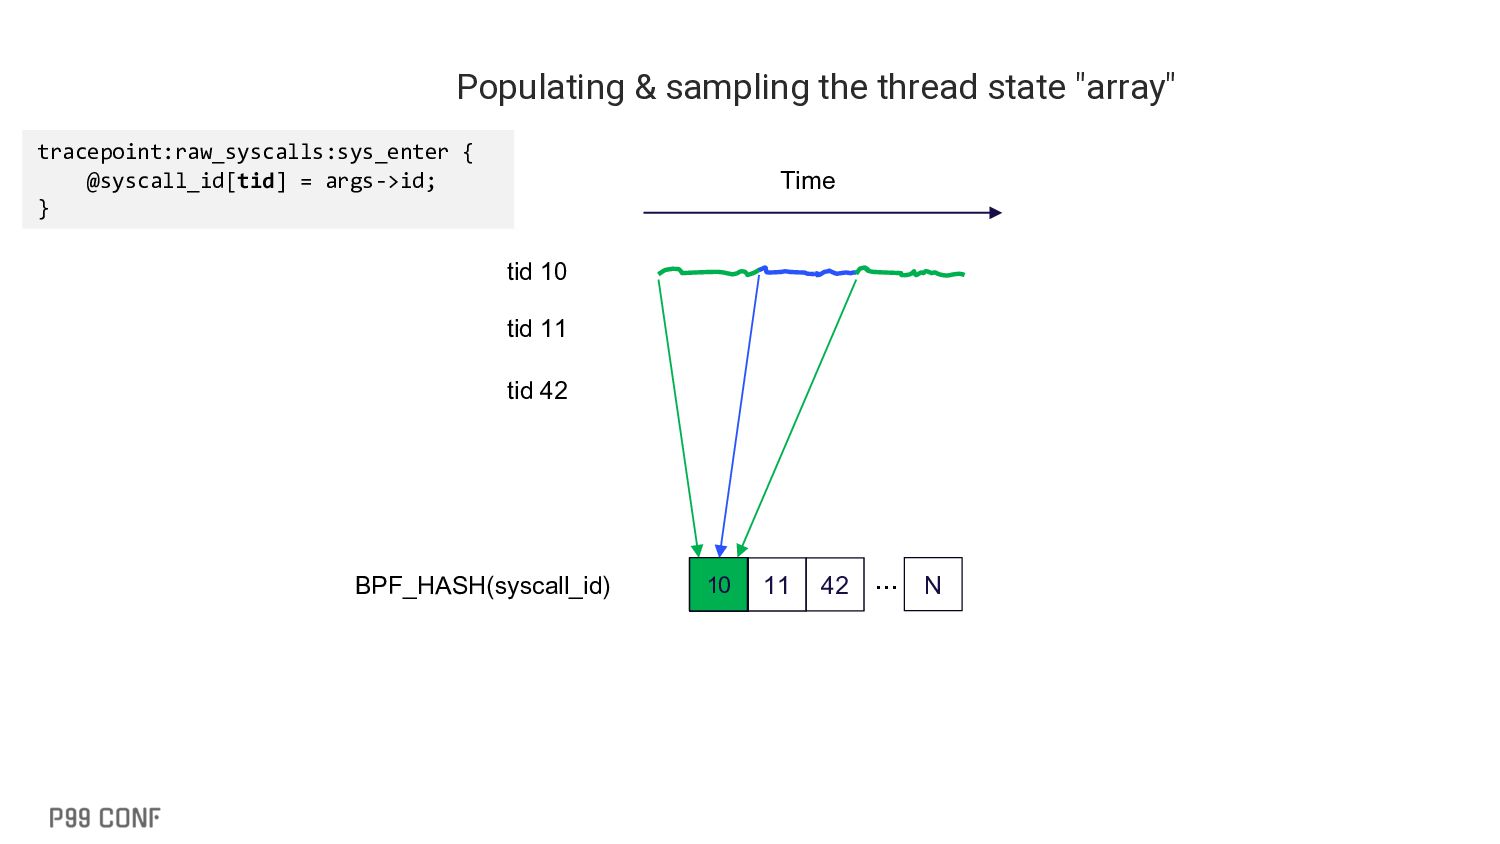
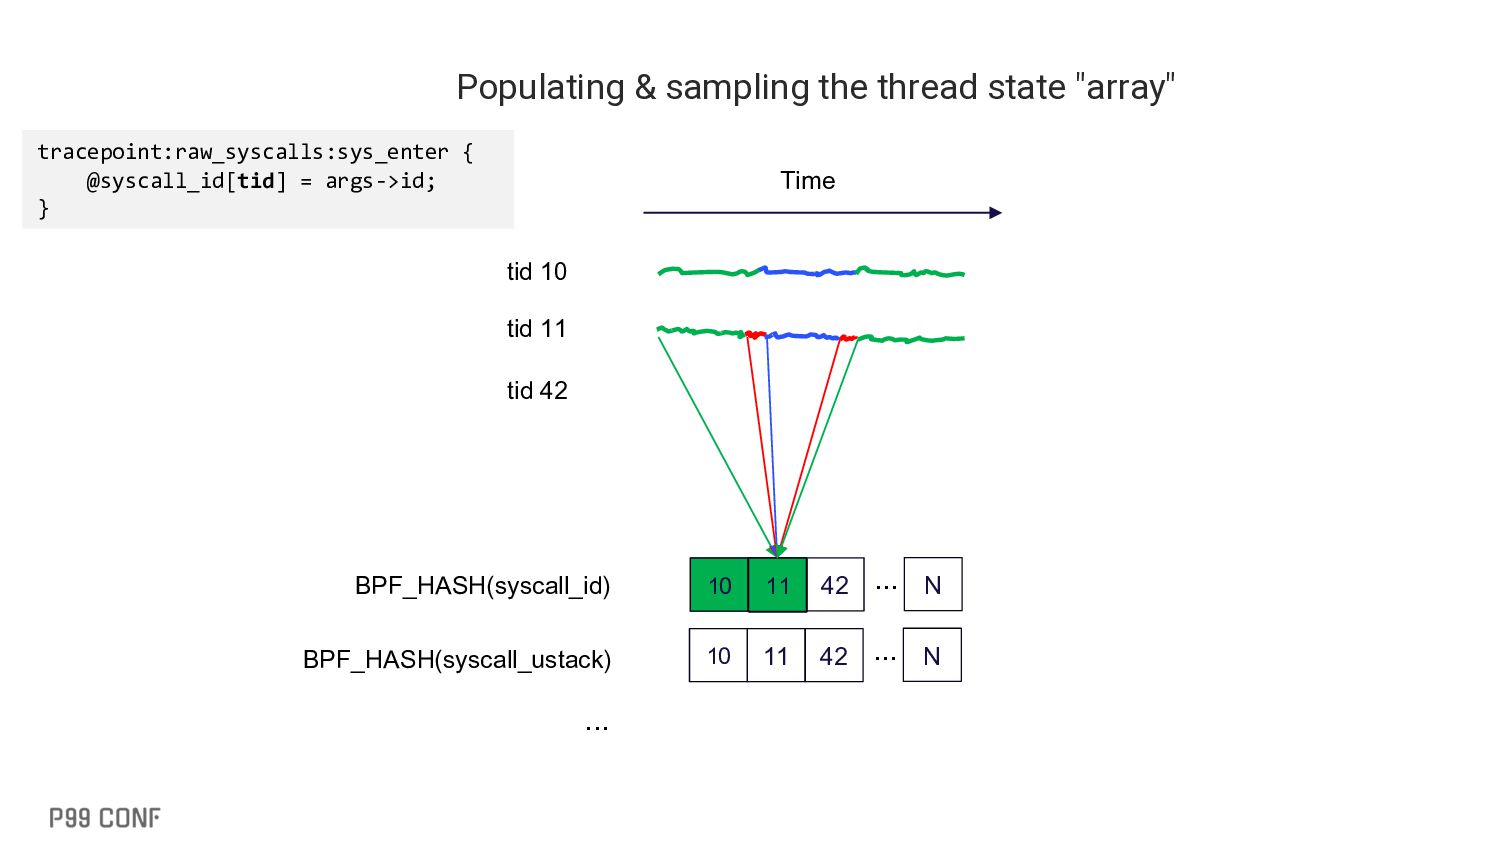
tid 11 tid 42 10 11 42 N ... BPF_HASH(syscall_id) 10 42 42 42 42 42 BPF_HASH(syscall_ustack) 10 11 42 N ... ... tracepoint:raw_syscalls:sys_enter { @syscall_id[tid] = args->id; } 42 42 42 42 42 42 We are not tracing, logging, appending all events We update, overwrite the current, latest action in custom state arrays ...
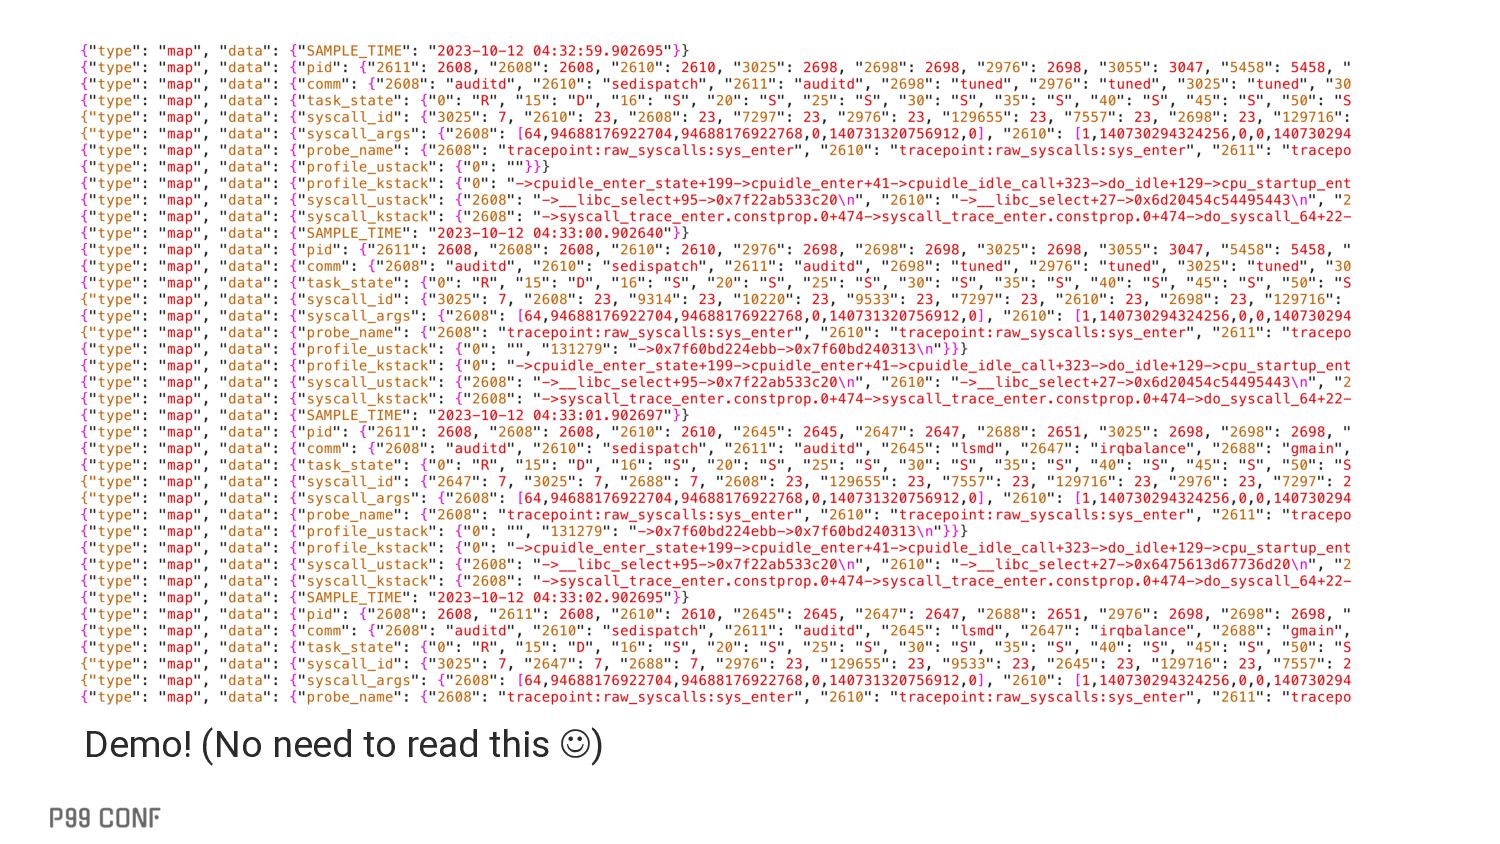
tid 11 tid 42 10 11 42 N ... BPF_HASH(syscall_id) tracepoint:raw_syscalls:sys_enter { @syscall_id[tid] = args->id; } A separate, independent program samples the state arrays using its desired frequency and filter rules to userspace BPF_HASH(syscall_ustack) interval:hz:1 { print(@SAMPLE_TIME); print(@syscall_id); } 10 11 42 N 10 11 42 N 10 11 42 N 10 11 42 N
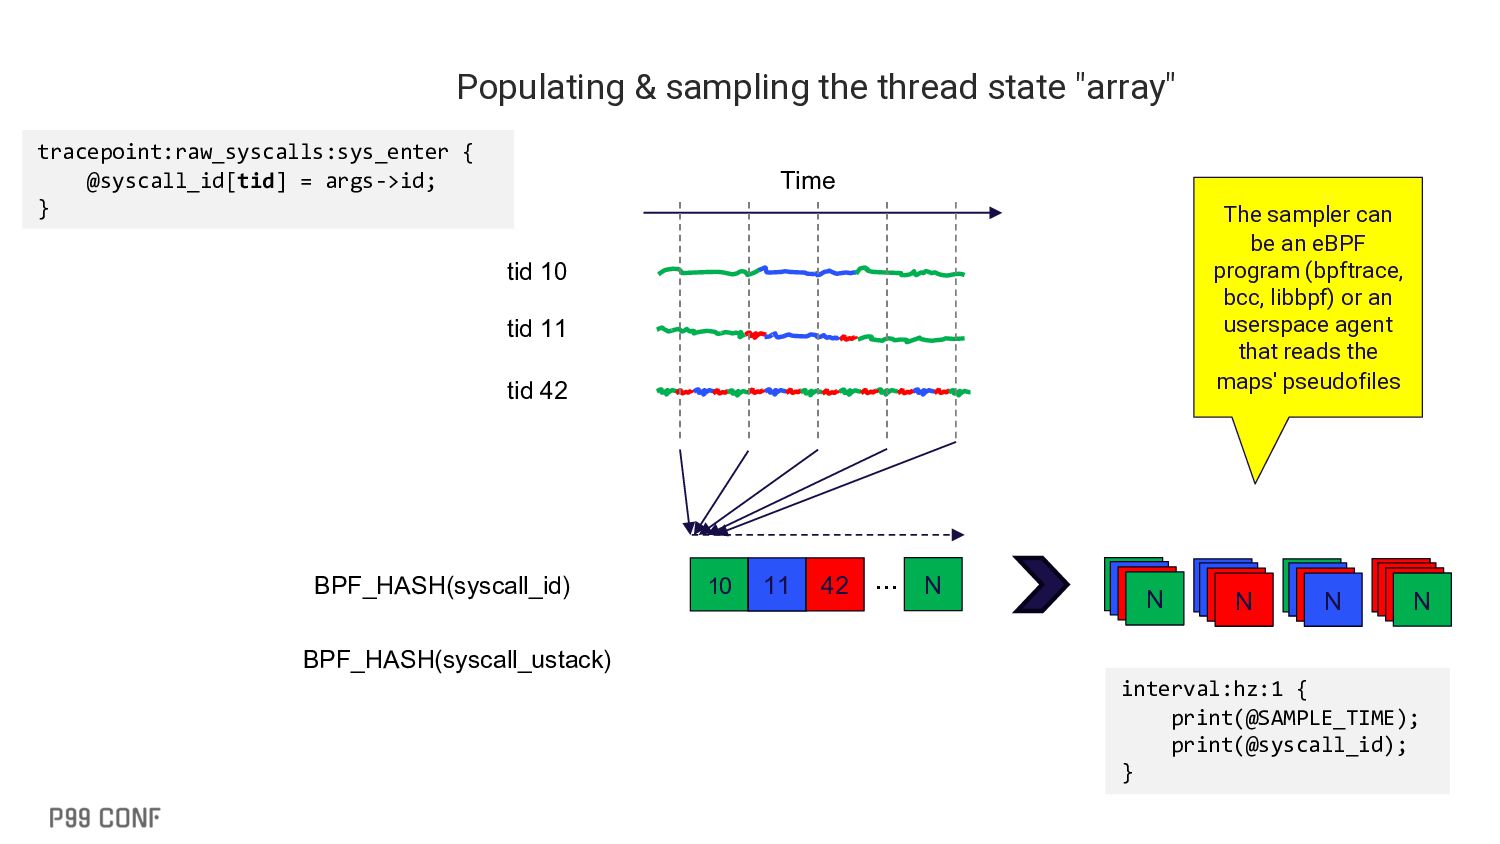
tid 11 tid 42 10 11 42 N ... BPF_HASH(syscall_id) tracepoint:raw_syscalls:sys_enter { @syscall_id[tid] = args->id; } BPF_HASH(syscall_ustack) interval:hz:1 { print(@SAMPLE_TIME); print(@syscall_id); } 10 11 42 N 10 11 42 N 10 11 42 N 10 11 42 N The sampler can be an eBPF program (bpftrace, bcc, libbpf) or an userspace agent that reads the maps' pseudofiles
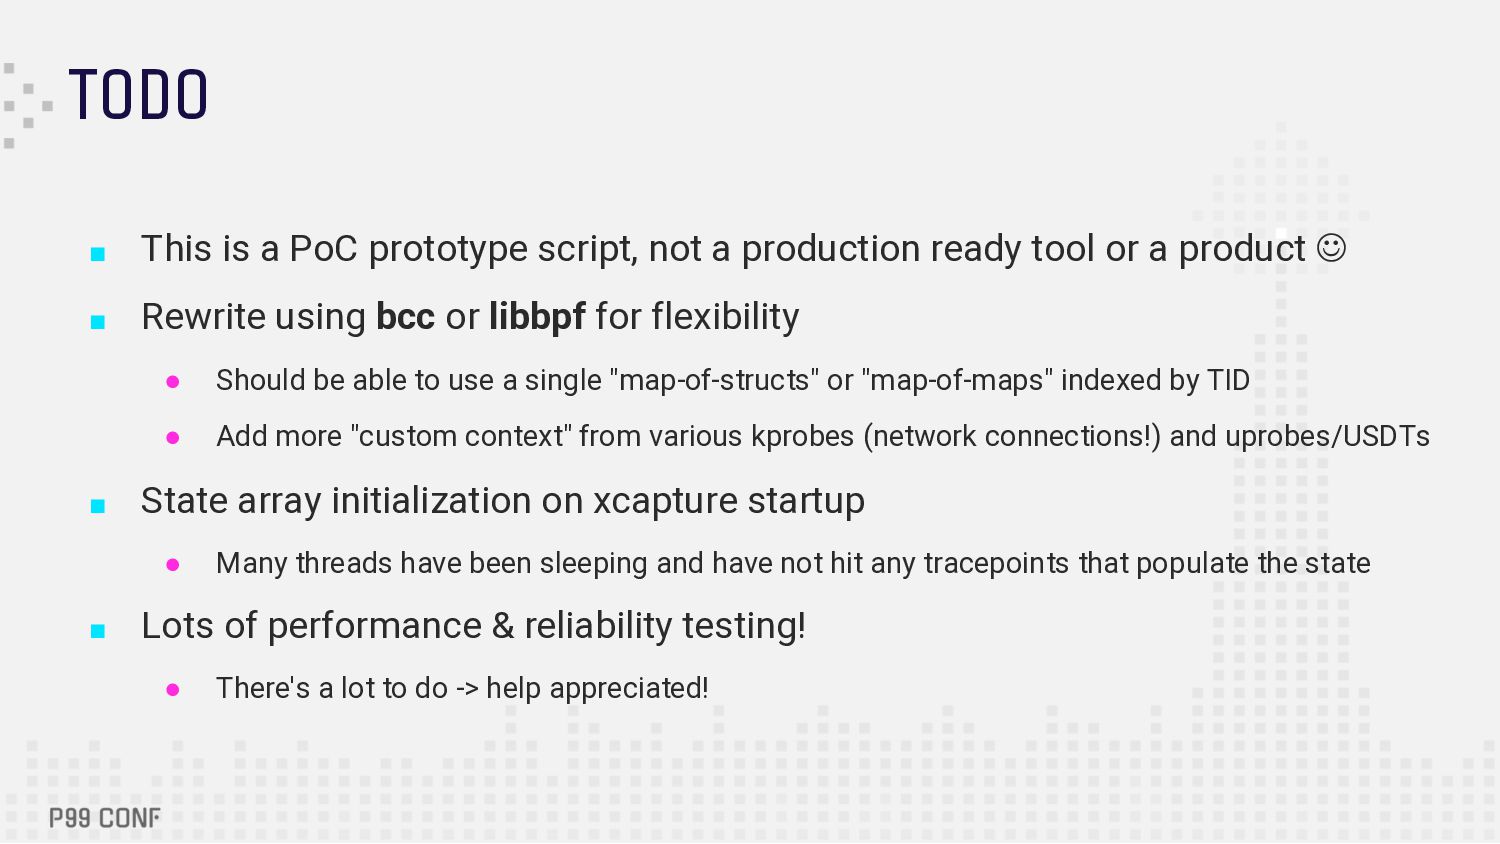
production ready tool or a product J ▪ Rewrite using bcc or libbpf for flexibility • Should be able to use a single "map-of-structs" or "map-of-maps" indexed by TID • Add more "custom context" from various kprobes (network connections!) and uprobes/USDTs ▪ State array initialization on xcapture startup • Many threads have been sleeping and have not hit any tracepoints that populate the state ▪ Lots of performance & reliability testing! • There's a lot to do -> help appreciated!
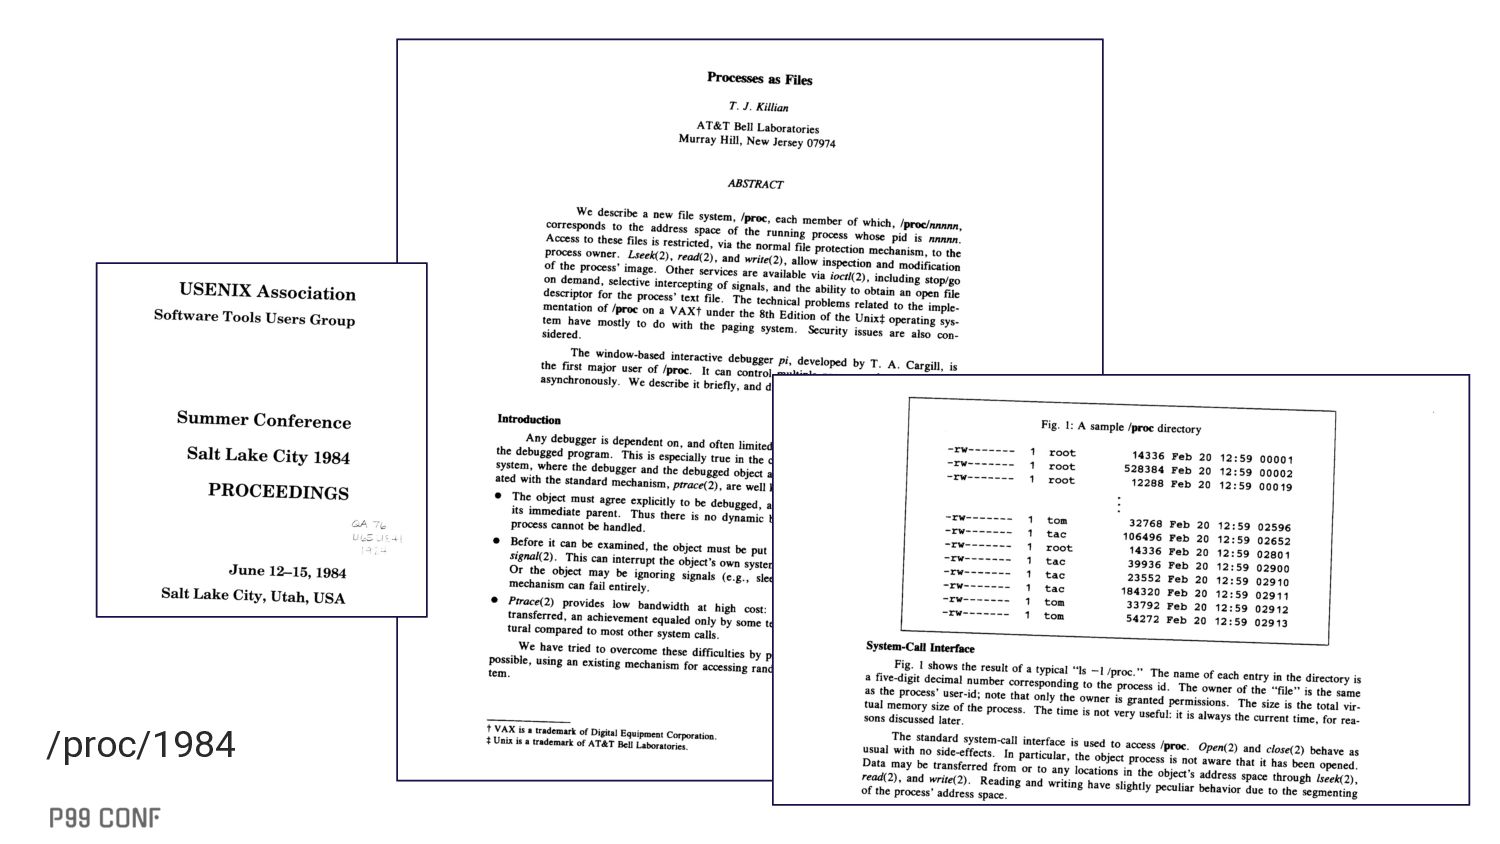
as files (1984) • https://lucasvr.gobolinux.org/etc/Killian84-Procfs-USENIX.pdf ▪ Profiling Linux Activity for Performance and Troubleshooting (/proc) • https://youtu.be/YEWp3O7Kem8 ▪ More videos by me • https://tanelpoder.com/videos/
![Tanel Põder [email protected] @tanelpoder tanelpoder.com Thank you! Let’s connect.](https://files.speakerdeck.com/presentations/463193c96b3d4ee5a5018c7c9c2080ee/slide_29.jpg)