Põder • I’m a database performance geek (23 years) • Before that an Unix/Linux geek, (27 years) • Oracle, Hadoop, Spark, cloud databases J • Focused on performance & troubleshooting • Inventing & hacking stuff, consulting, training • Co-author of the Expert Oracle Exadata book • Co-founder & technical advisor at Gluent • 2 patents in data virtualization space • Working on a secret project ;-) • Blog: tanelpoder.com • Twitter: twitter.com/TanelPoder • Questions: [email protected] alumni
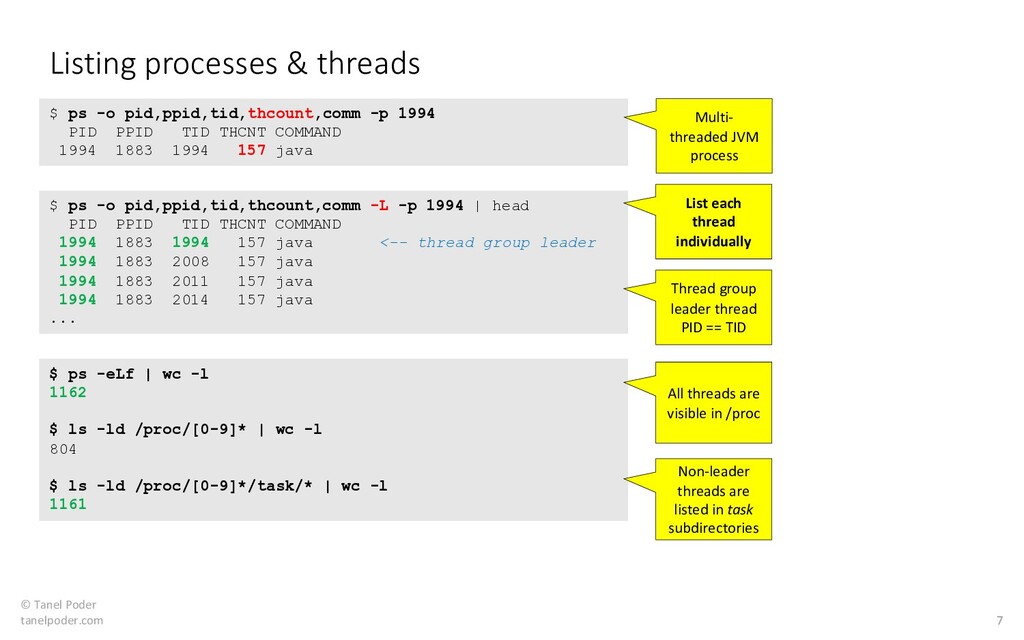
do ad-hoc troubleshooting for different customers • No time to engineer a solution, the problem is already happening • Troubleshooting across a variety of servers, distros, installations • Old Linux distro/kernel versions • No permission to change anything (including enabling kernel tracing) • Sometimes no root access • Idea: Ultra-low footprint tools that get the most out of already enabled Linux instrumentation • /proc filesystem! Preferring low-tech tools for high-tech problems Low tech tools aren't always "deep" enough or precise enough, but they are quick & easy to try out
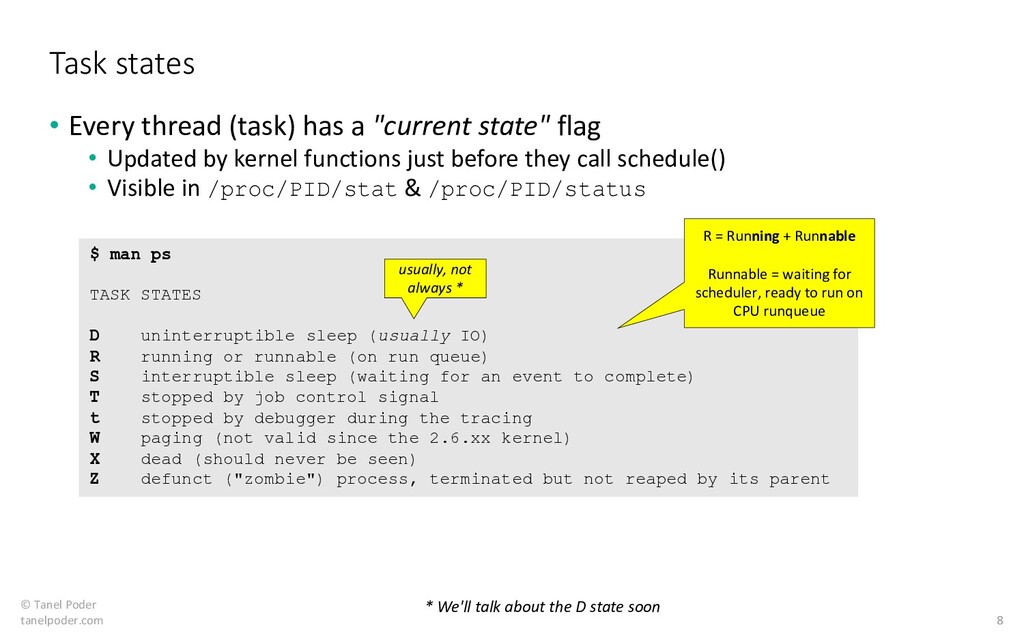
has a "current state" flag • Updated by kernel functions just before they call schedule() • Visible in /proc/PID/stat & /proc/PID/status Task states $ man ps TASK STATES D uninterruptible sleep (usually IO) R running or runnable (on run queue) S interruptible sleep (waiting for an event to complete) T stopped by job control signal t stopped by debugger during the tracing W paging (not valid since the 2.6.xx kernel) X dead (should never be seen) Z defunct ("zombie") process, terminated but not reaped by its parent usually, not always * R = Running + Runnable Runnable = waiting for scheduler, ready to run on CPU runqueue * We'll talk about the D state soon
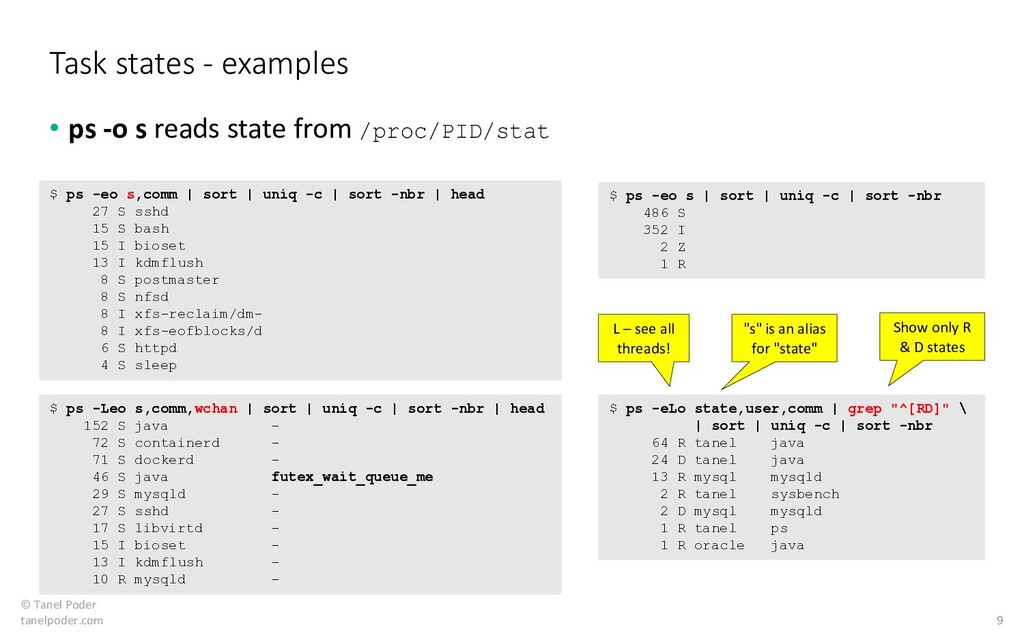
reads state from /proc/PID/stat Task states - examples $ ps -eo s | sort | uniq -c | sort -nbr 486 S 352 I 2 Z 1 R $ ps -eo s,comm | sort | uniq -c | sort -nbr | head 27 S sshd 15 S bash 15 I bioset 13 I kdmflush 8 S postmaster 8 S nfsd 8 I xfs-reclaim/dm- 8 I xfs-eofblocks/d 6 S httpd 4 S sleep $ ps -Leo s,comm,wchan | sort | uniq -c | sort -nbr | head 152 S java - 72 S containerd - 71 S dockerd - 46 S java futex_wait_queue_me 29 S mysqld - 27 S sshd - 17 S libvirtd - 15 I bioset - 13 I kdmflush - 10 R mysqld - $ ps -eLo state,user,comm | grep "^[RD]" \ | sort | uniq -c | sort -nbr 64 R tanel java 24 D tanel java 13 R mysql mysqld 2 R tanel sysbench 2 D mysql mysqld 1 R tanel ps 1 R oracle java L – see all threads! Show only R & D states "s" is an alias for "state"
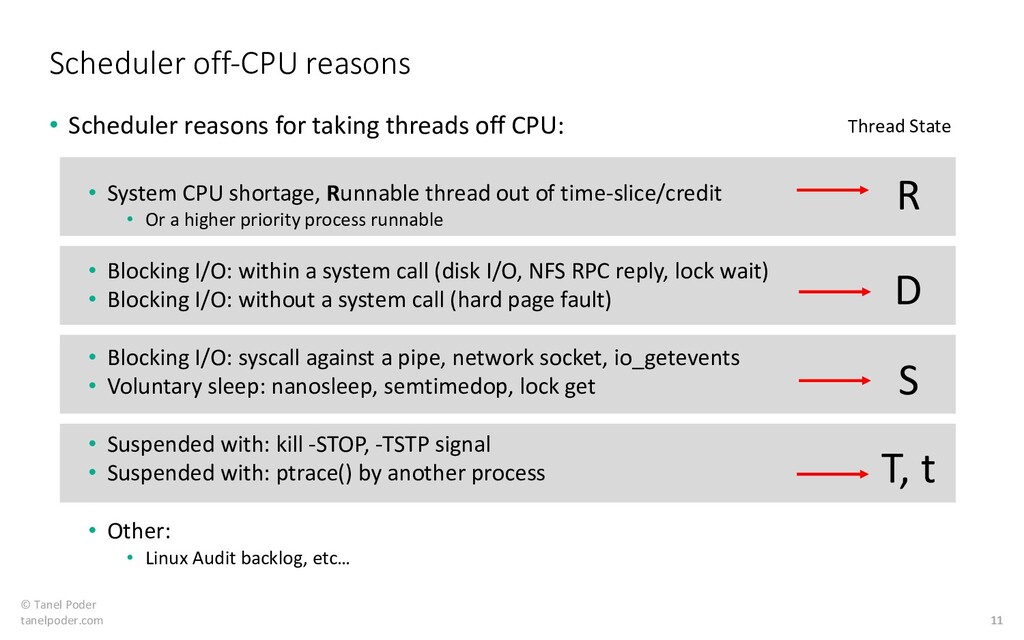
Scheduler reasons for taking threads off CPU: • System CPU shortage, Runnable thread out of time-slice/credit • Or a higher priority process runnable • Blocking I/O: within a system call (disk I/O, NFS RPC reply, lock wait) • Blocking I/O: without a system call (hard page fault) • Blocking I/O: syscall against a pipe, network socket, io_getevents • Voluntary sleep: nanosleep, semtimedop, lock get • Suspended with: kill -STOP, -TSTP signal • Suspended with: ptrace() by another process • Other: • Linux Audit backlog, etc… R D S T, t Thread State
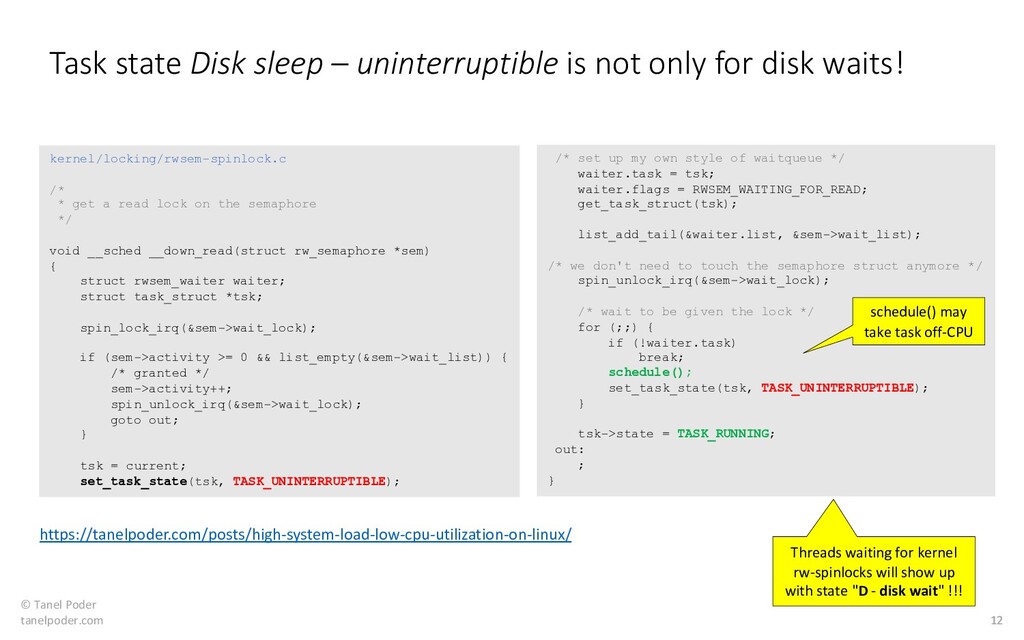
– uninterruptible is not only for disk waits! kernel/locking/rwsem-spinlock.c /* * get a read lock on the semaphore */ void __sched __down_read(struct rw_semaphore *sem) { struct rwsem_waiter waiter; struct task_struct *tsk; spin_lock_irq(&sem->wait_lock); if (sem->activity >= 0 && list_empty(&sem->wait_list)) { /* granted */ sem->activity++; spin_unlock_irq(&sem->wait_lock); goto out; } tsk = current; set_task_state(tsk, TASK_UNINTERRUPTIBLE); /* set up my own style of waitqueue */ waiter.task = tsk; waiter.flags = RWSEM_WAITING_FOR_READ; get_task_struct(tsk); list_add_tail(&waiter.list, &sem->wait_list); /* we don't need to touch the semaphore struct anymore */ spin_unlock_irq(&sem->wait_lock); /* wait to be given the lock */ for (;;) { if (!waiter.task) break; schedule(); set_task_state(tsk, TASK_UNINTERRUPTIBLE); } tsk->state = TASK_RUNNING; out: ; } Threads waiting for kernel rw-spinlocks will show up with state "D - disk wait" !!! schedule() may take task off-CPU https://tanelpoder.com/posts/high-system-load-low-cpu-utilization-on-linux/
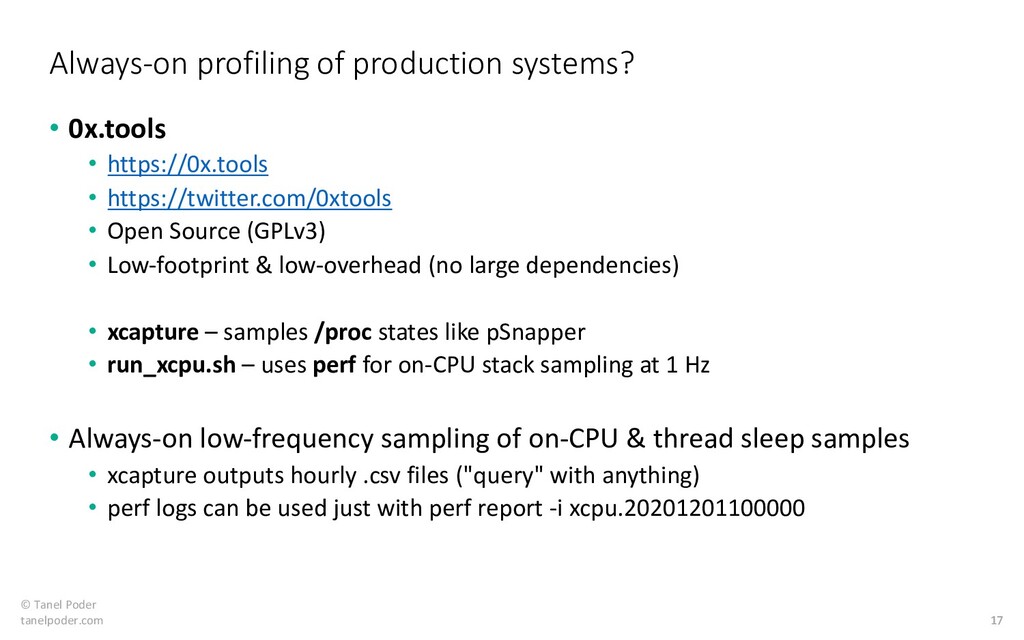
• https://twitter.com/0xtools • Open Source (GPLv3) • Low-footprint & low-overhead (no large dependencies) • xcapture – samples /proc states like pSnapper • run_xcpu.sh – uses perf for on-CPU stack sampling at 1 Hz • Always-on low-frequency sampling of on-CPU & thread sleep samples • xcapture outputs hourly .csv files ("query" with anything) • perf logs can be used just with perf report -i xcpu.20201201100000 Always-on profiling of production systems?