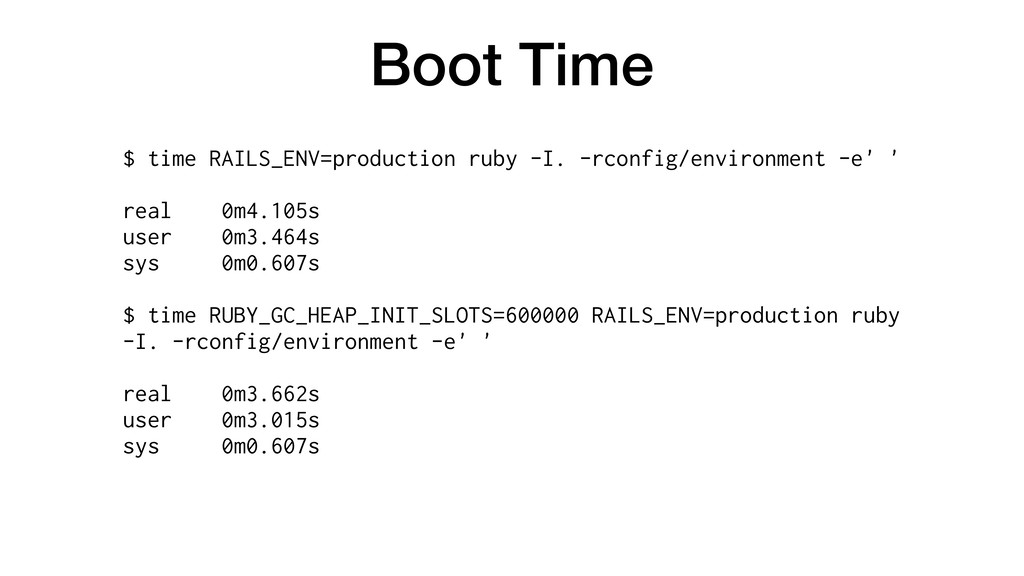
-0400 12:16 up 6 days, 19:54, 8 users, load averages: 2.94 2.27 2.39
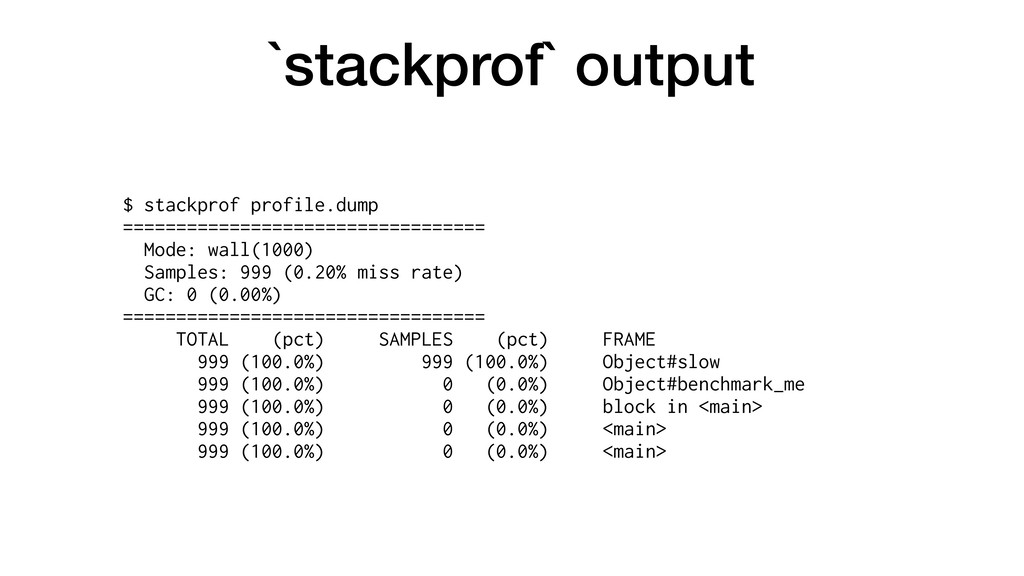
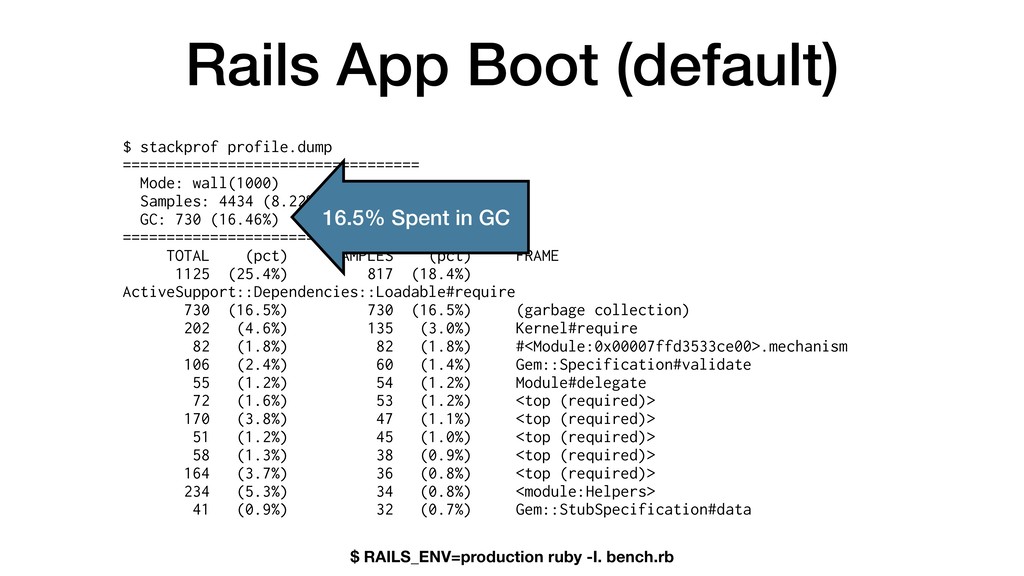
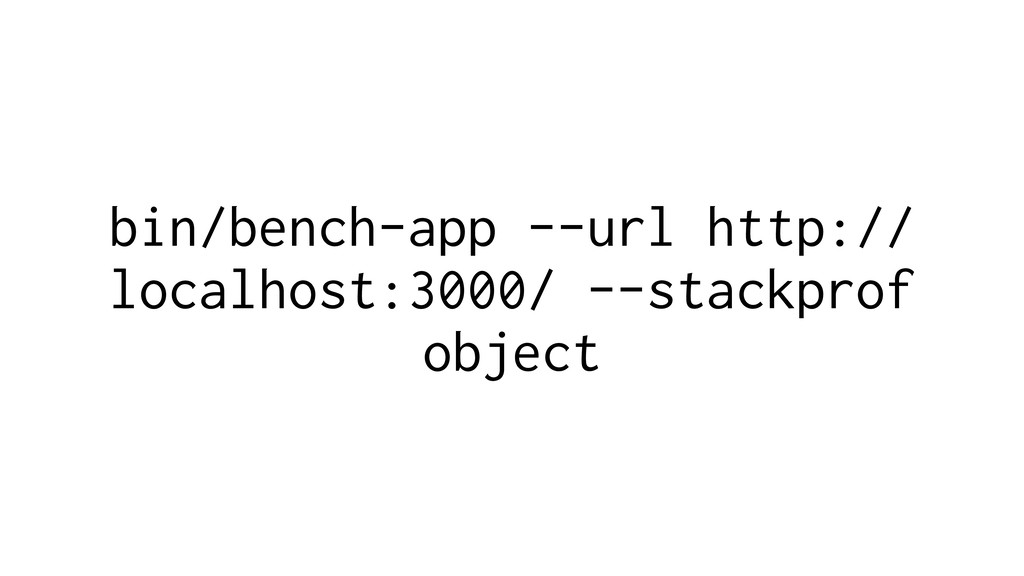
[email protected]:/Users/aaron/github/github pid 35651 - 940 MB RSS - 54.303887s CPU - 2,163,221 objects 9763 loaded features {:TOTAL=>3899911, :FREE=>365601, :T_OBJECT=>370493, :T_CLASS=>138069, :T_MODULE=>32498, :T_FLOAT=>17, :T_STRING=>1001412, :T_REGEXP=>14153, :T_ARRAY=>398461, :T_HASH=>152491, :T_STRUCT=>11063, :T_BIGNUM=>46, :T_FILE=>81, :T_DATA=>166354, :T_MATCH=>37127, :T_COMPLEX=>1, :T_RATIONAL=>907, : T_SYMBOL=>10038, :T_IMEMO=>1083137, :T_NODE=>1729, :T_ICLASS=>116233} {:count=>54, :heap_allocated_pages=>9568, :heap_sorted_length=>9910, :heap_allocatable_pages=>342, :heap_available_slots=>3899911, :heap_live_slots=>3534410, :heap_free_slots=>365501, :heap_final_slots=>0, :heap_marked_slots=>3186821, :heap_eden_pages=>9568, :heap_tomb_pages=>0, :total_al located_pages=>9568, :total_freed_pages=>0, :total_allocated_objects=>37844811, :total_freed_objects=>34310401, :malloc_increase_bytes=>12849616, :malloc_increase_bytes_limit=>128000000, :minor_gc_count=>43, :major_gc_count=>11, :remembered_wb_unprotected_objects=>77457, :remembered_wb_un protected_objects_limit=>154914, :old_objects=>3009873, :old_objects_limit=>6019746, :oldmalloc_increase_bytes=>12850064, :oldmalloc_increase_bytes_limit=>128000000} /Users/aaron/github/github/vendor/ruby/0d9762bcc5e0bb319765c8e40c5524509159003b/bin/ruby ruby 2.4.3p200 (2017-09-15 revision 59914) [x86_64-darwin17] RUBY_GC_HEAP_GROWTH_FACTOR=1.25 RUBY_GC_HEAP_GROWTH_MAX_SLOTS=300000 RUBY_GC_OLDMALLOC_LIMIT=128000000 RUBY_GC_HEAP_INIT_SLOTS=600000 RUBY_GC_MALLOC_LIMIT=128000000 RUBY_GC_HEAP_FREE_SLOTS=600000 10 requests to http://localhost:3000/ as (anonymous) peak memory: 979 MB RSS response size: 504 KB total (50.4 KB/req) response time: 0ms total render time: 0ms total cpu time: 0ms total idle time: 0ms total oob gc: 0 / 0ms in-request gc: 0 / 0ms total allocations: 0 objs total ar objs: 0 objs total smoke: 0 / 0ms total mysql: 0 / 0ms total redis: 0 / 0ms total cache: 0 / 0ms total marshal: 0 / 0ms total zlib: 0 / 0ms total {:TOTAL=>4338897, :FREE=>1023915, :T_OBJECT=>296251, :T_CLASS=>138076, :T_MODULE=>32499, :T_FLOAT=>17, :T_STRING=>911236, :T_REGEXP=>17144, :T_ARRAY=>412142, :T_HASH=>166431, :T_STRUCT=>11006, :T_BIGNUM=>46, :T_FILE=>6, :T_DATA=>166436, :T_MATCH=>401, :T_COMPLEX=>1, :T_RATIONAL=>907, :T_S YMBOL=>10042, :T_IMEMO=>1034234, :T_NODE=>1729, :T_ICLASS=>116378} {Thread::Mutex=>4749, Time=>3263, Proc=>154783, StringIO=>4, UnboundMethod=>1166, Thread=>2, Concurrent::AtomicFixnum=>1, Random=>2, Method=>454, Google::Protobuf::FieldDescriptor=>647, Google::Protobuf::Descriptor=>147, Google::Protobuf::OneofDescriptor=>3, :autoload_i=>663, :autoload=>94, DateTime=>20, Google::Protobuf::EnumDescriptor=>49, Goomba::Sanitizer=>2, Goomba::Selector=>32, PrettyLights::Theme=>1, PrettyLights::Library=>1, Object=>4, FFI::DynamicLibrary=>5, BigDecimal=>3, Keiko=>1, Date=>15, Encoding=>101, ThreadGroup=>1, Binding=>2, RubyVM=>1, ARGF.class=>1, Data=>1, :unknown=>5, JSON::Ext::Generator::State=>3, swig_runtime_data=>1, OpenSSL::Digest::SHA256=>2, ObjectSpace::WeakMap=>1, GRPC::Core::TimeSpec=>3, FFI::FunctionType=>44, FFI::Function=>41, FFI::DynamicLibrary::Symbol=>42, FFI::Type::Mapped=>13, FFI::StructByReference=>4, FFI::VariadicInvoker=>1, FFI::StructLayout=>5, FFI::StructLayout::Number=>8, FFI::StructLayout::Array=>1, FFI::ArrayType=>1, FFI::StructLayout::Pointer=>3, FFI::StructLayout::String=>4, FFI::StructLayout::InnerStruct=>1, FFI::StructByValue=>1, FFI::StructLayout::Mapped=>2, Google::Protobuf::DescriptorPool=>1, MessagePack::Factory=>1, Concurrent::AtomicReference=>1, Rlibmemcached::MemcachedSt=>1, OpenSSL::PKey::EC::Group=>1, OpenSSL::X509::Store=>1, OpenSSL::PKey::DH=>2, RE2::Regexp=>1, FFI::Pointer=>1, FFI::Type::Builtin=>21, OpenSSL::Cipher=>1} {:count=>60, :heap_allocated_pages=>10645, :heap_sorted_length=>10645, :heap_allocatable_pages=>0, :heap_available_slots=>4338897, :heap_live_slots=>3315218, :heap_free_slots=>1023679, :heap_final_slots=>0, :heap_marked_slots=>3314982, :heap_eden_pages=>10645, :heap_tomb_pages=>0, :total_ allocated_pages=>10645, :total_freed_pages=>0, :total_allocated_objects=>42922679, :total_freed_objects=>39607461, :malloc_increase_bytes=>5792, :malloc_increase_bytes_limit=>128000000, :minor_gc_count=>48, :major_gc_count=>12, :remembered_wb_unprotected_objects=>77656, :remembered_wb_unp rotected_objects_limit=>155312, :old_objects=>3144841, :old_objects_limit=>6289682, :oldmalloc_increase_bytes=>6240, :oldmalloc_increase_bytes_limit=>128000000} 3314982 live, 1023915 free slots 979 MB RSS Stackprof results captured in: tmp/stackprof_4.2.10.github_20180419121610.prof
![Growth Test Program x = [] a = GC.stat(:count) 600000.times](https://files.speakerdeck.com/presentations/50ba868b605c434985ca463e4898deb7/slide_123.jpg)
![Array References a = [:b, :c] Array Symbol Symbol](https://files.speakerdeck.com/presentations/50ba868b605c434985ca463e4898deb7/slide_144.jpg)
![Output GitHub (master [490a985]) - Rails 4.2.10.github (development) 2018-04-19 12:16:11](https://files.speakerdeck.com/presentations/50ba868b605c434985ca463e4898deb7/slide_157.jpg)