up” ) https://github.com/tfhartmann/splunk101 ✤ Development Tools and Infrastructure Engineer ✤ Passionate about automation (automate all the things!) ✤ Worked in IT for 10+ years (all of it magical) ✤ Splunk user for 6+ years (Ah, Splunk 3.0 how I miss you..) ✤ Administered and designed Splunk cluster ingesting roughly 400 GB / day
It’s easy, we did it with Pizza and beer ✤ RPM, Deb, And Tar packages ✤ Configuration via Files and UI ✤ INI Config Files under $SH/etc/system/local ✤ … and of course awesome *ahem* Puppet modules, Chef cookbooks, and Ansible play books Installation. How do I quickly get Splunk up and running and point it at some log files? Is this a heavy lift? (give it a try on your vagrant box, RPM is in /tmp )
is more than a fancy 'grep' tool? (obligatory tech talk Star Wars reference) ✤ Yes, Splunk can grep if it wants to … it can also: ✤ Normalize data into z-scores ✤ Predict trends based on data history ✤ Geolocate your IP’s ✤ Trigger alerts and actions, do math, create urls, calculate distance with haversine.. all that then display it on a map Splunk empowered a lowly sysadmin to become a “data scientist” (or at least a data lab assistant)
by month or by week, etc The chart is great for tabular outputs - but - isn’t time based index=os COMMAND=* | chart count(USER) as count by USER | sort - count Ok, why do I care? Chart on it’s own doesn’t have much *wow* factor but lets you do some great stuff with the output. For example you might want to pass a list of usernames out from a sub search, to a search that validated them as valid.
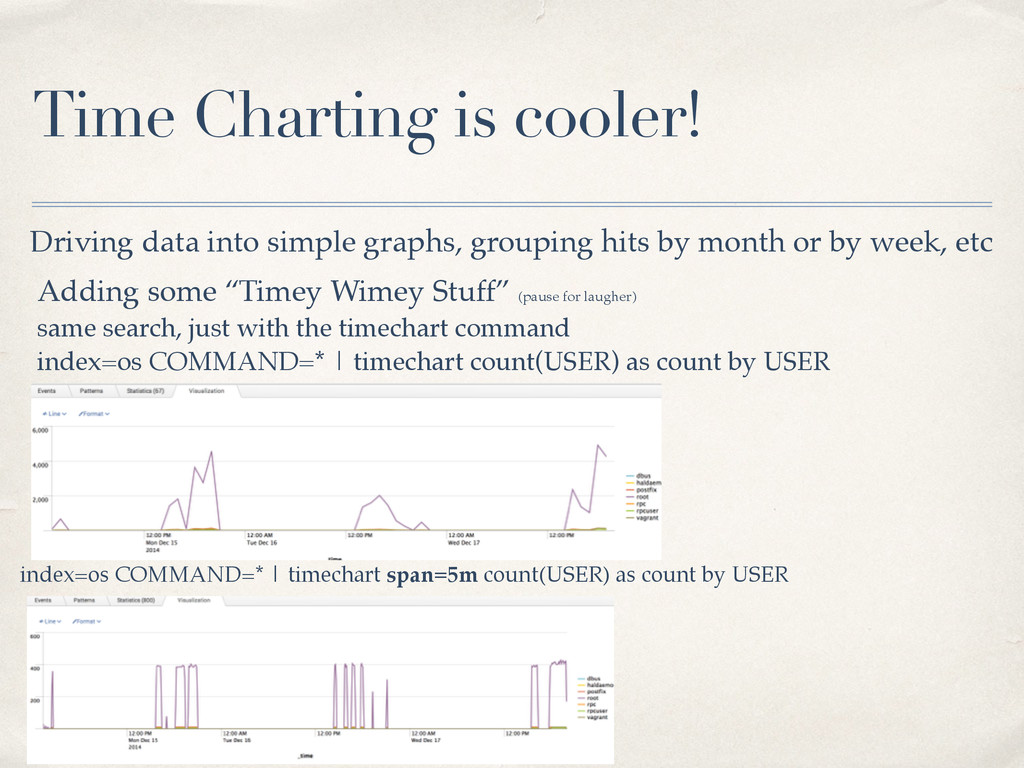
hits by month or by week, etc Adding some “Timey Wimey Stuff” (pause for laugher) same search, just with the timechart command index=os COMMAND=* | timechart count(USER) as count by USER index=os COMMAND=* | timechart span=5m count(USER) as count by USER
another kind of log data. For example if I have front-end apache logs and back-end Tomcat logs... how can I marry those two data sets together matching on time and remote IP or whatever so I can get a more complete picture of what my users are doing? index=os src_ip=* OR addr=* | transaction addr, src_ip The transaction command lets you *glue* data sources together! ** be aware, it’s expensive ** (stats will help with this later!) The below search, is interesting, but not useful.. it’s still got a lot of noise index=os src_ip=* OR addr=* | transaction addr, src_ip | search type=USER_LOGIN | table id, addr, exe Passing it through a second search, change the formating to a table cleans it up
your new best friend! Stats speeds up all the things! Running stats performs the operations on the *indexers* then passed back the results for processing! (beware my line breaks) index="_internal" source="*metrics.log" per_index_thruput NOT series="_*"|eventstats sum(kb) as Total |eventstats sum(kb) as "KBbySeries" by series | eval percent = (KBbySeries/Total)*100 | stats values(KBbySeries) as Kb, values(percent) as Percent, by series This search lets us run our search on multiple indexers, and let the indexer to all the heavy lifting,
and manipulate fields Match internal/external networks? index=os src_ip=* | eval network=if(cidrmatch( "10.0.0.0/8", src_ip), "internal", "external") | stats count(user) AS count by src_ip, network Dynamically create a url based on some value in the data set? ok! index=os src_ip=* | eval Link="http://map.example.com/?ip=".src_ip | stats dc(src_ip) AS count by src_ip, Link