This is a slide deck (for public release) from a tech talk I gave at Lookout on R and a light introduction to unsupervised learning through k-means clustering.
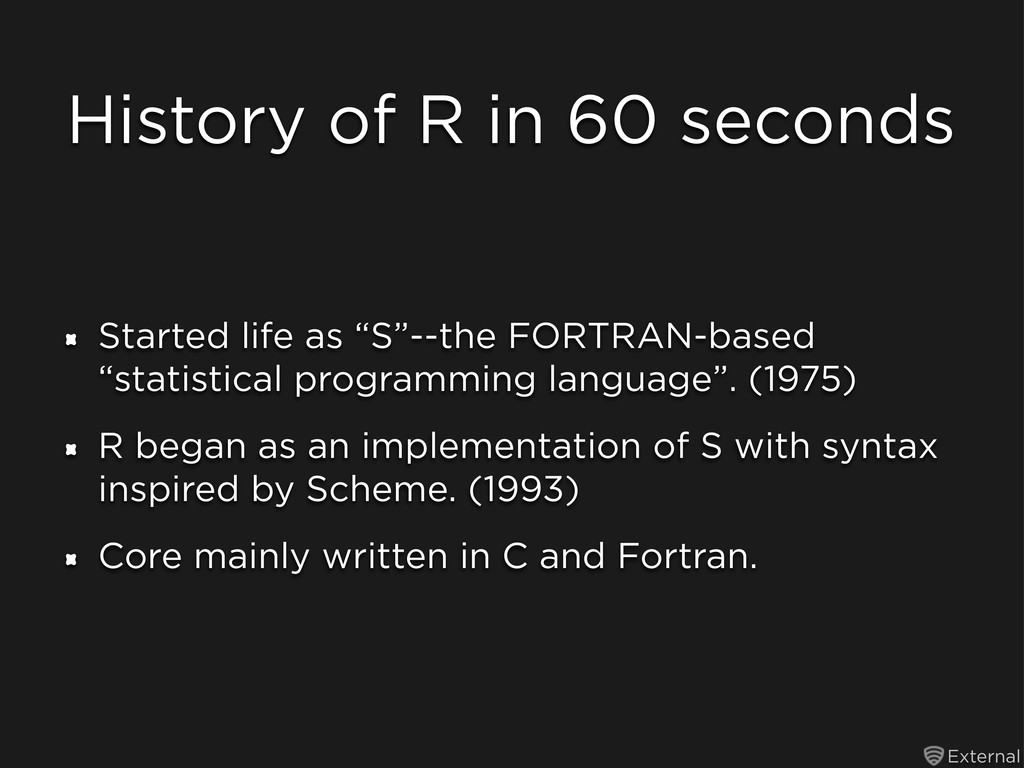
“S”--the FORTRAN-based “statistical programming language”. (1975) R began as an implementation of S with syntax inspired by Scheme. (1993) Core mainly written in C and Fortran.
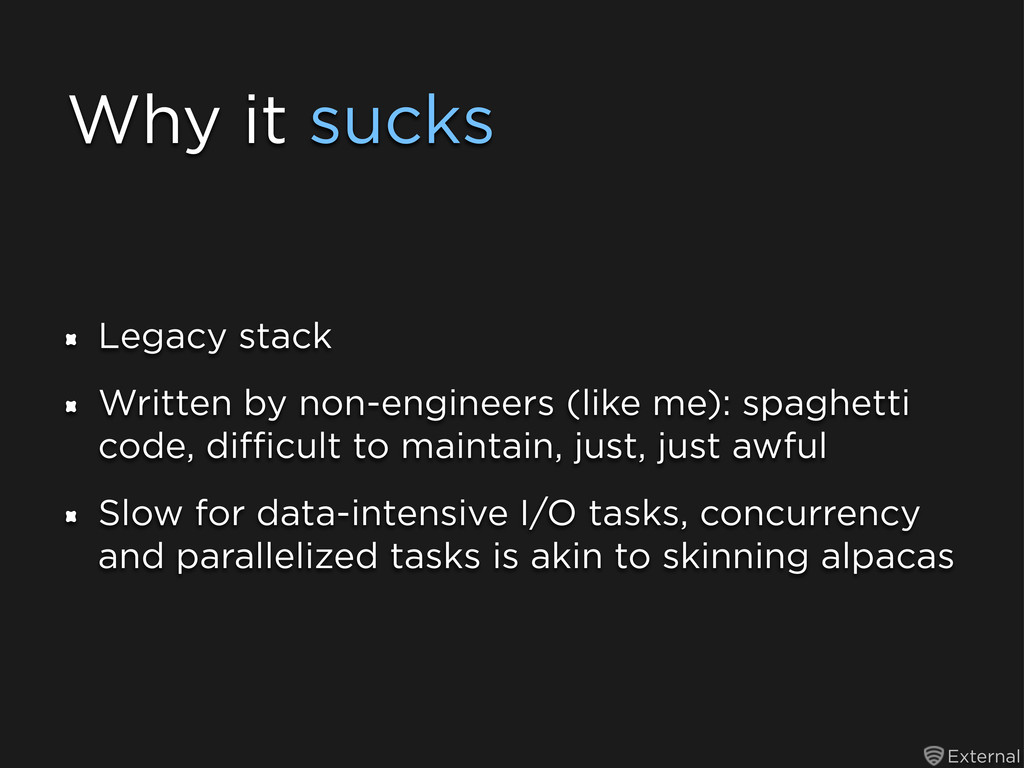
me): spaghetti code, difficult to maintain, just, just awful Slow for data-intensive I/O tasks, concurrency and parallelized tasks is akin to skinning alpacas
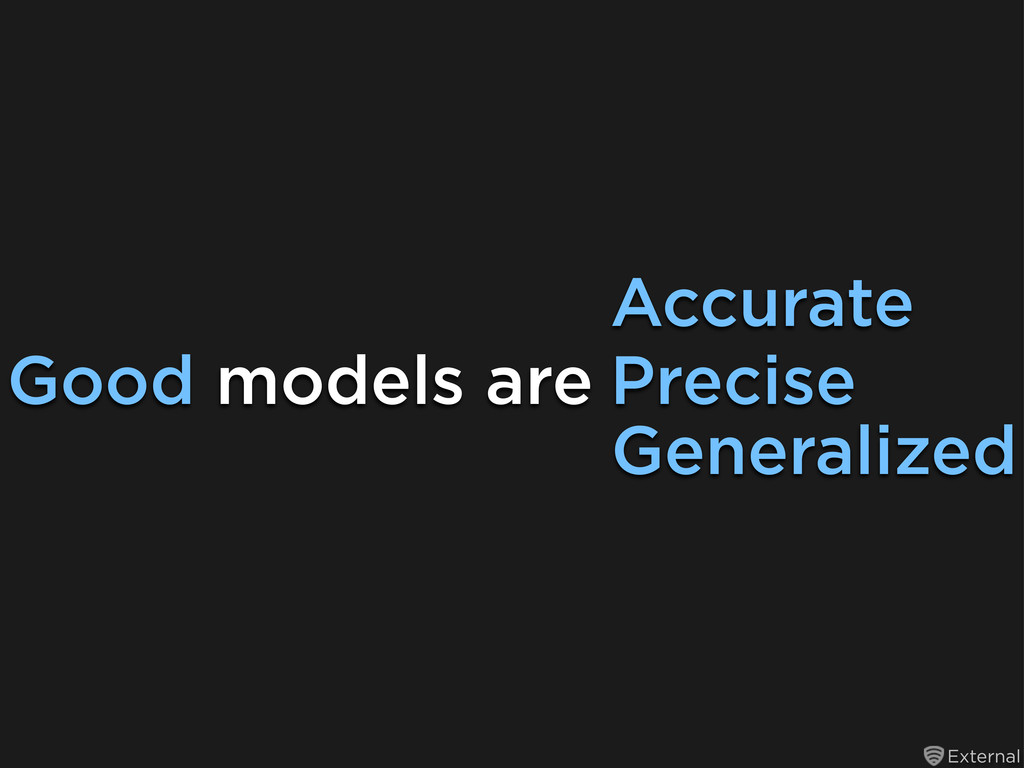
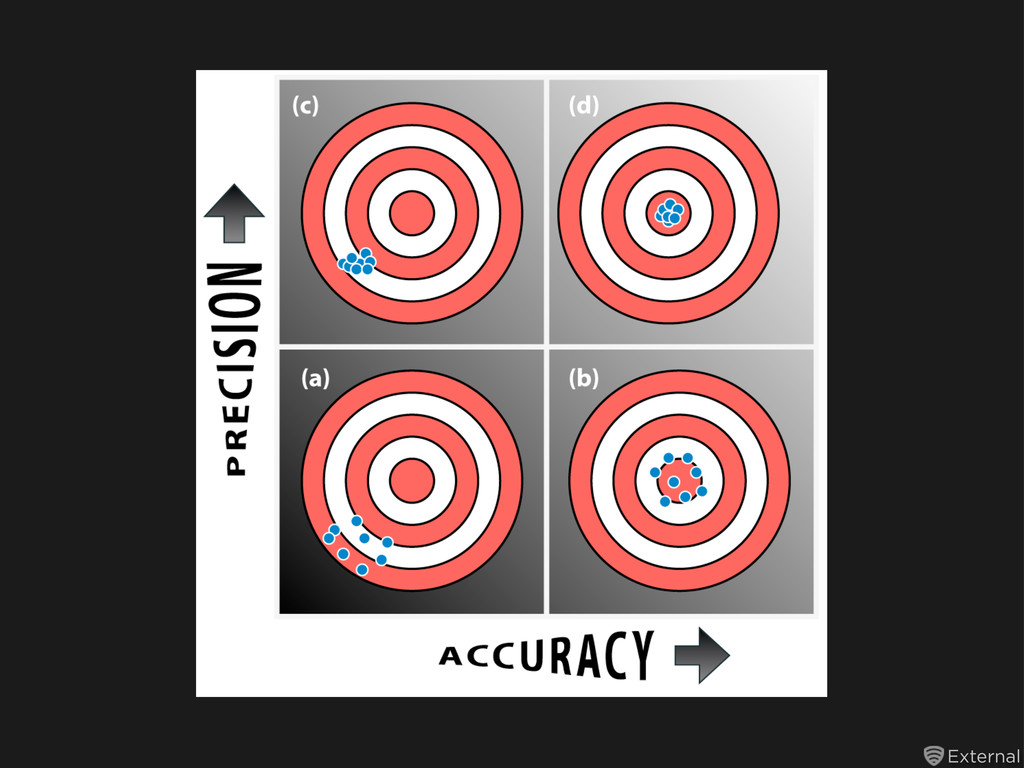
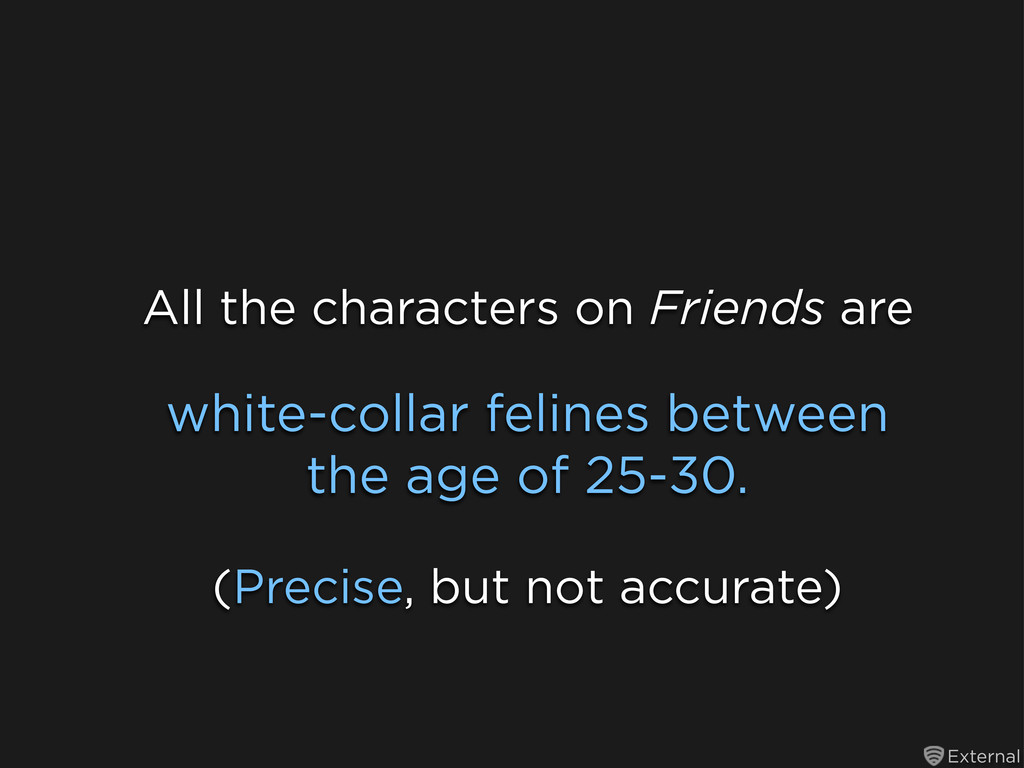
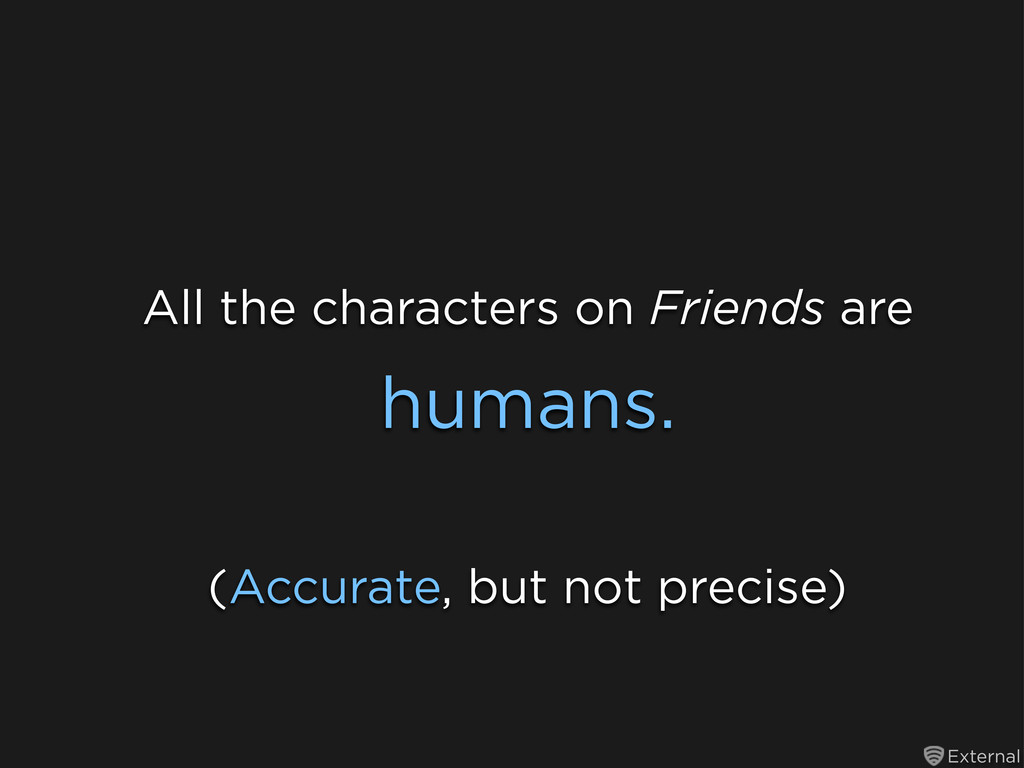
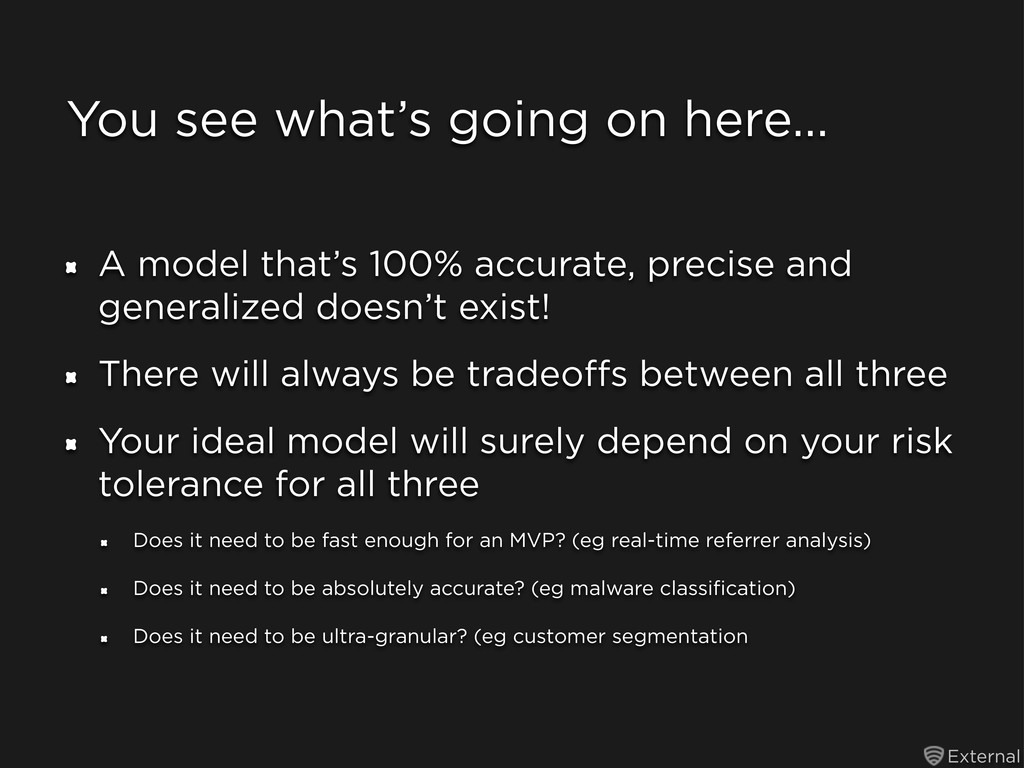
100% accurate, precise and generalized doesn’t exist! There will always be tradeoffs between all three Your ideal model will surely depend on your risk tolerance for all three Does it need to be fast enough for an MVP? (eg real-time referrer analysis) Does it need to be absolutely accurate? (eg malware classification) Does it need to be ultra-granular? (eg customer segmentation
![External K-means in R (three steps) library(caret) data(iris) kmeans(iris[,-c(“species”)], iris[,”species”],](https://files.speakerdeck.com/presentations/4f3d598d5227d2001f000751/slide_32.jpg)