a data-driven company is ‣ A look into a workflow of how a data scientist works ‣ An example case study of how data science adds value ‣ Resources on where to go after this talk
out what makes a company successful • Align entire company goals and roadmap around these KPIs • Examples: Daily revenue, DAU/MAUs, Average Revenue Per User, Time spent on site, Site Uptime, etc.
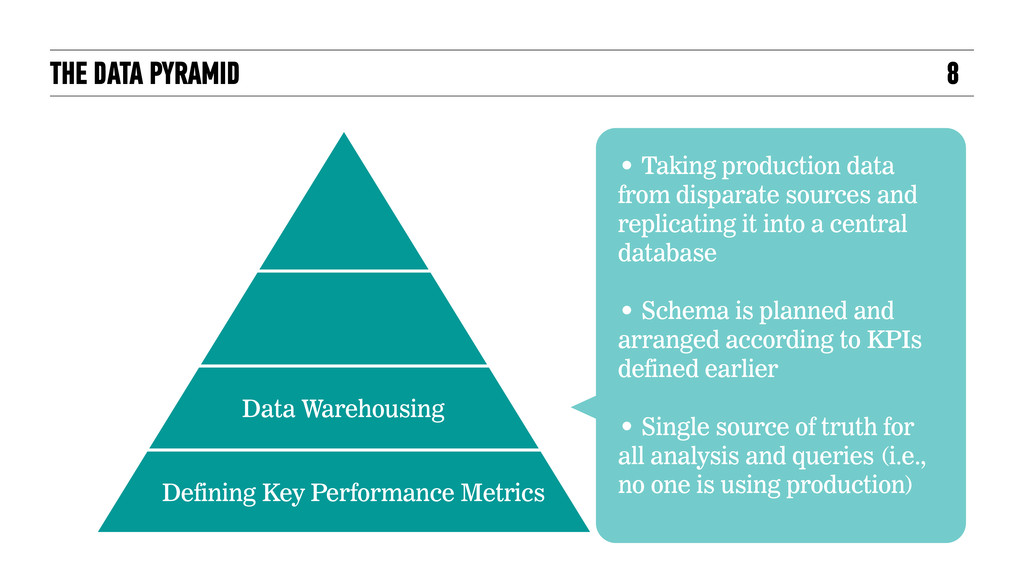
from disparate sources and replicating it into a central database • Schema is planned and arranged according to KPIs defined earlier • Single source of truth for all analysis and queries (i.e., no one is using production) Defining Key Performance Metrics
warehouse, we can create KPI reports for nontechnical stakeholders (marketing, C-levels, board members, etc.) • We can also analyze certain metrics and tables and make hypotheses about specific trends in our data. Defining Key Performance Metrics Analytics and BI
features and variables from our hypotheses and using machine learning, we can write algorithms and models to: • Explain the past, or • Predict the future. • These models can be user- facing (product features), or internal. Defining Key Performance Metrics Analytics and BI Data Science
• Acquire - Where does the data come from? • Parse - How do we preprocess the data? • Filter - How do we transform the data? • Mine - What machine learning algorithms can we use? • Represent - How can we visualize our results? • Refine - How can we take feedback to make it more accurate? • Interact - How will this make the end-user’s life better? Source: CMU
a model that predicts the probability that a user on our website will sign a petition? Can we use this model to predict the probability for future actions (petitions and pledges?) We want to use our massive amounts of data to create a probability that someone will sign a petition or take a pledge on causes.com. We’ll be looking at a specific petition on Causes as our target petition. Our dataset will consist of users who have either signed the petition or have not signed the petition, along with their features (age, gender, number of actions taken, etc.) CAUSES 22
SQL databases Data Warehousing Defining Key Performance Metrics Analytics and BI Data Science ‣ Our user data and FB likes are gathered from FBConnect, which is required for all Causes users ‣ Location data is gathered from a user’s IP address while they are on our site. ‣ When a user signs the petition, we record it in a database consisting of action_credits. 60.34.92.5
SQL databases ETL scripts Analytics DB (Data Warehouse) Data Warehousing Defining Key Performance Metrics Analytics and BI Data Science ‣ Our production data is stored in horizontally sharded databases in MySQL ‣ We extract the relevant data from these individual production databases, ‣ then transform the data to fit a certain schema, ‣ and finally we load the data into a central analytics DB.
plots all of its values in a symmetrical fashion ‣ Most of the results are situated around the probability's mean (the center) ‣ Values are equally likely to plot either above or below the mean. ‣ Grouping takes place at values that are close to the mean and then tails off symmetrically away from the mean. PRIMER ON NORMAL DISTRIBUTION
Metrics Analytics and BI Data Science ‣ We’ll want to normalize certain features (that is, transform variables to represent a normal distribution) ‣ The top two plots represent Causes users and a QQ-distribution ‣ We took the log(age) and got closer to a normal distribution (bottom two plots).
Metrics Analytics and BI Data Science id user_id target_user_id action_id age is_female is_vet is_south created_at signed_petition 1 13215827 NULL 5390823 19 0 1 1 28-nov-2012 1 2 1614524 120583933 5390823 25 1 1 0 28-nov-2012 1 3 11058392 NULL 6729301 29 1 0 0 28-nov-2012 0 4 9529371 168920339 8950132 28 0 0 1 28-nov-2012 0 5 10385293 NULL 5390823 24 1 1 1 28-nov-2012 1 ‣ This is a subset of the total number of columns we have in our dataset. ‣ The actual dataset has approximately 110 columns, representing either a demographic feature (age, gender, location), or a psychographic/behavioral feature (is a veteran, number of petitions signed on Causes, number of related FB likes)
Metrics Analytics and BI Data Science id user_id target_user_id action_id age is_female is_vet is_south created_at signed_petition 1 13215827 NULL 5390823 19 0 1 1 28-nov-2012 1 2 1614524 120583933 5390823 25 1 1 0 28-nov-2012 1 3 11058392 NULL 6729301 29 1 0 0 28-nov-2012 0 4 9529371 168920339 8950132 28 0 0 1 28-nov-2012 0 5 10385293 NULL 5390823 24 1 1 1 28-nov-2012 1 ‣ This is a subset of the total number of columns we have in our dataset. ‣ The actual dataset has approximately 110 columns, representing either a demographic feature (age, gender, location), or a psychographic/behavioral feature (is a veteran, number of petitions signed on Causes, number of related FB likes). For this example, we’ll only use the above features. ‣ Our response variable (the feature we’re predicting) is whether or not they signed the actual petition.
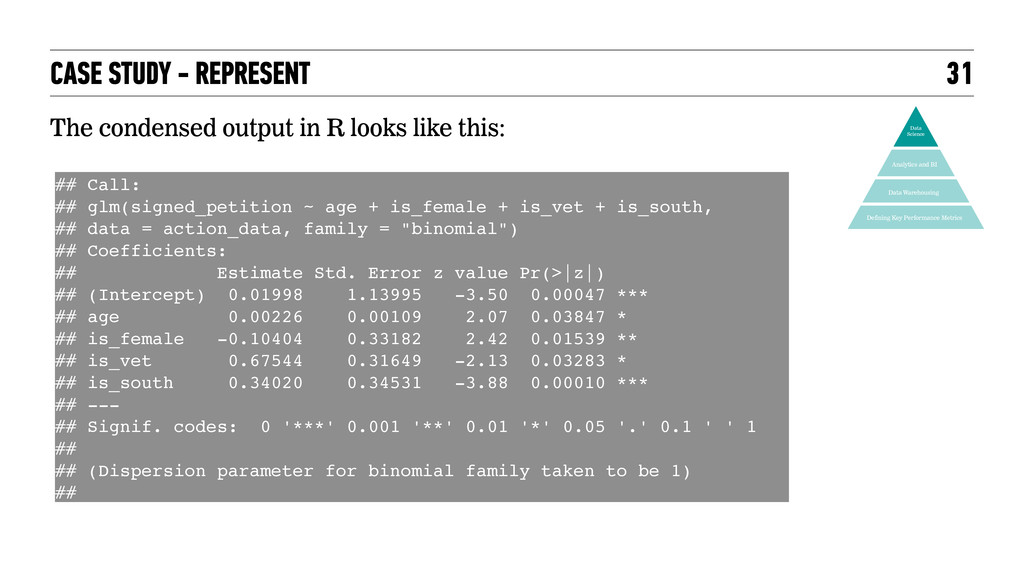
Metrics Analytics and BI Data Science We’ll be using a logistic regression to calculate this probability: action_data = read.csv(“actions.csv”) logit_model = glm(signed_petition ~ age + is_female is_vet + is_south, data = action_data, family = "binomial") In R:
Metrics Analytics and BI Data Science id user_id signed_ petition predicted_ probability 1 13215827 1 0.852 2 1614524 1 0.931 3 11058392 0 0.394 4 9529371 0 0.485 5 10385293 1 0.729 ‣ Our result is an associated probability with each user_id in our dataset ‣ We can use these probabilities to try and create a user facing product that will result in more signatures, and more site activity.
Metrics Analytics and BI Data Science Based on the results of these e-mail blasts, we can refine and improve our logistic regression as necessary: And the cycle continues until we’ve achieved some set benchmark for success.
people were admitted into the hospital last year • Of these 71 million people, 11 million of them were classified as “unnecessary”, resulting in $30bn in unnecessary expenditure. •The majority (83%) of these admissions were made by GPs and Managed Care Organizations.
people were admitted into the hospital last year • Of these 71 million people, 11 million of them were classified as “unnecessary”, resulting in $30bn in unnecessary expenditure. •The majority (83%) of these admissions were made by GPs and Managed Care Organizations. Is there a data-driven approach that GPs can use to assist their diagnoses and decrease false positives?