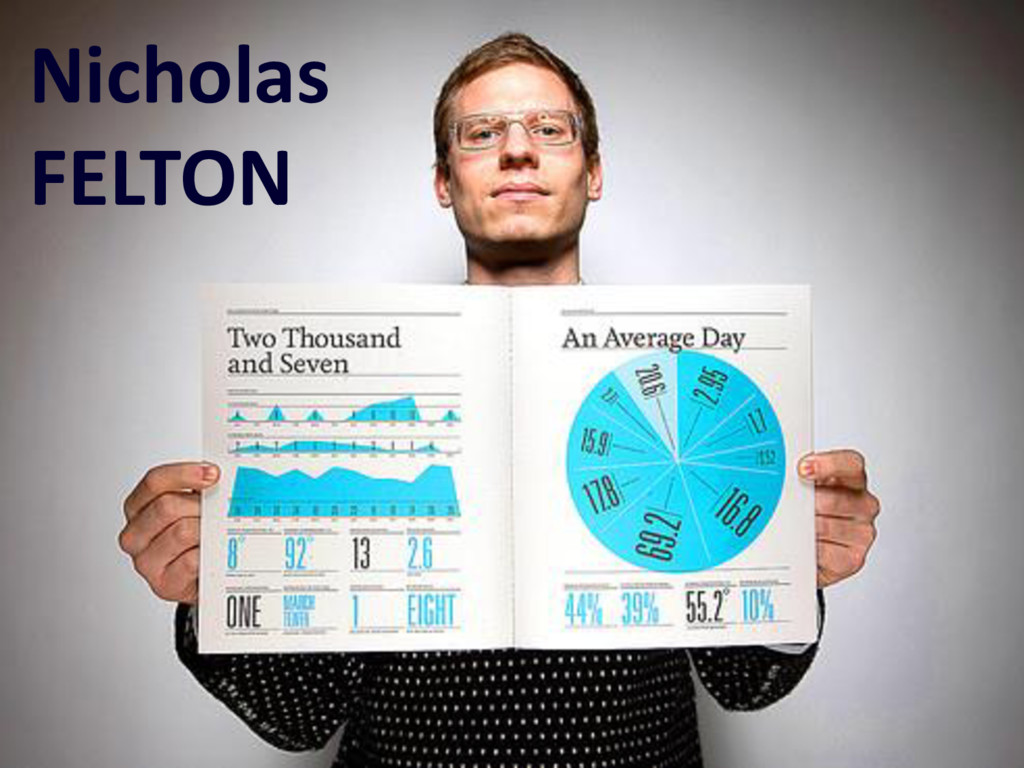
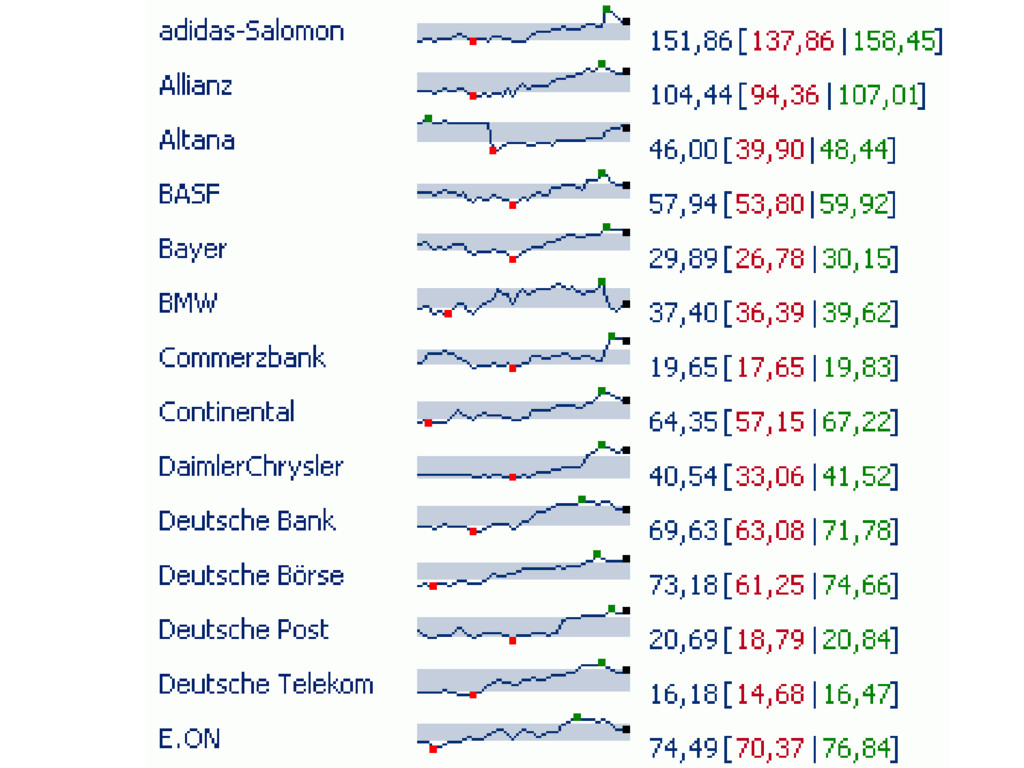
who combines the skill of software programmer, statistician, and story teller/artist to extract the nuggets of gold hidden under mountains of data. -Hal Varian, Chief Economist @ Google
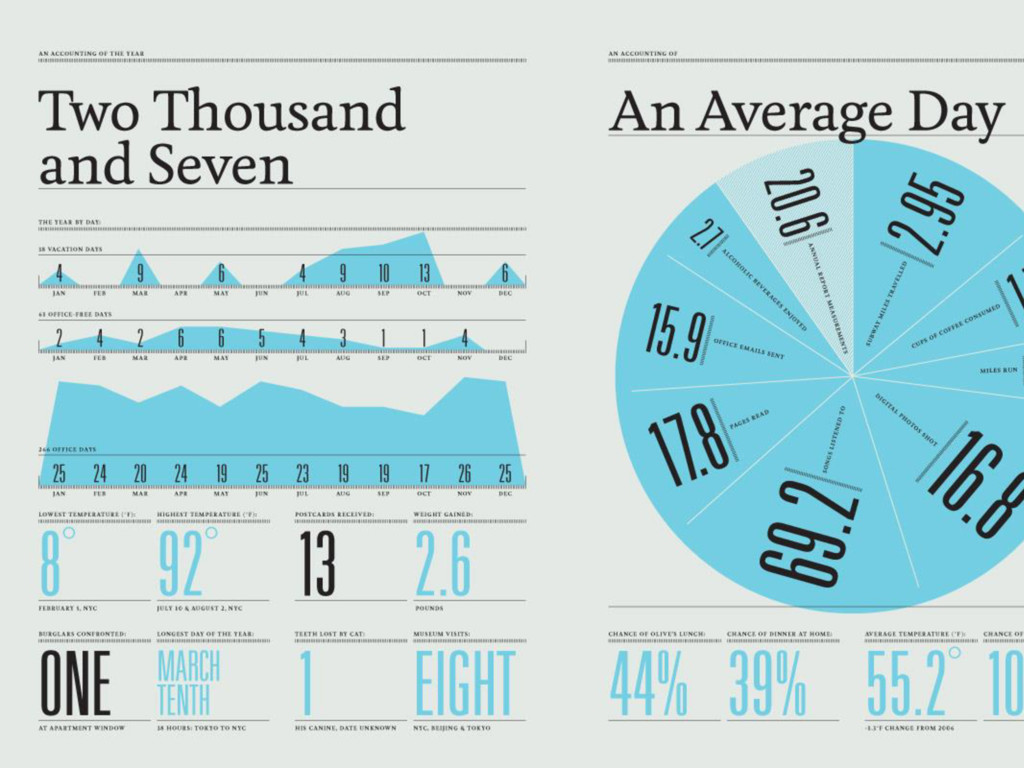
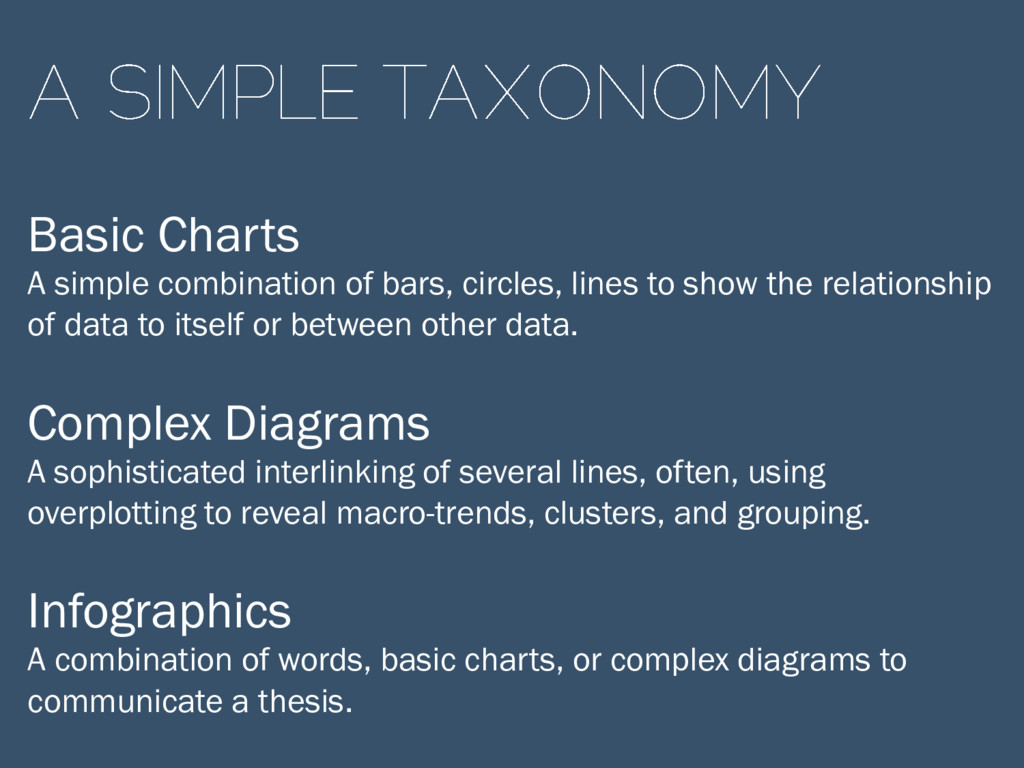
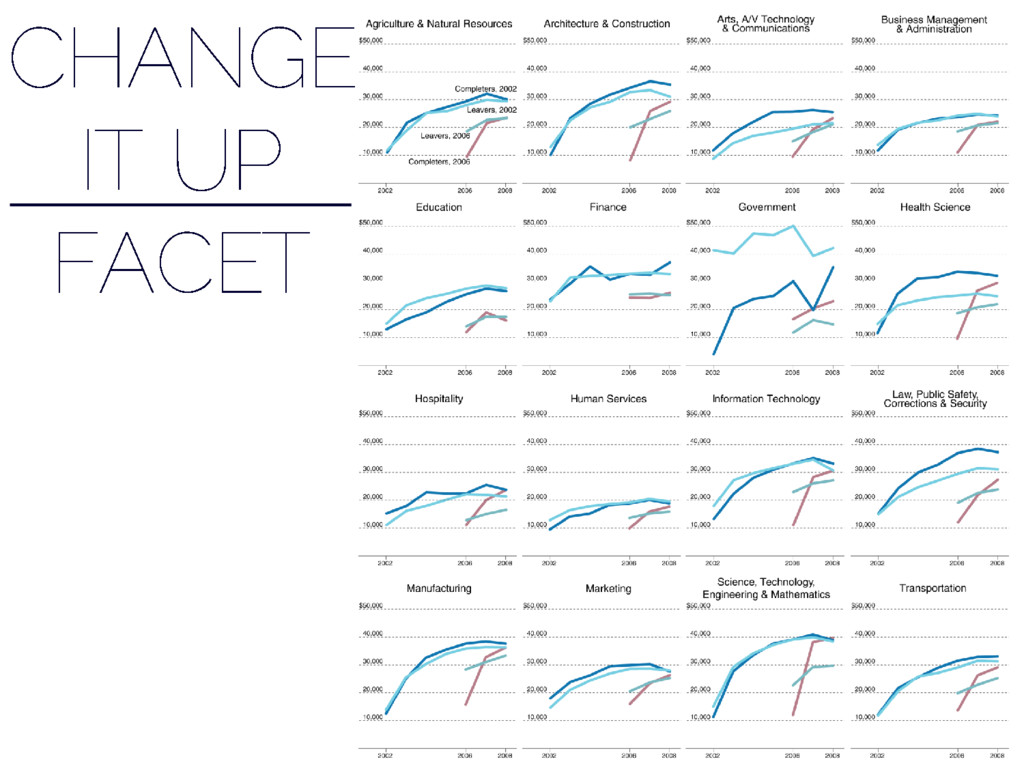
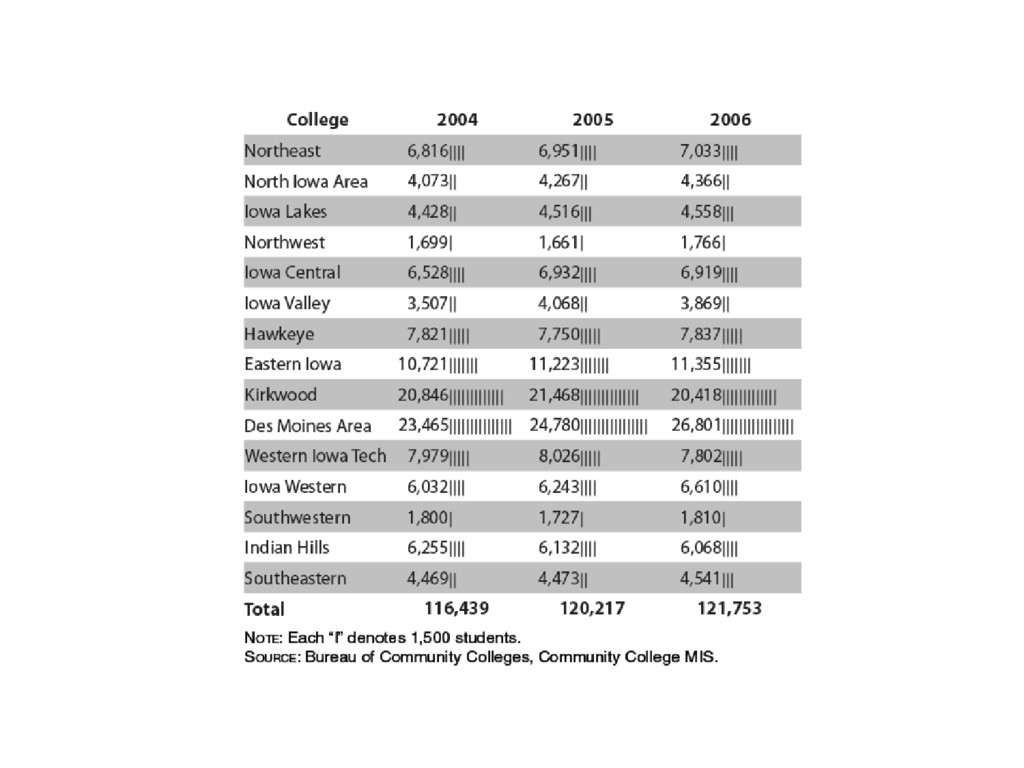
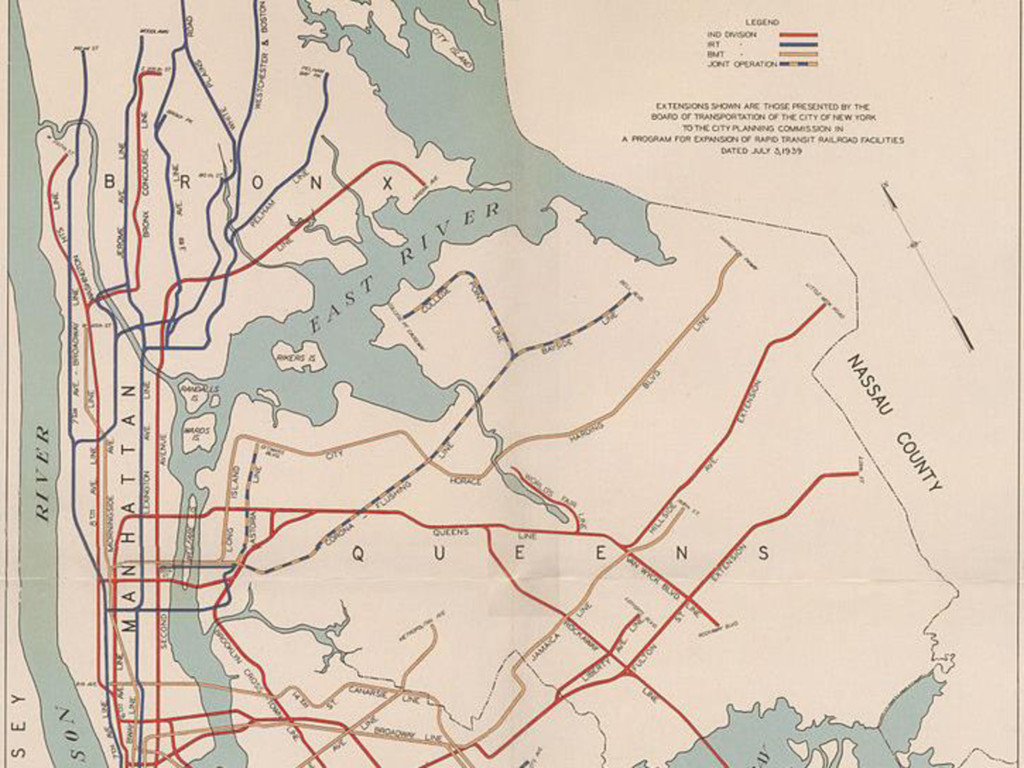
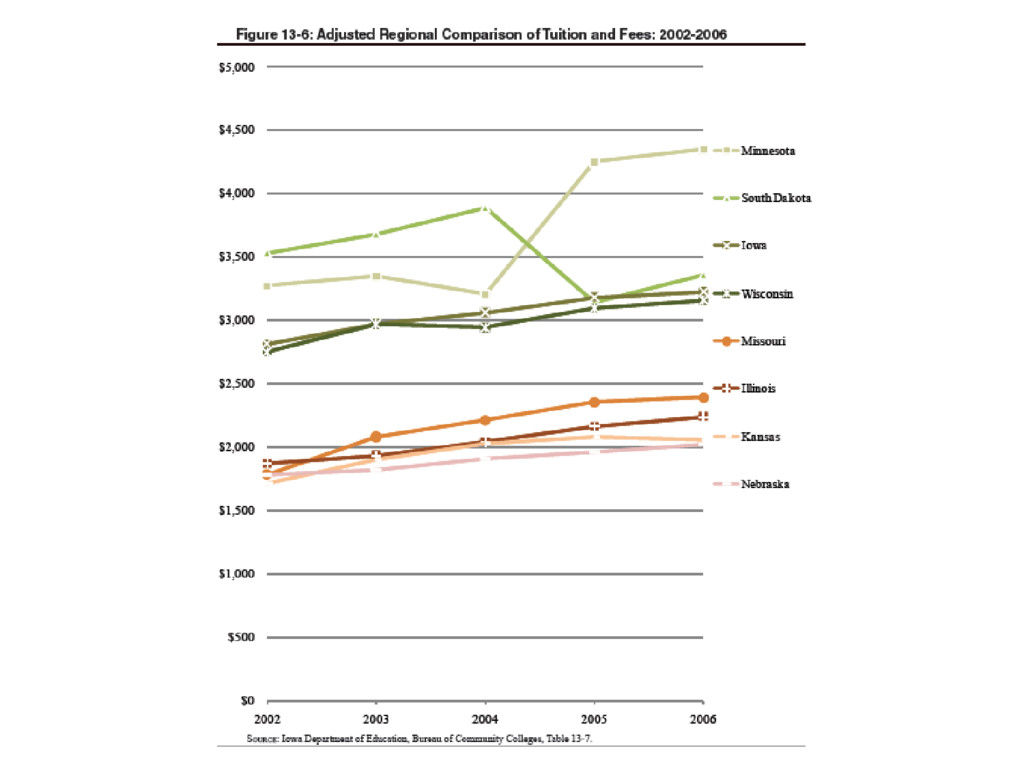
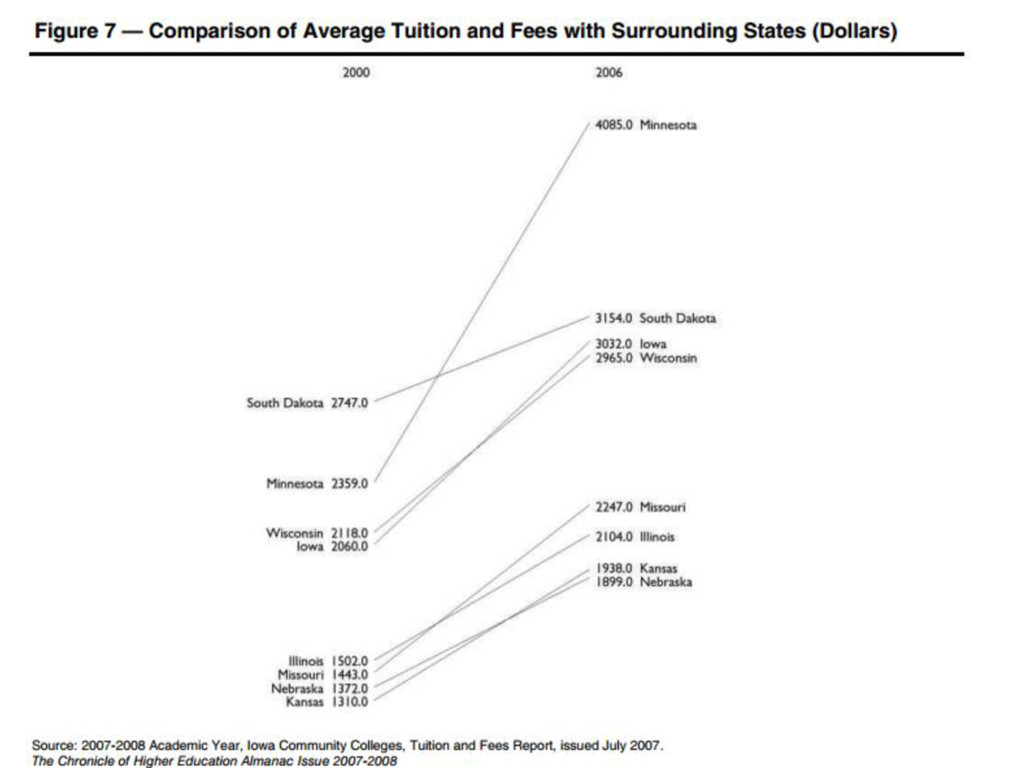
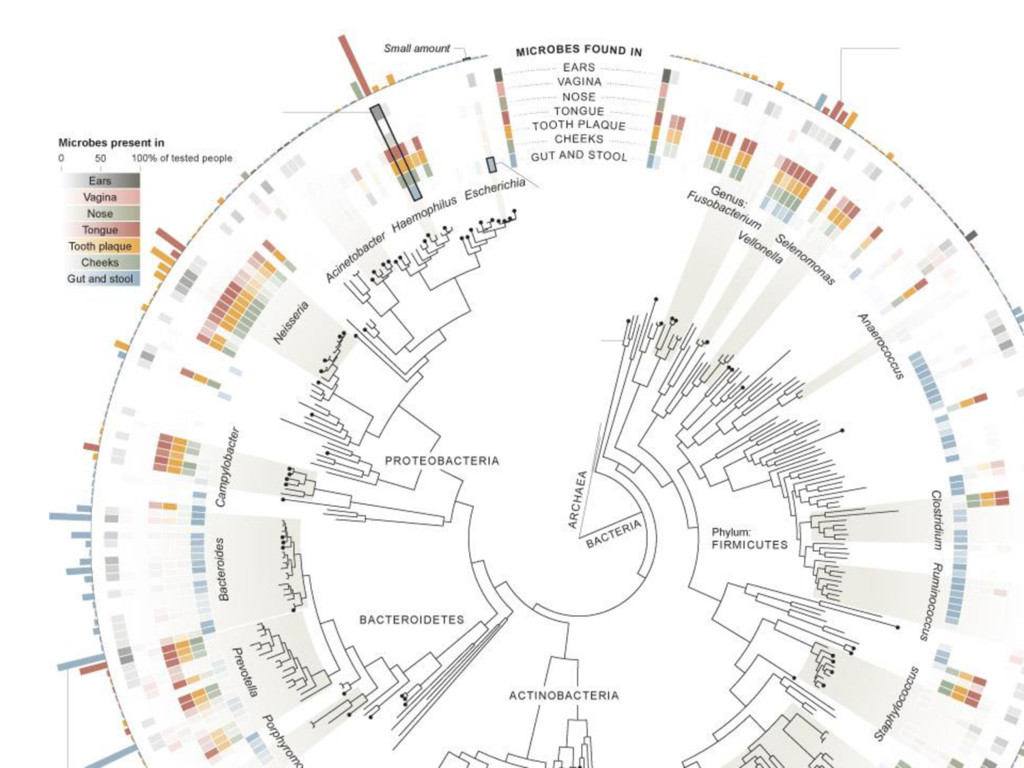
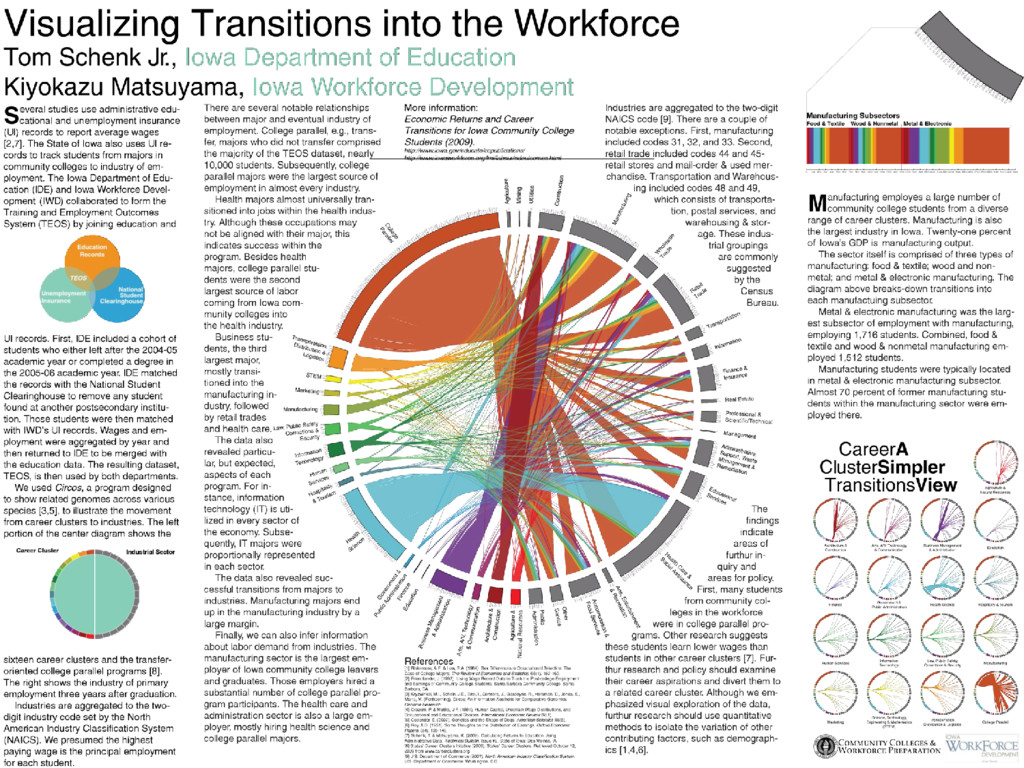
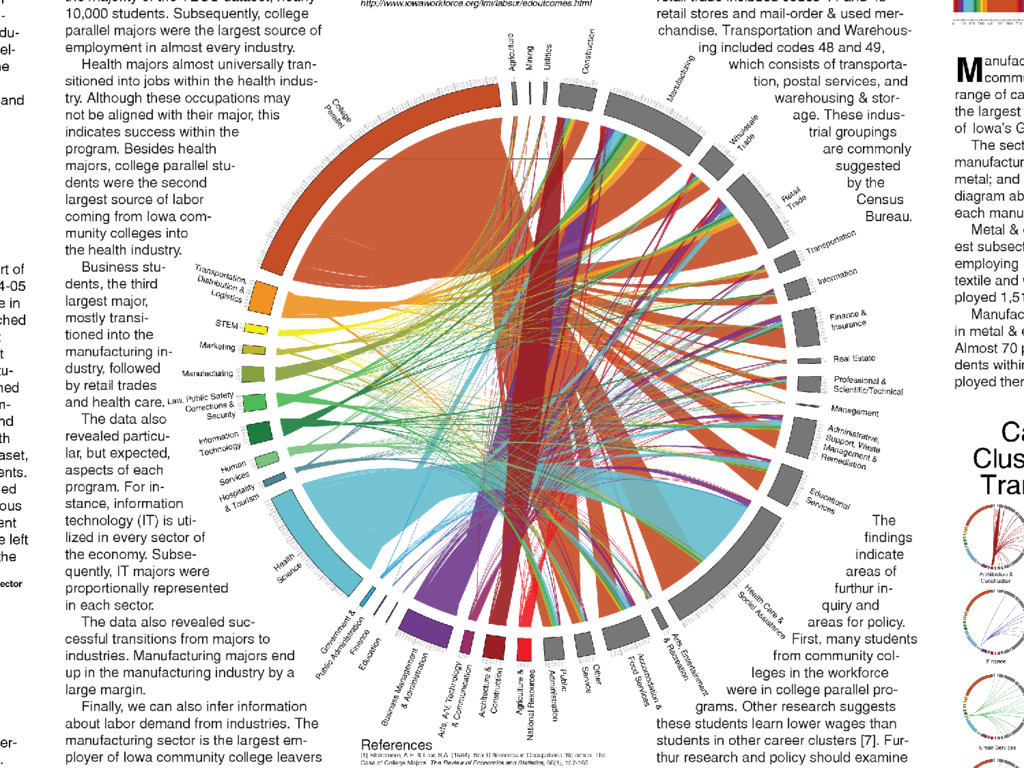
show the relationship of data to itself or between other data. Complex Diagrams A sophisticated interlinking of several lines, often, using overplotting to reveal macro-trends, clusters, and grouping. Infographics A combination of words, basic charts, or complex diagrams to communicate a thesis.
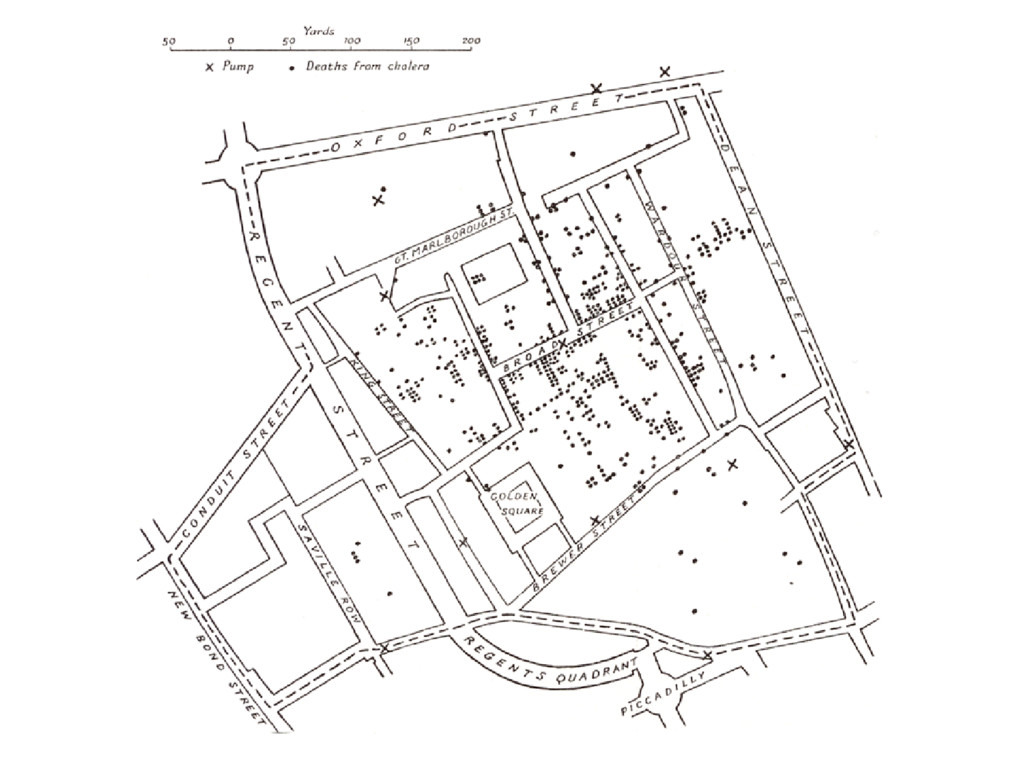
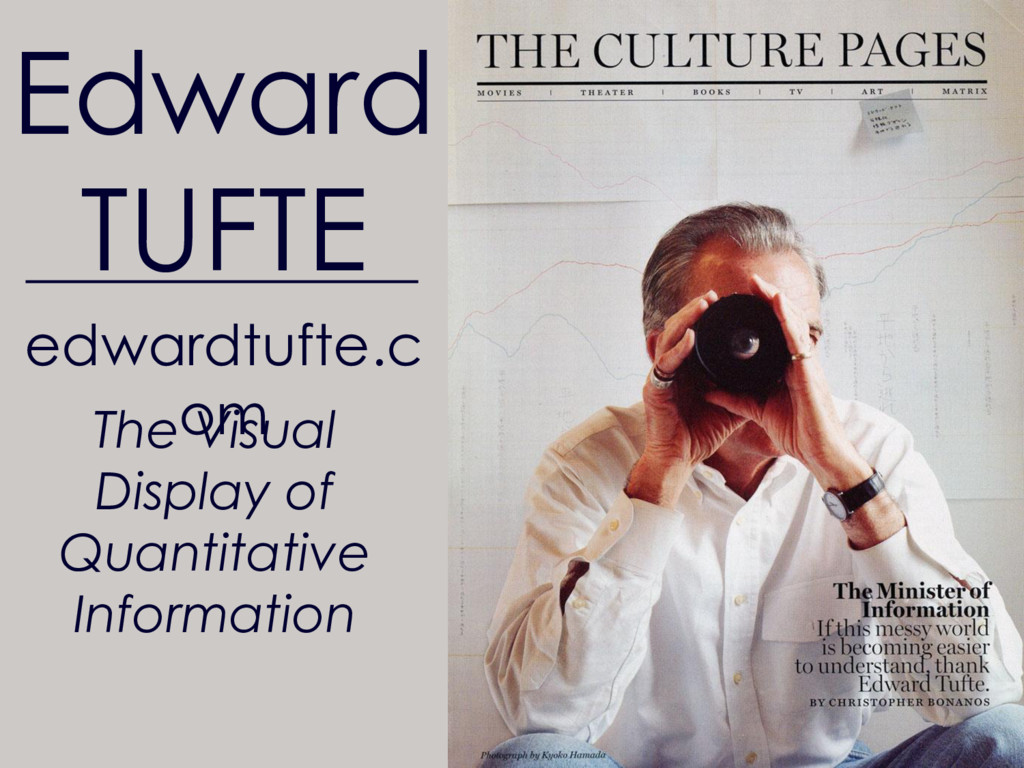
![[A] new kind of professional has emerged, the data scientist,](https://files.speakerdeck.com/presentations/ca4f55fe424a4b33a252ec3cae4e3a67/slide_2.jpg)