Upgrade to Pro — share decks privately, control downloads, hide ads and more …

Data Ecosystem

Tom Schenk Jr
October 15, 2015

Data Ecosystem

Presented at #OECD5WF at Guadalajara, Mexico on 2015-10-15

Tom Schenk Jr

October 15, 2015
Tweet

More Decks by Tom Schenk Jr

Other Decks in Research

Transcript

  1. DATA ECOSYSTEM
    DATA ECOSYSTEM
    O P E N D ATA A S A B R I D G E T O B U I L D A D ATA E C O S Y S T E M
    T O D E L I V E R S E R V I C E T O R E S I D E N T S
    O P E N D ATA A S A B R I D G E T O B U I L D A D ATA E C O S Y S T E M
    T O D E L I V E R S E R V I C E T O R E S I D E N T S
    @CHICAGOCDO
    @CHICAGOCDO

    View Slide

  2. CHICAGO’S DATA SCIENCE TEAM
    DATABASES
    ADVANCED
    ANALYTICS
    f(x)
    OPEN DATA
    BUSINESS
    INTELLIGENCE

    View Slide

  3. data.cityofchicago.org
    Chicago’s open data portal provides almost 600 datasets that are updated on a
    daily basis, ranging from crimes to the quality of water on beaches.

    View Slide

  4. data.cityofchicago.org/view/caas-knxs
    Chicago has released more data, including important items such as red light
    and speed camera violations, problem landlords, and public chauffeurs.

    View Slide

  5. OPEN DATA PROVIDES A MEANS
    TO CREATE AN ECOSYSTEM
    AROUND DATA, WHICH
    INCLUDES MULTIPLE
    STAKEHOLDERS AND
    INITIATIVES THAT EXTEND
    BEYOND TRANSPARENCY.

    View Slide

  6. DATOS ABIERTO PROPORCIONA
    UN MEDIO PARA CREAR UN
    ECOSISTEMA ALREDEDOR DE
    DATOS, QUE INCLUYE LOS
    INTERESADOS E INICIATIVAS
    MÚLTIPLES QUE SE EXTIENDA
    MÁS ALLÁ DE TRANSPARENCIA.

    View Slide

  7. “Open data initiatives are an increasingly popular
    component of governance. 
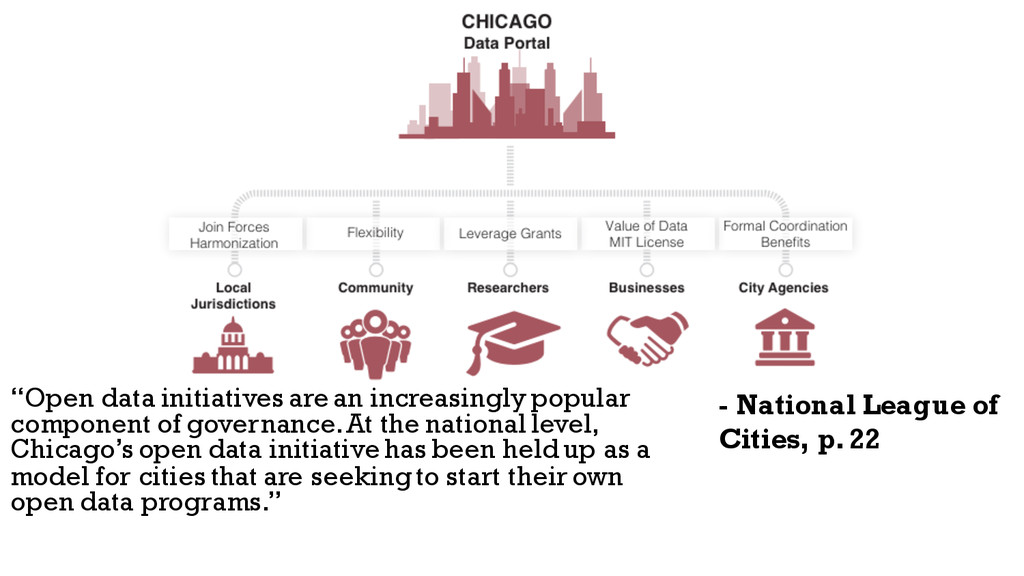
At the national level,
    Chicago’s open data initiative has been held up as a
    model for cities that are seeking to start their own
    open data programs.”
    - National League of
    Cities, p. 22

    View Slide

  8. We released our
    automation
    framework as an
    open-source project
    that can be
    downloaded to
    quickly deploy
    automated updates. It
    can be freely used by
    other governments
    and improvements
    can be submitted.
    ETL Utility Kit
    github.com/Chicago/open-data-etl-utility-kit

    View Slide

  9. Chicago has a large, vibrant, productive, civic
    community. This is 
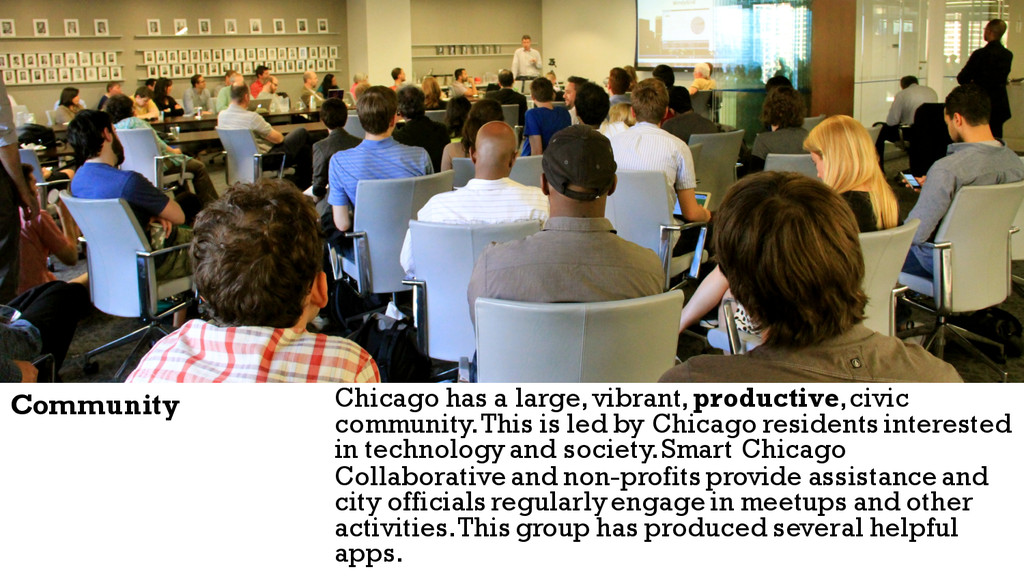
led by Chicago residents interested
    in technology and society. Smart Chicago
    Collaborative and non-profits provide assistance and
    city officials regularly engage in meetups and other
    activities. This group has produced several helpful
    apps.
    Community

    View Slide

  10. THE OPEN DATA PORTAL IS NOT
    SUFFICIENT FOR THE
    COMMUNITY, BUT SERVES AS
    THE TOWN SQUARE FOR A
    COMMUNITY, PROVIDING A
    COMMON TOPIC OF
    CONVERSATION FOR EVERYONE.

    View Slide

  11. LOS DATOS ABIERTOS PORTAL NO
    ES SUFICIENTE PARA LA
    COMUNIDAD, PERO SIRVE COMO
    LA PLAZA DEL PUEBLO PARA UNA
    COMUNIDAD, PROPORCIONANDO
    UN TEMA COMÚN DE
    CONVERSACIÓN PARA TODOS.

    View Slide

  12. View Slide

  13. Using #opendata, this
    service developed by
    the civic community
    alerts individuals to
    street sweeping
    activity by providing
    email, text, or
    calendar alerts.
    sweeparound.us

    View Slide

  14. The City of Chicago
    partnered with
    developers to create
    LargeLots, 
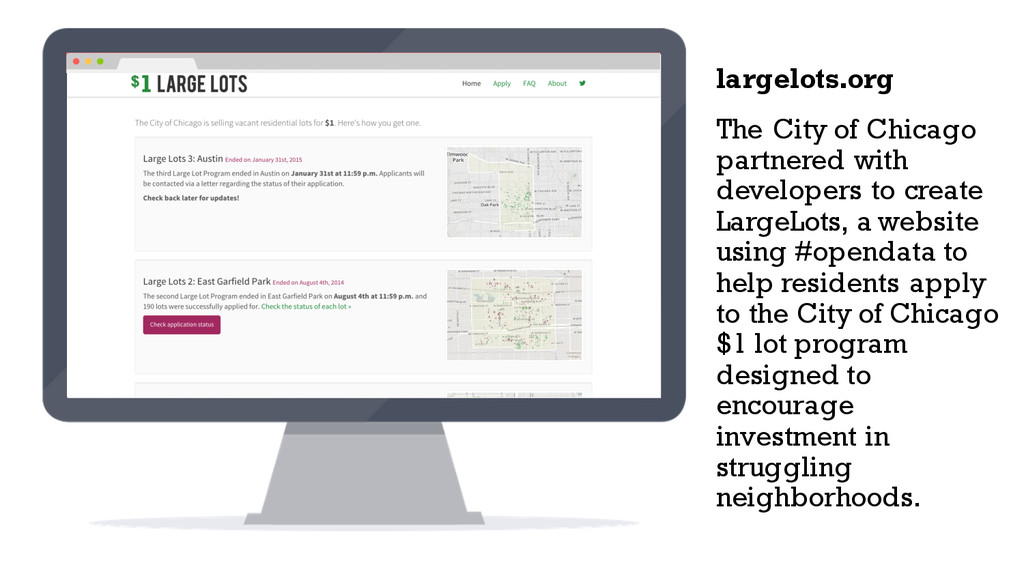
a website
    using #opendata to
    help residents apply
    to the City of Chicago
    $1 lot program
    designed to
    encourage
    investment in
    struggling
    neighborhoods.
    largelots.org

    View Slide

  15. Chicago Flu Shots
    was developed to
    easily find flu-shot
    locations across
    Chicago during the
    fall and winter
    months. This provides
    an easy-to-use central
    website built upon
    open data by a
    volunteer.
    chicagoflushots.org

    View Slide

  16. This site shows the
    work completed by
    city crews and 
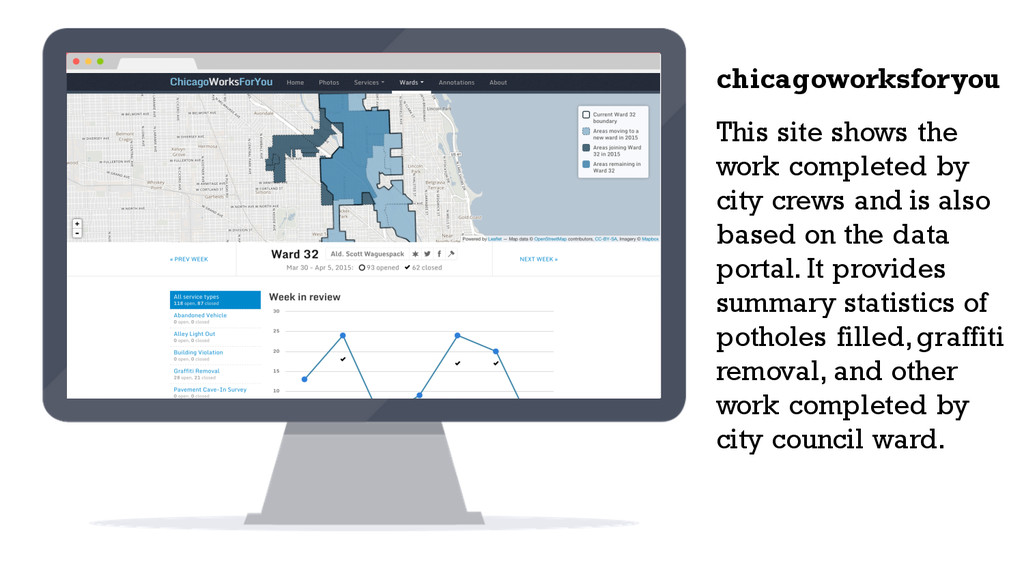
is also
    based on the data
    portal. It provides
    summary statistics of
    potholes filled, graffiti
    removal, and other
    work completed by
    city council ward.
    chicagoworksforyou

    View Slide

  17. OPEN DATA & INTERNET OF THINGS
    University of Chicago has
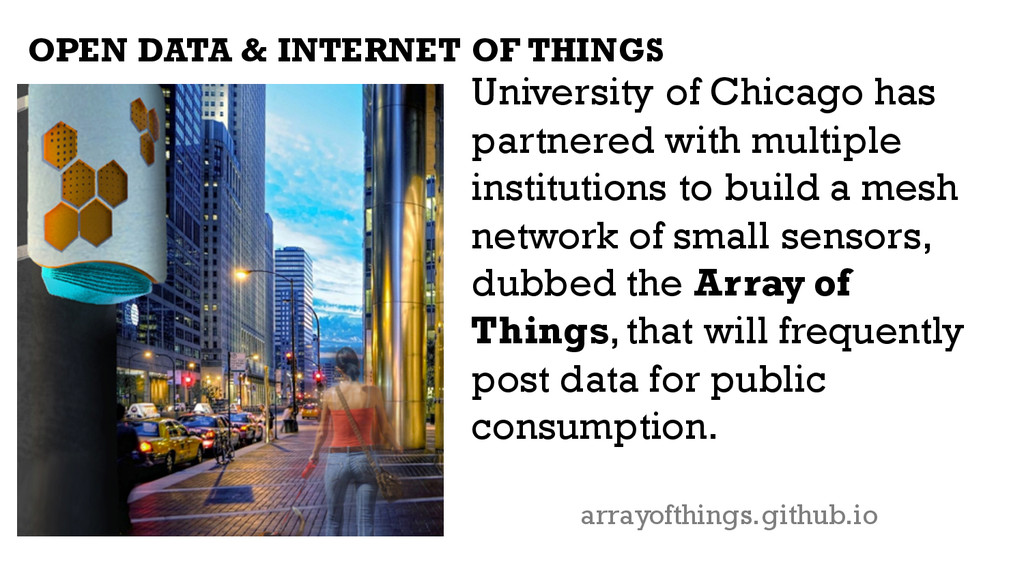
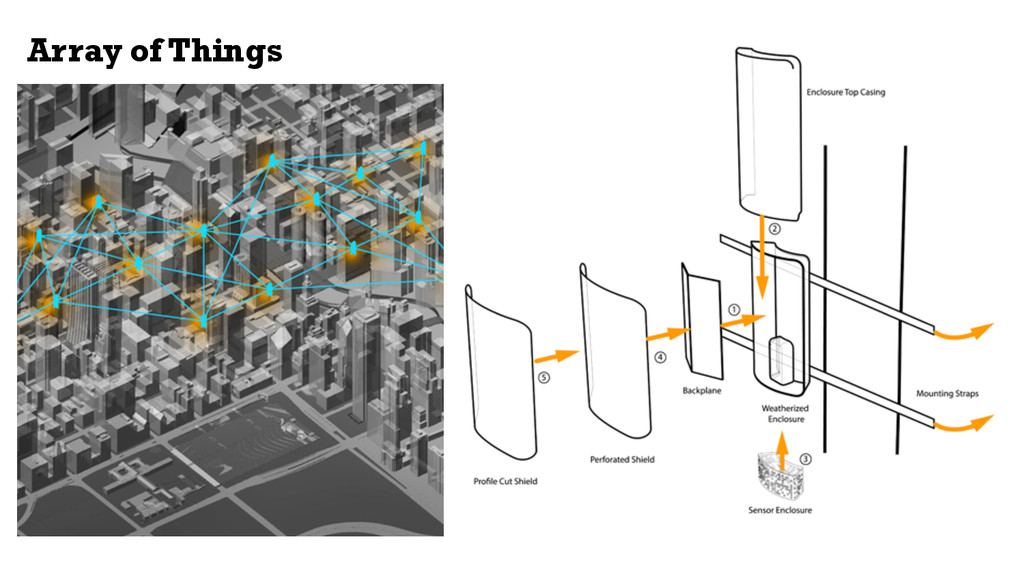
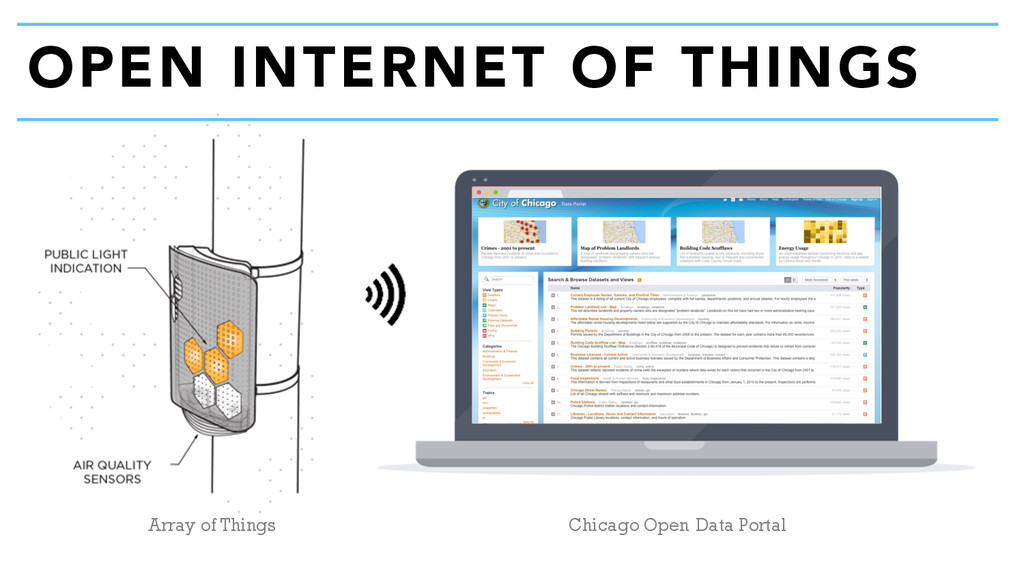
    partnered with multiple
    institutions to build a mesh
    network of small sensors,
    dubbed the Array of
    Things, that will frequently
    post data for public
    consumption.
    arrayofthings.github.io

    View Slide

  18. Array of Things
    The Array of Things will provide hyper-
    local, temporal data on using a variety
    of sensors:
    §Sensors measuring sound and
    vibration
    §Low-resolution infrared cameras
    measuring sidewalk temperature
    §Climate and environmental data,
    such as air-quality and temperature

    View Slide

  19. Array of Things

    View Slide

  20. Array of Things

    View Slide

  21. OPEN INTERNET OF THINGS
    Array of Things Chicago Open Data Portal

    View Slide

  22. Sometimes, the terms
    & conditions were
    onerous for
    companies to 
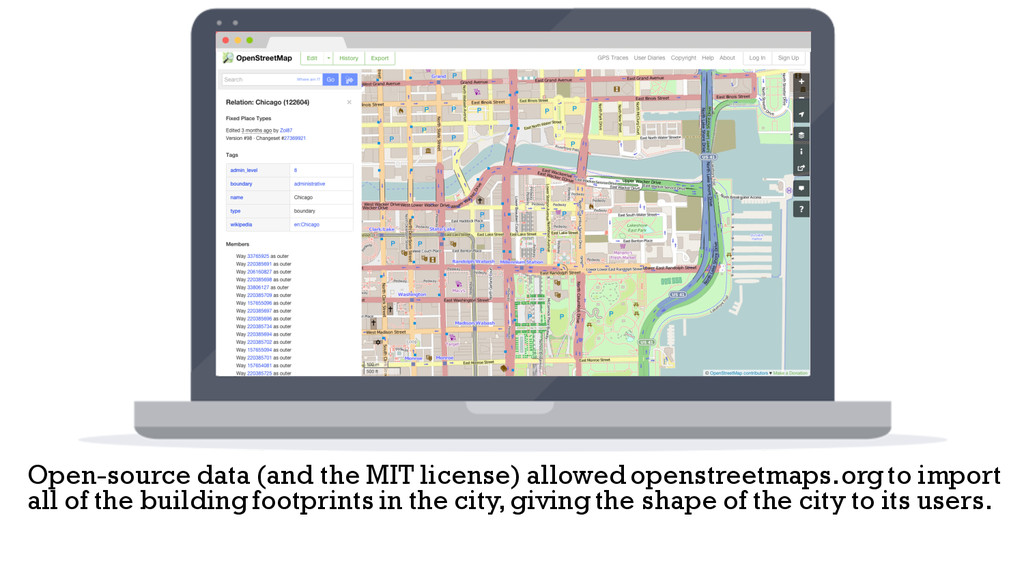
use
    data. Likewise,
    people wanted to
    sometimes correct
    our data. Data posted
    on GitHub can be
    edited by others and
    comes with a
    business-friendly MIT
    license.
    Open-source data
    github.com/Chicago/osd-street-center-line

    View Slide

  23. The open-source approach also lets users submit corrections for data. Like the
    example above, a mistake was found on the data compared to actuality.

    View Slide

  24. Open-source data (and the MIT license) allowed openstreetmaps.org to import
    all of the building footprints in the city, giving the shape of the city to its users.

    View Slide

  25. OPEN DATA, IN ADDITION TO
    OPEN SOURCE LICENSING,
    PROVIDES A PRACTICAL AND
    LEGAL FRAMEWORK TO SHARE
    AND INTERACT WITH THE
    COMMUNITY.

    View Slide

  26. DATOS ABIERTOS, ADEMÁS DE
    ABRIR LICENCIAS FUENTE,
    PROPORCIONA UN MARCO
    PRÁCTICA Y LEGAL PARA
    COMPARTIR Y INTERACTUAR
    CON LA COMUNIDAD.

    View Slide

  27. The City of Chicago
    releases a number of
    open source 
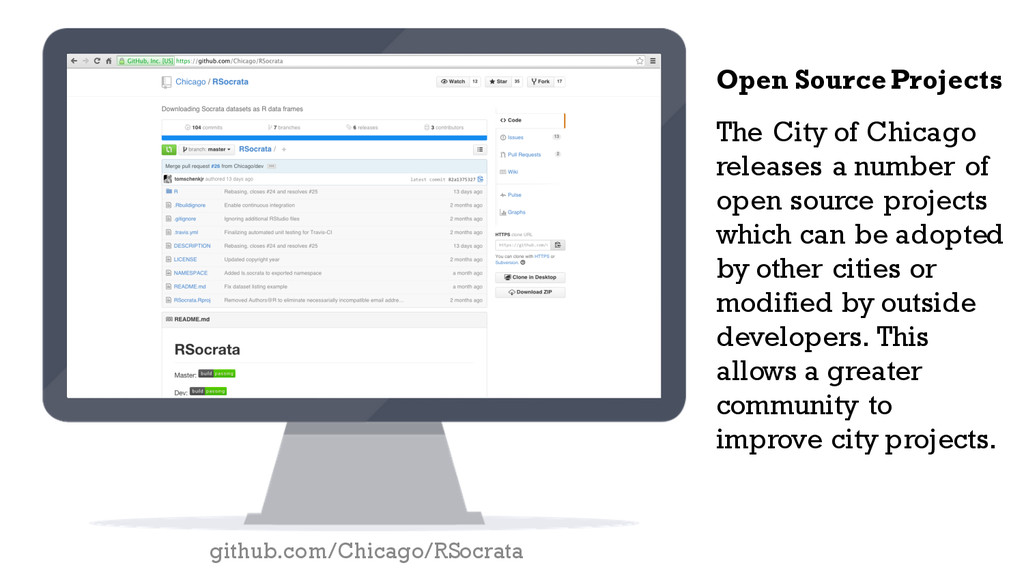
projects
    which can be adopted
    by other cities or
    modified by outside
    developers. This
    allows a greater
    community to
    improve city projects.
    Open Source Projects
    github.com/Chicago/RSocrata

    View Slide

  28. A non-profit which has three primary areas
    of focus under which we organize all of our
    work: Access to the Internet & technology,
    Skills to use technology once you've got
    access, and Data, which we construe as
    something meaningful to look at once you
    have access and skills.

    View Slide

  29. Smart Chicago’s Civic User Testing group provides
    incentives and is 
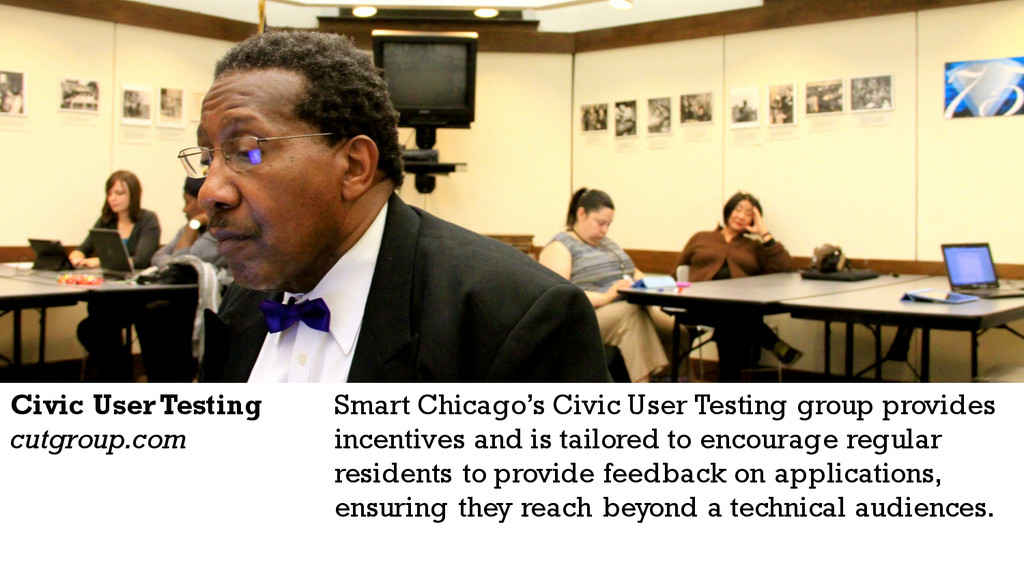
tailored to encourage regular
    residents to provide feedback on applications,
    ensuring they reach beyond a technical audiences.
    Civic User Testing
    cutgroup.com

    View Slide

  30. Smart Chicago Collaborative
    provides developer
    resources and limited free
    hosting of web apps created
    by civic developers.

    View Slide

  31. Hackathons
    Frequently hosted by
    multiple groups,
    helps establish
    networking amongst
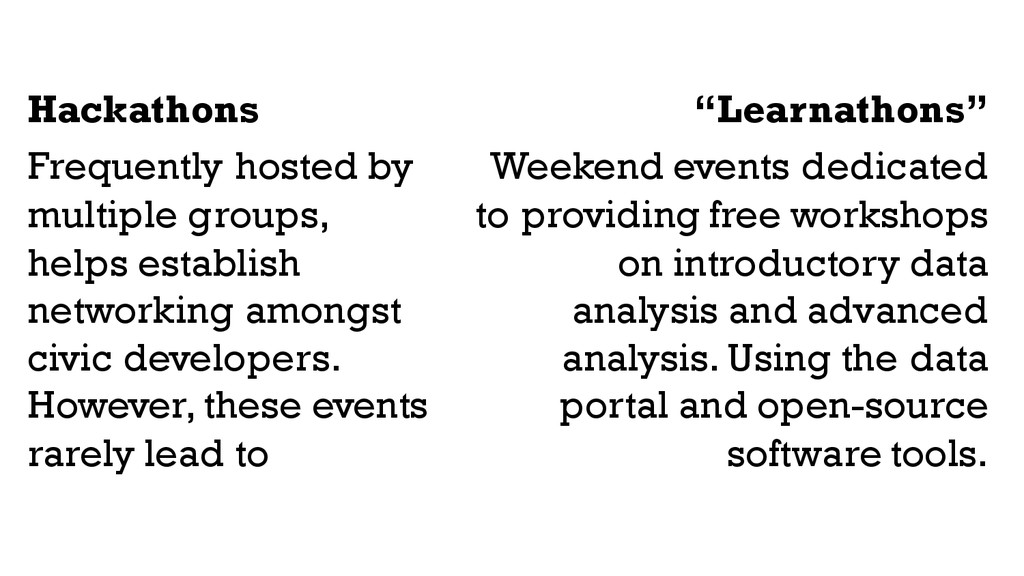
    civic developers.
    However, these events
    rarely lead to
    “Learnathons”
    Weekend events dedicated
    to providing free workshops
    on introductory data
    analysis and advanced
    analysis. Using the data
    portal and open-source
    software tools.

    View Slide

  32. AS GOVERNMENTS REACH OUT
    THROUGH TECHNOLOGY AND
    DATA, WE MUST ALSO PROVIDE
    SUPPORT FOR “DIGITAL
    LITERACY” TO BUILD THE
    NECESSARY SKILLS

    View Slide

  33. COMO LOS GOBIERNOS REACH
    OUT A TRAVÉS DE LA
    TECNOLOGÍA Y DATOS,
    DEBEMOS TAMBIÉN LA
    PROVISIÓN DE APOYO A ”D"
    PARA CONSTRUIR LAS
    HABILIDADES NECESARIAS

    View Slide

  34. Incorporating a data-driven
    practice is contingent on
    leadership, practice, and
    technology. Most cities have
    the technology framework in
    place, it just needs to be
    added.
    REPORTS
    DATABASES
    PORTAL
    ANALYTICS

    View Slide

  35. View Slide

  36. Built using open
    source software,
    WindyGrid is a real-
    time 
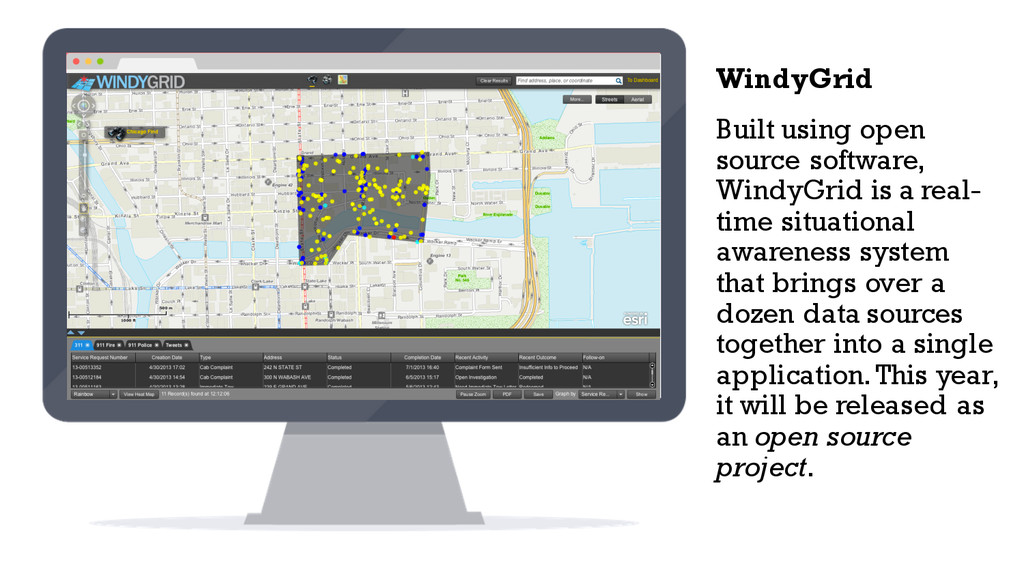
situational
    awareness system
    that brings over a
    dozen data sources
    together into a single
    application. This year,
    it will be released as
    an open source
    project.
    WindyGrid

    View Slide

  37. Chicago uses Twitter
    to “listen” for
    complaints of food
    poisoning. When we
    identify a case, a
    tweet is sent to the
    user and requesting
    the case be reported
    to the city for follow-
    up inspection.
    Food Poisoning

    View Slide

  38. A map of rodent complaints across the city.

    View Slide

  39. View Slide

  40. City of Chicago found 31
    factors that predicted when
    and 
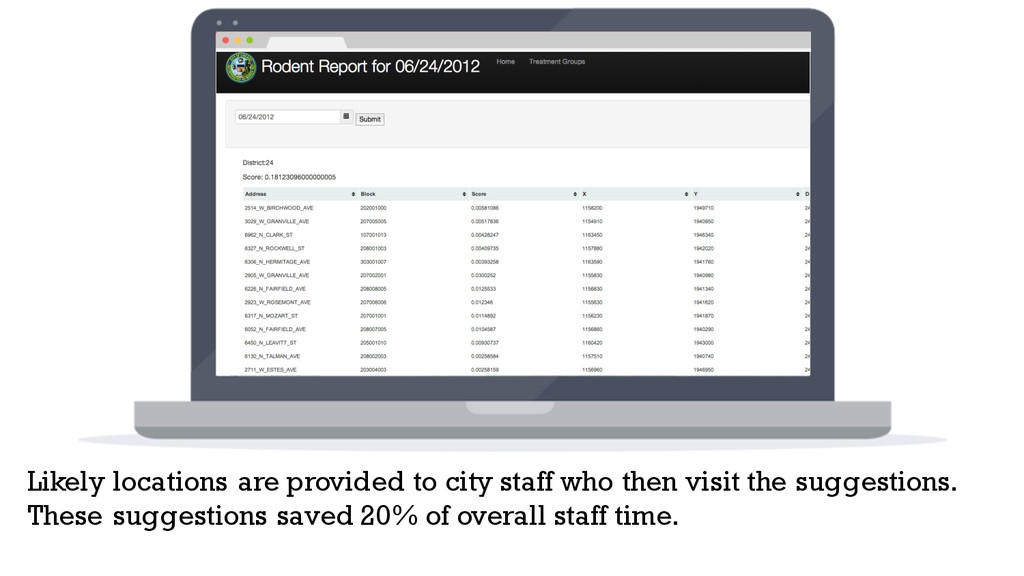
where rodent complaints
    are most likely in the next
    week. We used spatial-
    temporal relationships to
    create these predictions,
    which started as an
    investigation of over 350
    different factors.
    Spatial Correlation
    Temporal Correlation

    View Slide

  41. View Slide

  42. Likely locations are provided to city staff who then visit the suggestions.
    These suggestions saved 20% of overall staff time.

    View Slide

  43. OPTIMIZING FOOD INSPECTIONS

    View Slide

  44. OPTIMIZING FOOD INSPECTIONS

    View Slide

  45. View Slide

  46. 23%
    15%
    11%
    7%
    14%
    Image adapted from Michael Mooney’s Little Chicago (CC-BY 2.0).

    View Slide

  47. #ENGAGEMENT
    The City of Chicago teamed-up with the
    Civic Consulting Alliance and Allstate
    Insurance Company’s data science team to
    help develop the predictive model. Data
    from the open data portal was used to
    develop the model. While other data were
    considered, almost all of the useful data
    was publicly available.

    View Slide

  48. data.cityofchicago.org/view/2bnm-jnvb
    Chicago leveraged
    the open data portal
    to share data with
    external researchers,
    leveraging the city’s
    premiere method of
    sharing data and
    saving time on data-
    sharing agreements.
    #OPENDATA

    View Slide

  49. Restaurants with previous critical
    violations
    Three-day average high temperature
    CDPH 
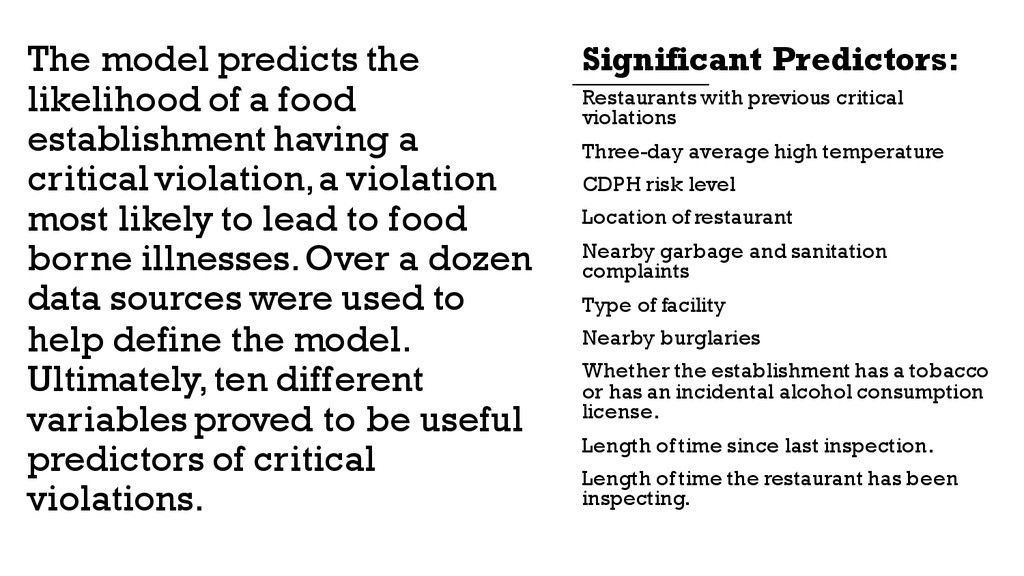
risk level
    Location of restaurant
    Nearby garbage and sanitation
    complaints
    Type of facility
    Nearby burglaries
    Whether the establishment has a tobacco
    or has an incidental alcohol consumption
    license.
    Length of time since last inspection.
    Length of time the restaurant has been
    inspecting.
    The model predicts the
    likelihood of a food
    establishment having a
    critical violation, a violation
    most likely to lead to food
    borne illnesses. Over a dozen
    data sources were used to
    help define the model.
    Ultimately, ten different
    variables proved to be useful
    predictors of critical
    violations.
    Significant Predictors:

    View Slide

  50. Data-driven Status quo
    0%
    10%
    20%
    30%
    40%
    50%
    60%
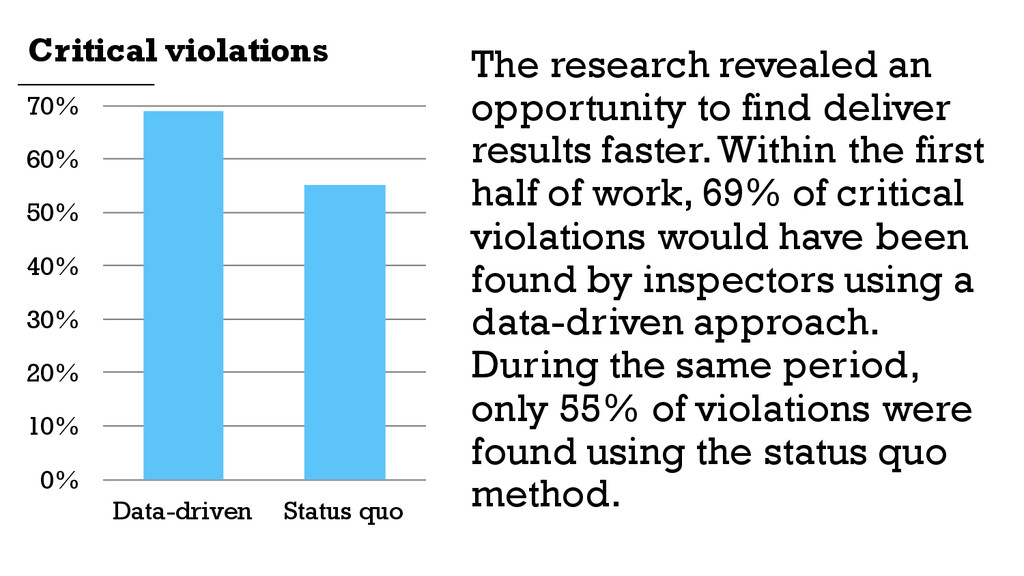
    70%
    The research revealed an
    opportunity to find deliver
    results faster. Within the first
    half of work, 69% of critical
    violations would have been
    found by inspectors using a
    data-driven approach.
    During the same period,
    only 55% of violations were
    found using the status quo
    method.
    Critical violations

    View Slide

  51. After comparing a data-driven approach
    versus the current methods, the 
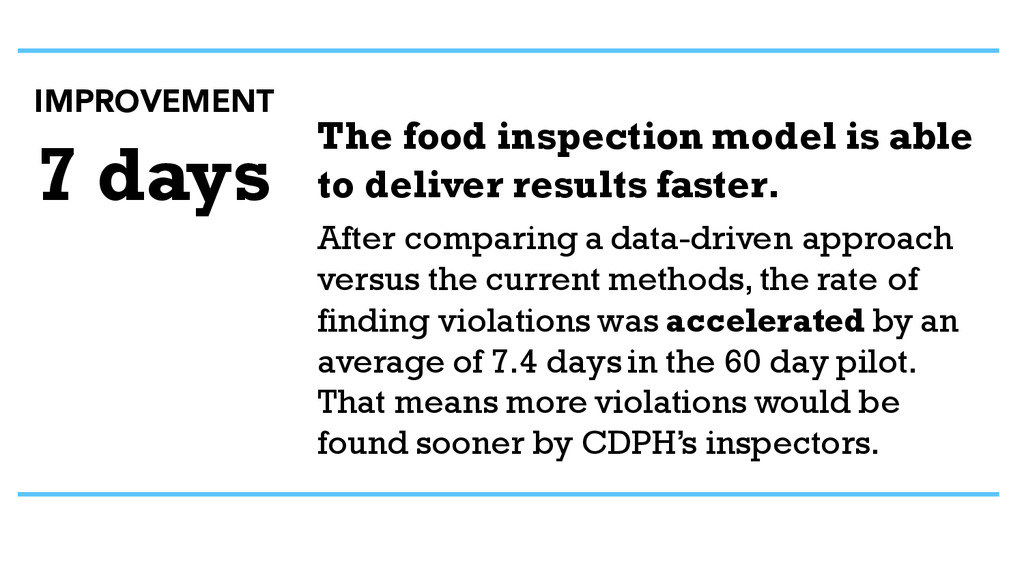
rate of
    finding violations was accelerated by an
    average of 7.4 days in the 60 day pilot.
    That means more violations would be
    found sooner by CDPH’s inspectors.
    7 days
    IMPROVEMENT
    The food inspection model is able
    to deliver results faster.

    View Slide

  52. OPTIMIZING FOOD INSPECTIONS
    Impact
    Discovering critical
    violations sooner rather
    than later reduces the risk
    of patrons becoming ill,
    which helps reduce medical
    expenses, lost time at work,
    and even a limited number
    of fatalities.

    View Slide

  53. http://chicago.github.io/food-inspections-evaluation/

    View Slide

  54. The project was released
    using an academic-
    quality technical paper
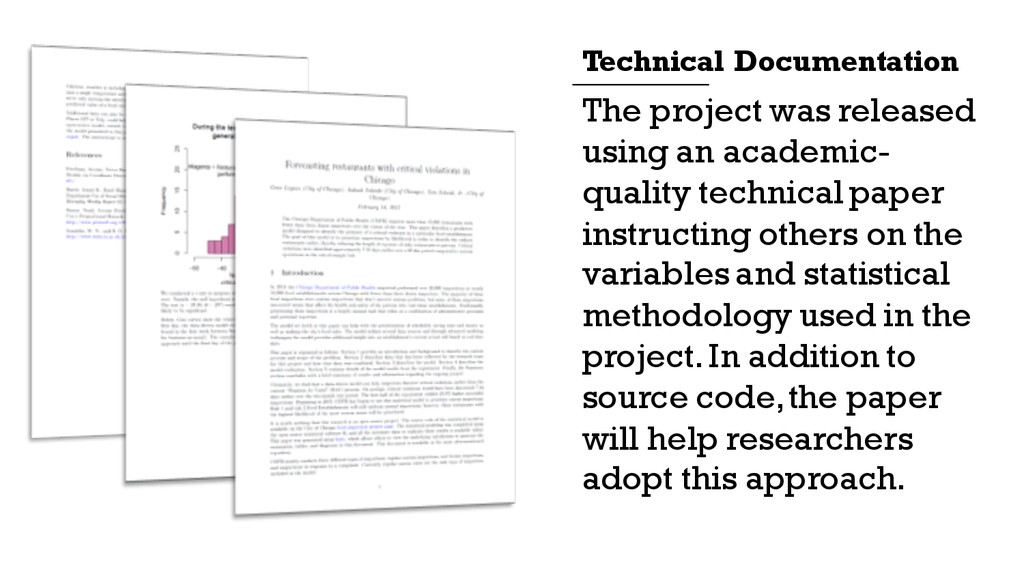
    instructing others on the
    variables and statistical
    methodology used in the
    project. In addition to
    source code, the paper
    will help researchers
    adopt this approach.
    Technical Documentation

    View Slide

  55. The technical paper was
    written as a highly-
    reproducible “knitr”
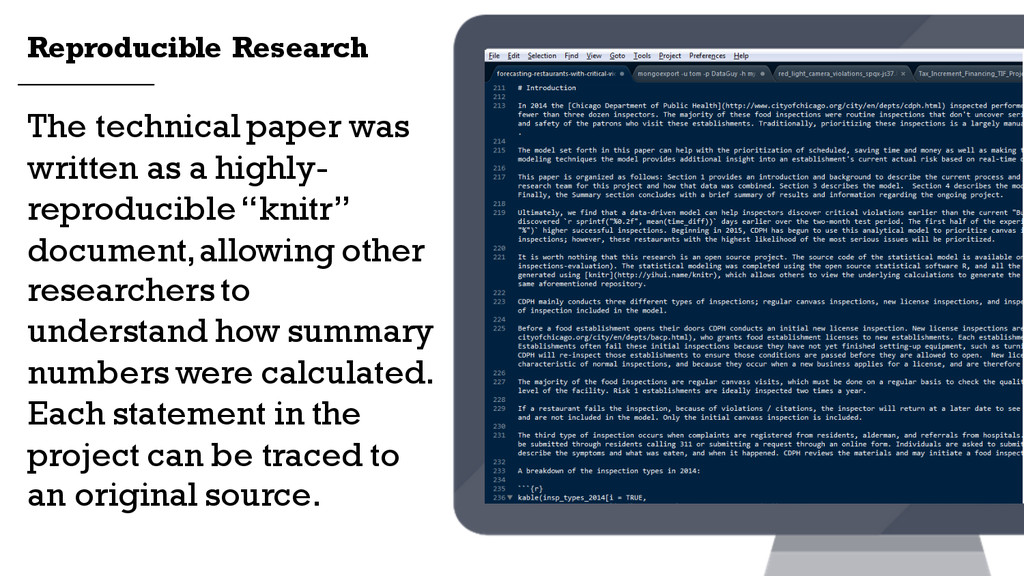
    document, allowing other
    researchers to
    understand how summary
    numbers were calculated.
    Each statement in the
    project can be traced to
    an original source.
    Reproducible Research

    View Slide

  56. The data science team has built a website which lets CDPH prioritize
    inspections based on projected risk.

    View Slide

  57. http://github.com/Chicago
    The analytical model
    will be released as an
    open source project
    on GitHub, allowing
    other cities to study
    or even adopt the
    model in their
    respective cities. No
    other city has
    released their
    analytic models
    before this release.
    #OPENSOURCE

    View Slide

  58. CHICAGO ECOSYSTEM
    Chicago’s ecosystem is driven by leveraging open
    data and open source solutions for easier sharing
    amongst a network of partners.

    View Slide

  59. THANK YOU
    Contact Info:
    Websites:
    Tom Schenk Jr.
    Chief Data Officer
    City of Chicago
    @ChicagoCDO
    [email protected]
    data.cityofchicago.org
    github.com/Chicago
    techplan.cityofchicago.org
    report.cityofchicago.org
    opengovhacknight.org
    arrayofthings.github.io
    datadictionary.cityofchicago.org
    digital.cityofchicago.org

    View Slide