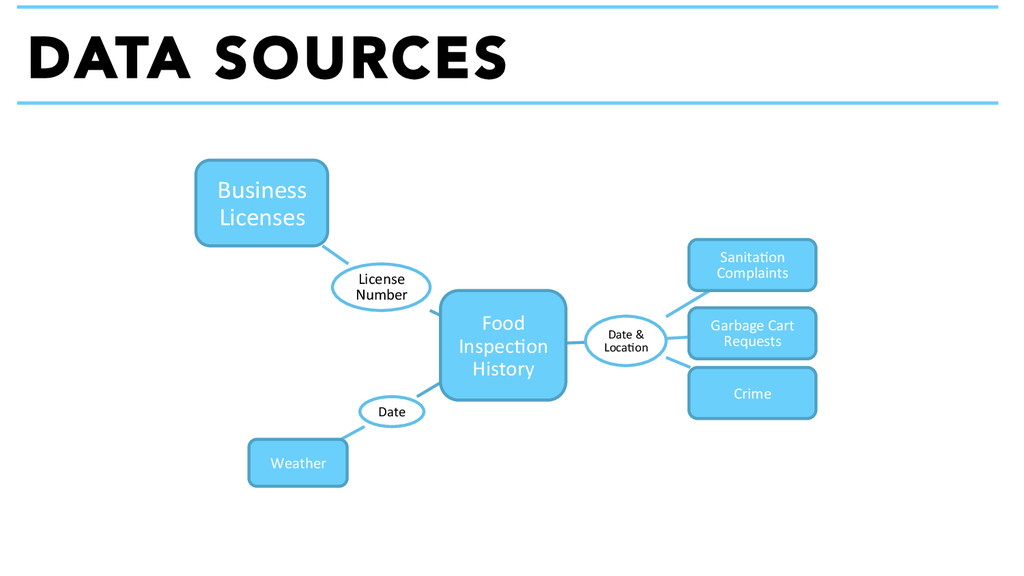
Alliance and Allstate Insurance Company’s data science team to help develop the predictive model. Data from the open data portal was used to develop the model. While other data were considered, almost all of the useful data was publicly available.
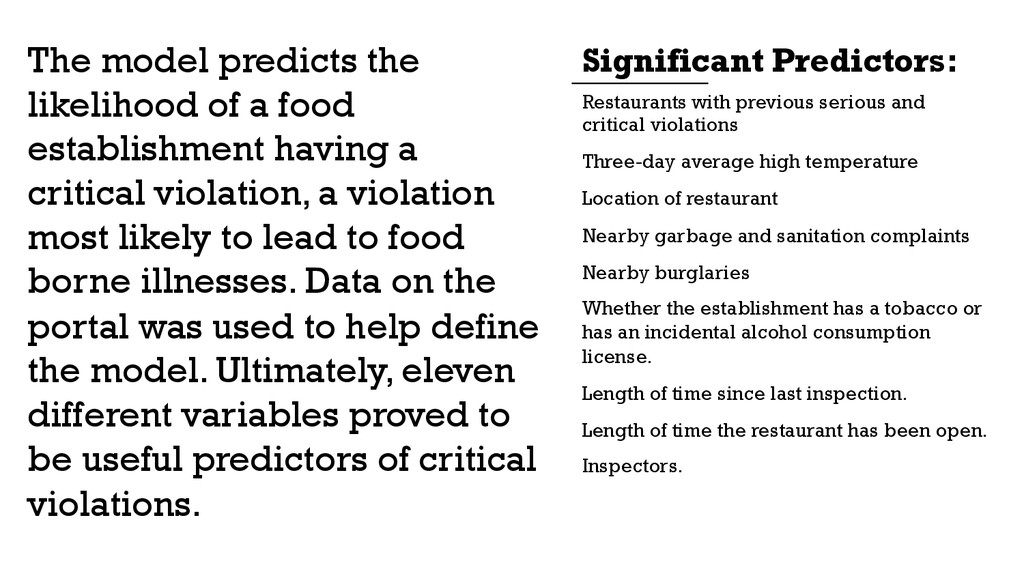
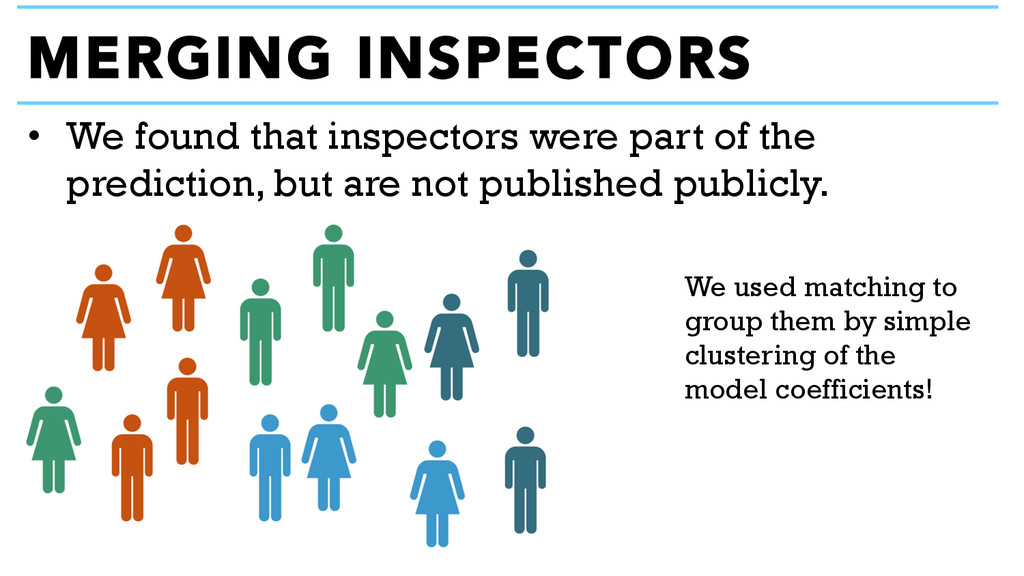
temperature Location of restaurant Nearby garbage and sanitation complaints Nearby burglaries Whether the establishment has a tobacco or has an incidental alcohol consumption license. Length of time since last inspection. Length of time the restaurant has been open. Inspectors. The model predicts the likelihood of a food establishment having a critical violation, a violation most likely to lead to food borne illnesses. Data on the portal was used to help define the model. Ultimately, eleven different variables proved to be useful predictors of critical violations. Significant Predictors:
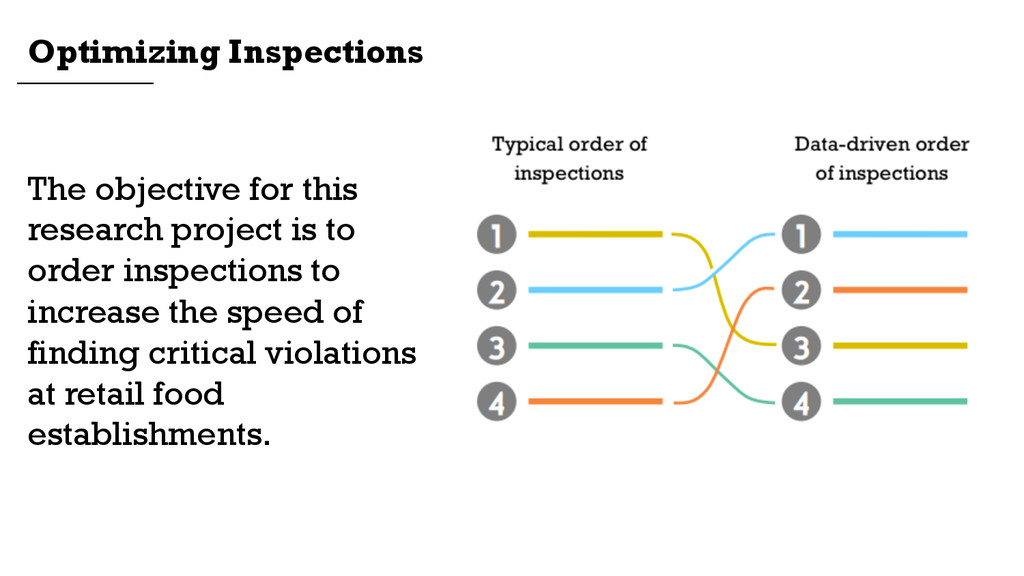
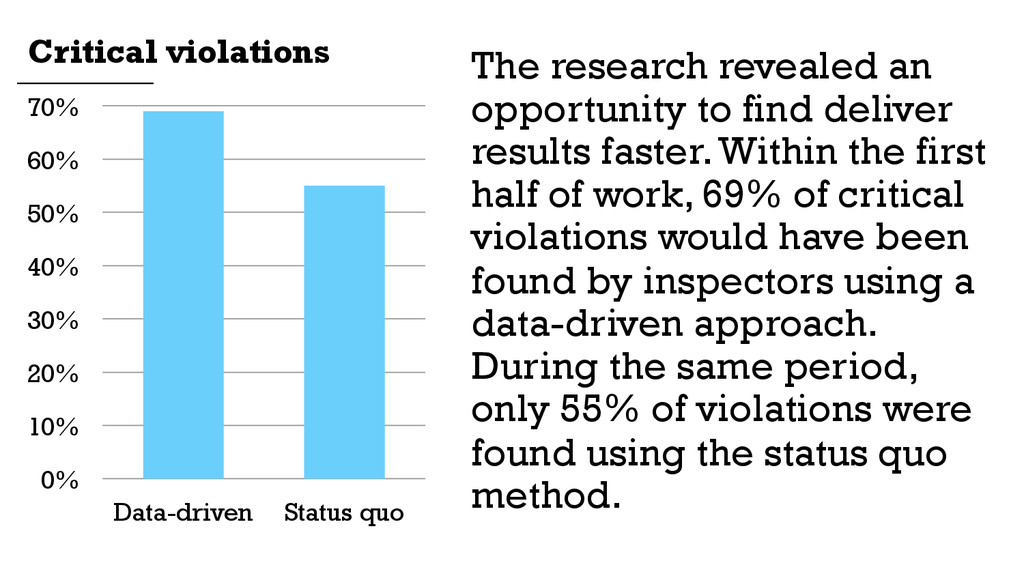
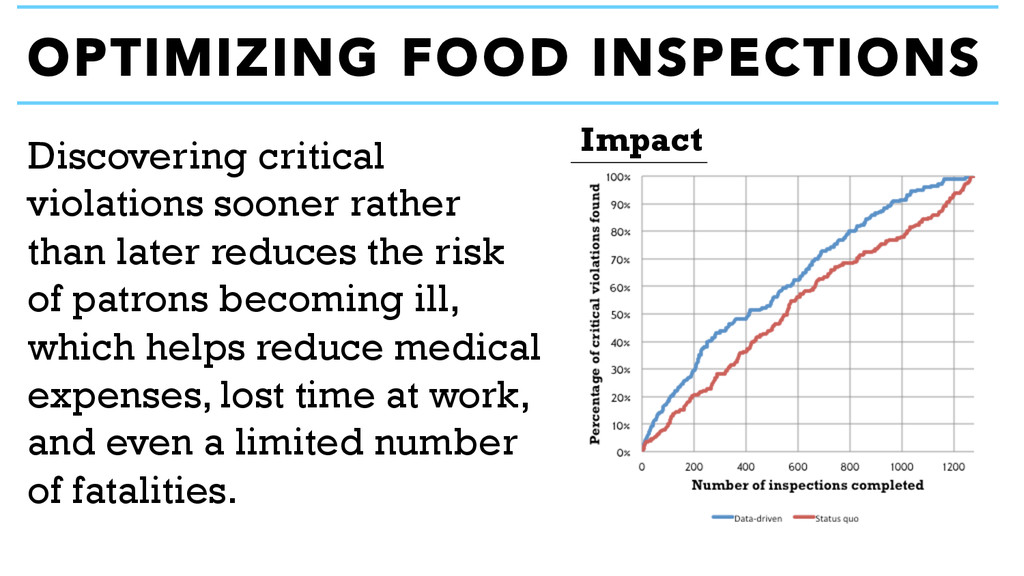
70% The research revealed an opportunity to find deliver results faster. Within the first half of work, 69% of critical violations would have been found by inspectors using a data-driven approach. During the same period, only 55% of violations were found using the status quo method. Critical violations
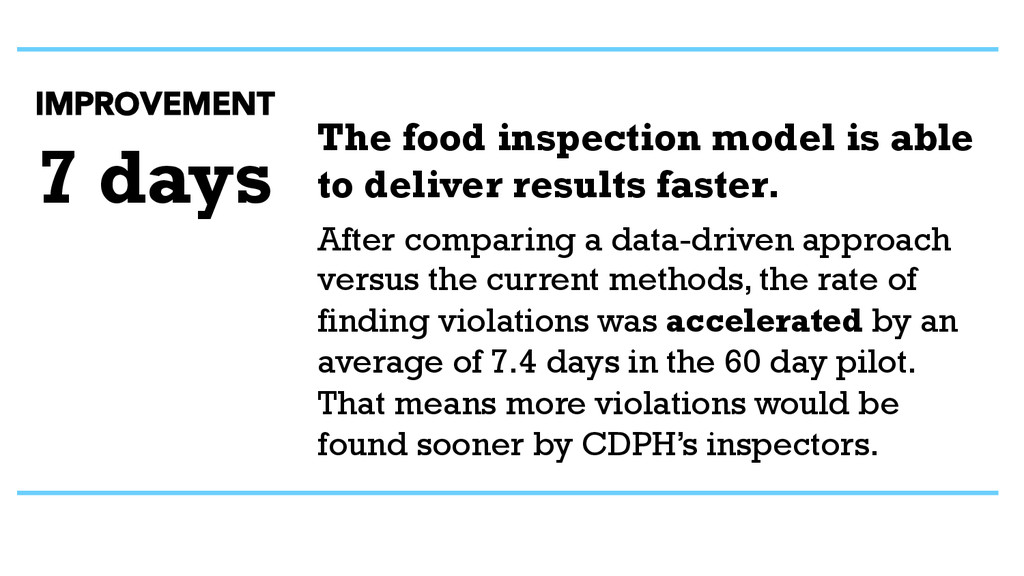
rate of finding violations was accelerated by an average of 7.4 days in the 60 day pilot. That means more violations would be found sooner by CDPH’s inspectors. 7 days IMPROVEMENT The food inspection model is able to deliver results faster.
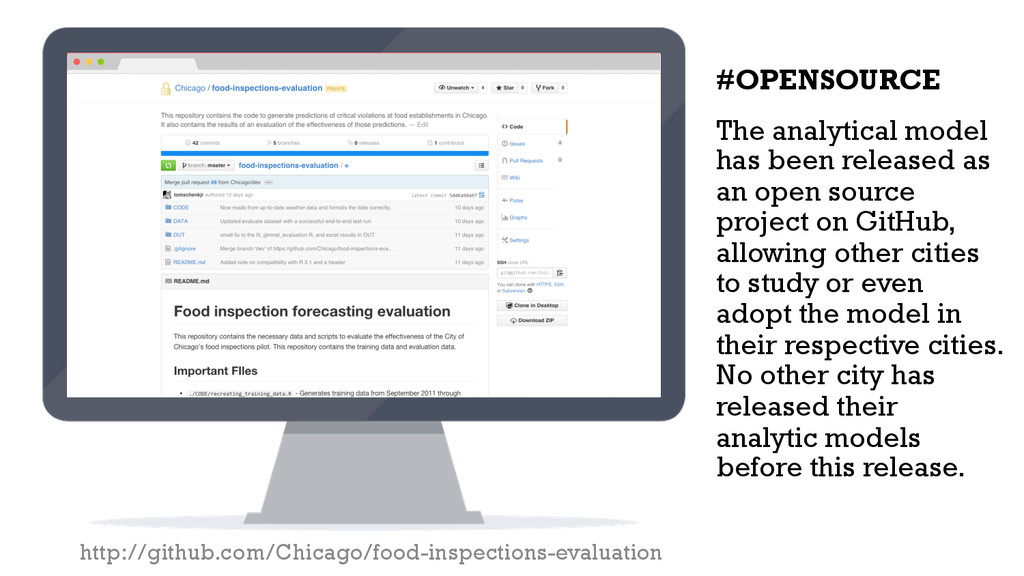
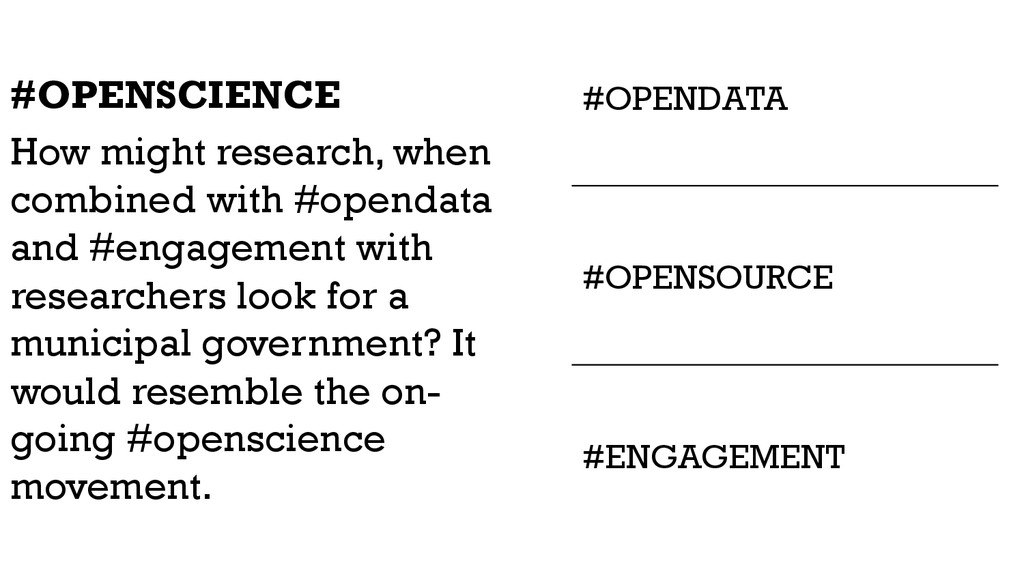
source project on GitHub, allowing other cities to study or even adopt the model in their respective cities. No other city has released their analytic models before this release. #OPENSOURCE
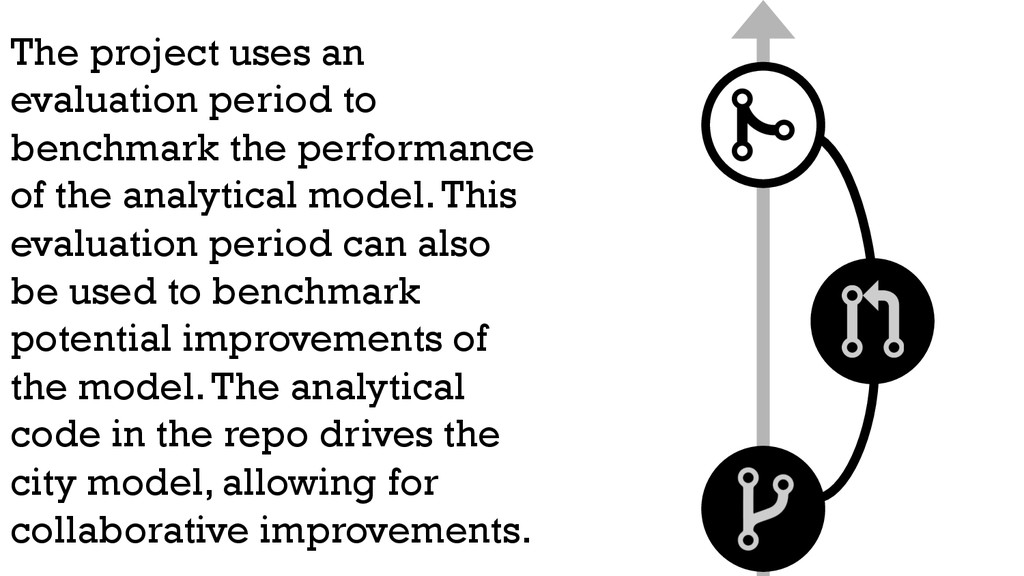
of the analytical model. This evaluation period can also be used to benchmark potential improvements of the model. The analytical code in the repo drives the city model, allowing for collaborative improvements.
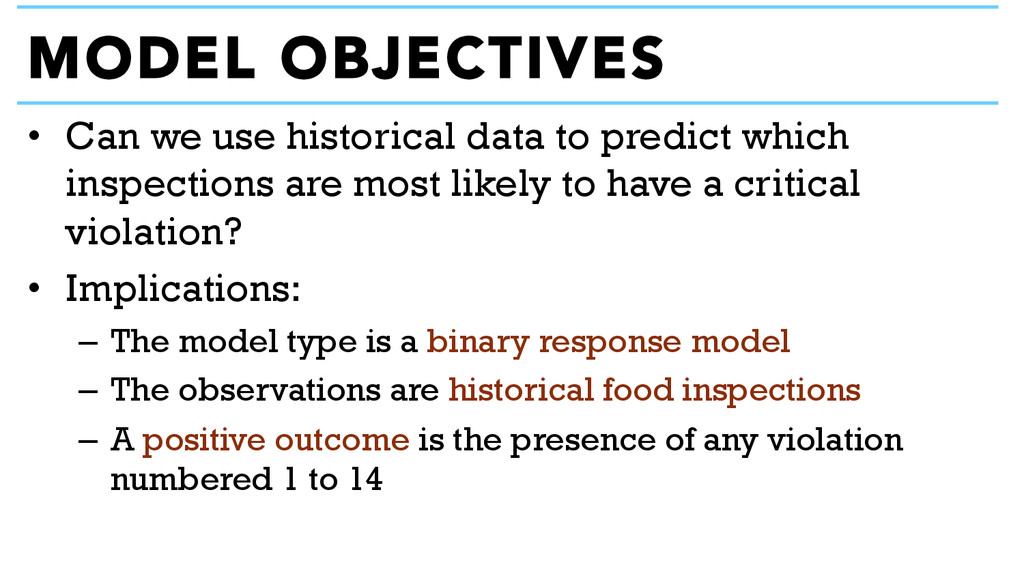
are most likely to have a critical violation? • Implications: – The model type is a binary response model – The observations are historical food inspections – A positive outcome is the presence of any violation numbered 1 to 14 MODEL OBJECTIVES
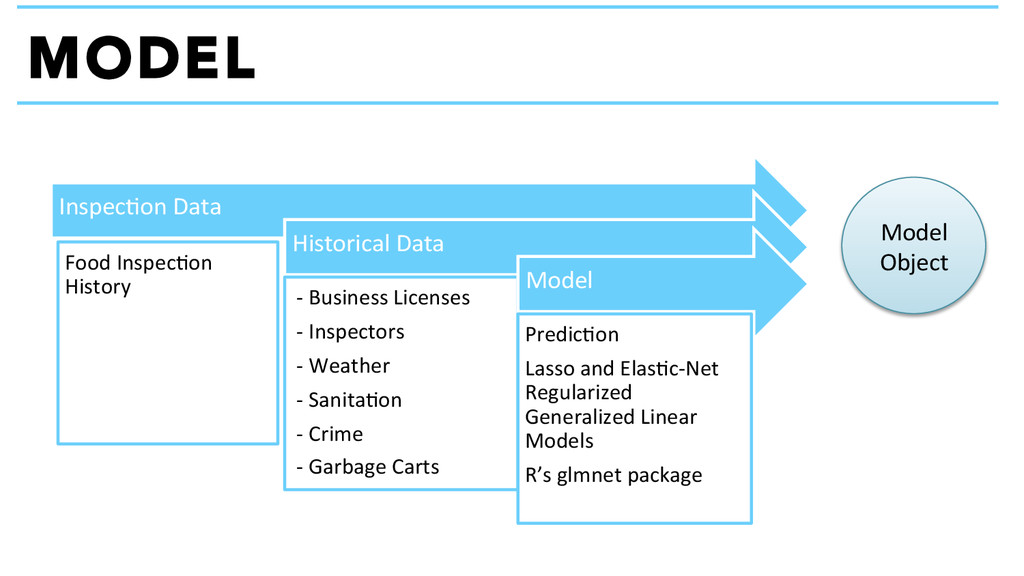
Data -‐ Business Licenses -‐ Inspectors -‐ Weather -‐ Sanita+on -‐ Crime -‐ Garbage Carts Model Predic+on Lasso and Elas+c-‐Net Regularized Generalized Linear Models R’s glmnet package Model Object
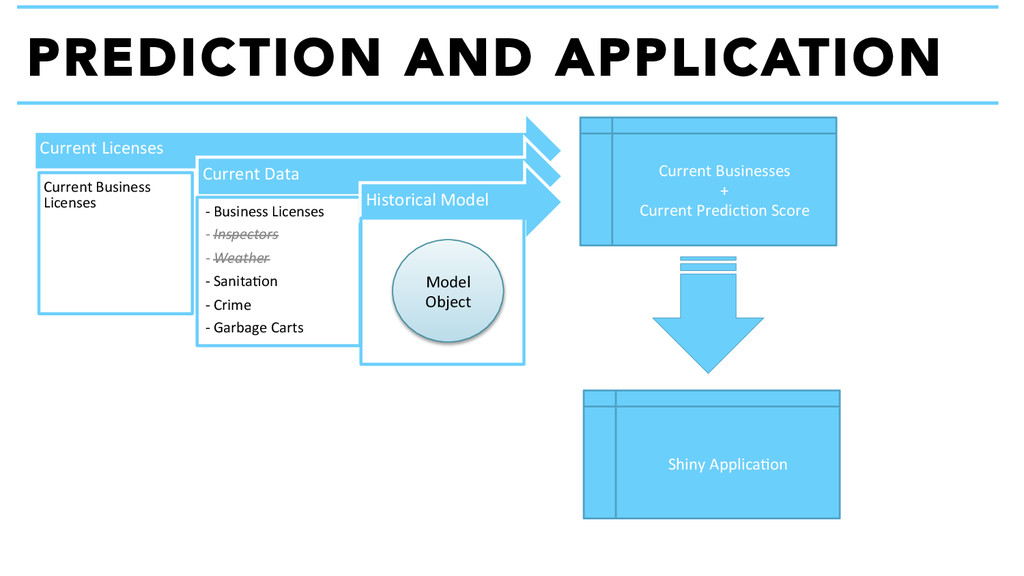
Current Data -‐ Business Licenses -‐ Inspectors -‐ Weather -‐ Sanita+on -‐ Crime -‐ Garbage Carts Historical Model Model Object Current Businesses + Current Predic+on Score Shiny Applica+on
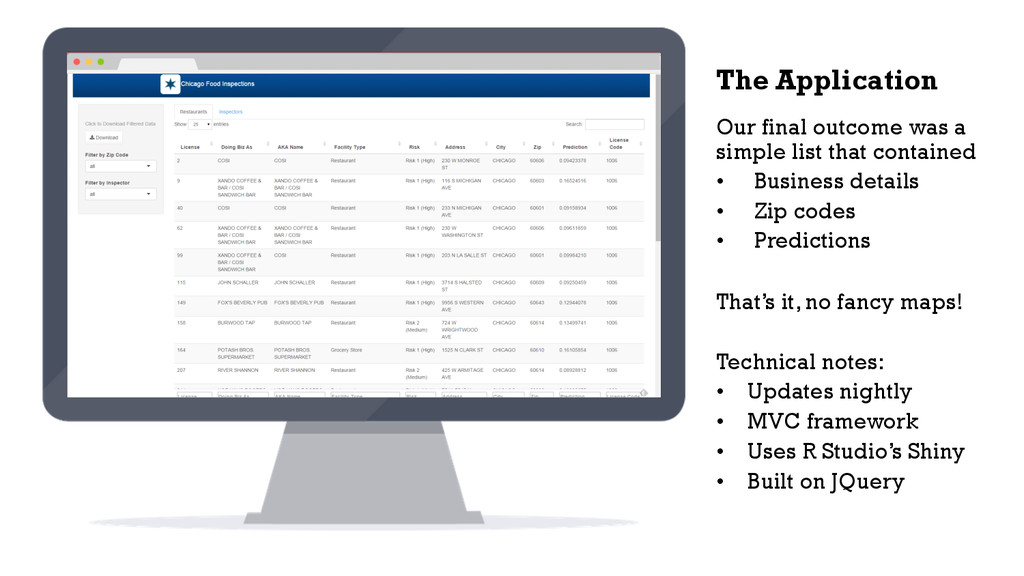
Business details • Zip codes • Predictions That’s it, no fancy maps! Technical notes: • Updates nightly • MVC framework • Uses R Studio’s Shiny • Built on JQuery The Application
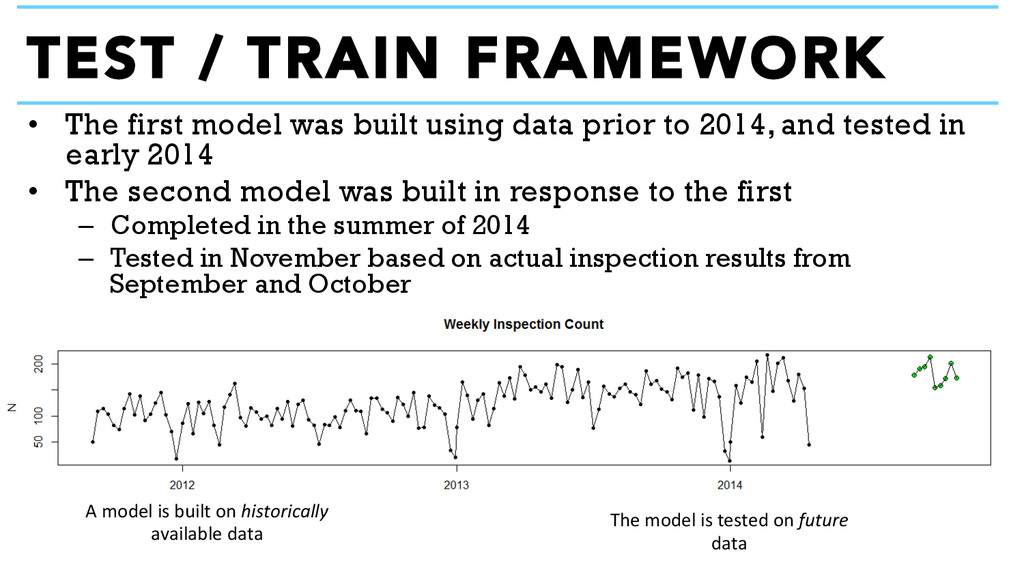
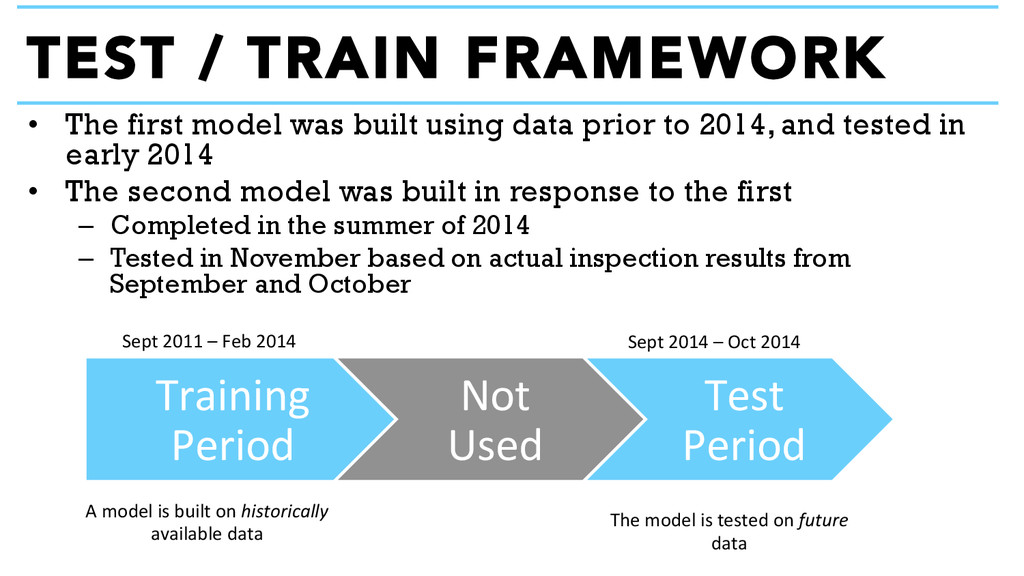
2014, and tested in early 2014 • The second model was built in response to the first – Completed in the summer of 2014 – Tested in November based on actual inspection results from September and October TEST / TRAIN FRAMEWORK Training Period Not Used Test Period Sept 2011 – Feb 2014 Sept 2014 – Oct 2014 A model is built on historically available data The model is tested on future data
2014, and tested in early 2014 • The second model was built in response to the first – Completed in the summer of 2014 – Tested in November based on actual inspection results from September and October TEST / TRAIN FRAMEWORK Training Period Not Used Test Period Sept 2011 – Feb 2014 Sept 2014 – Oct 2014 A model is built on historically available data The model is tested on future data
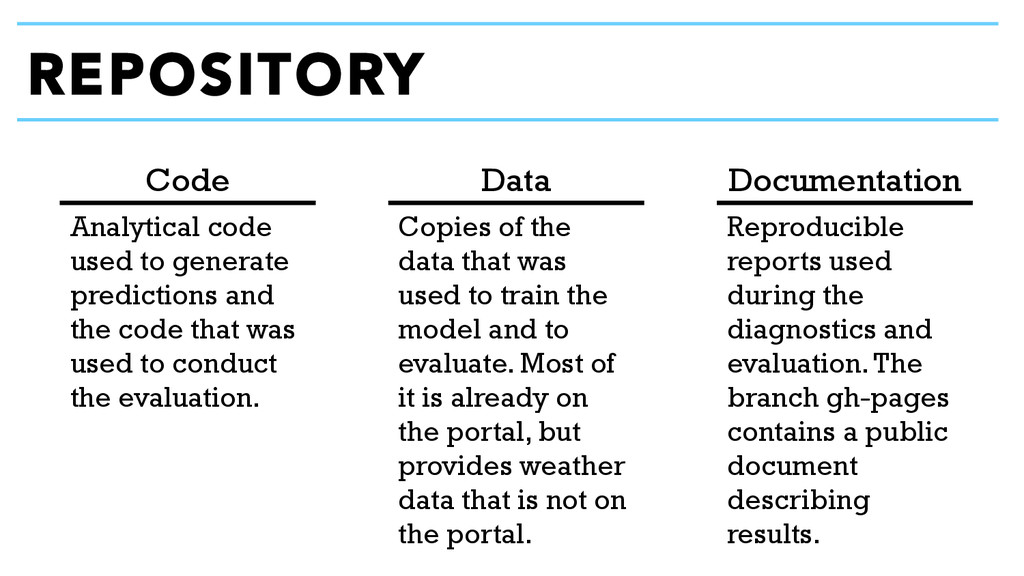
and the code that was used to conduct the evaluation. Copies of the data that was used to train the model and to evaluate. Most of it is already on the portal, but provides weather data that is not on the portal. Reproducible reports used during the diagnostics and evaluation. The branch gh-pages contains a public document describing results.
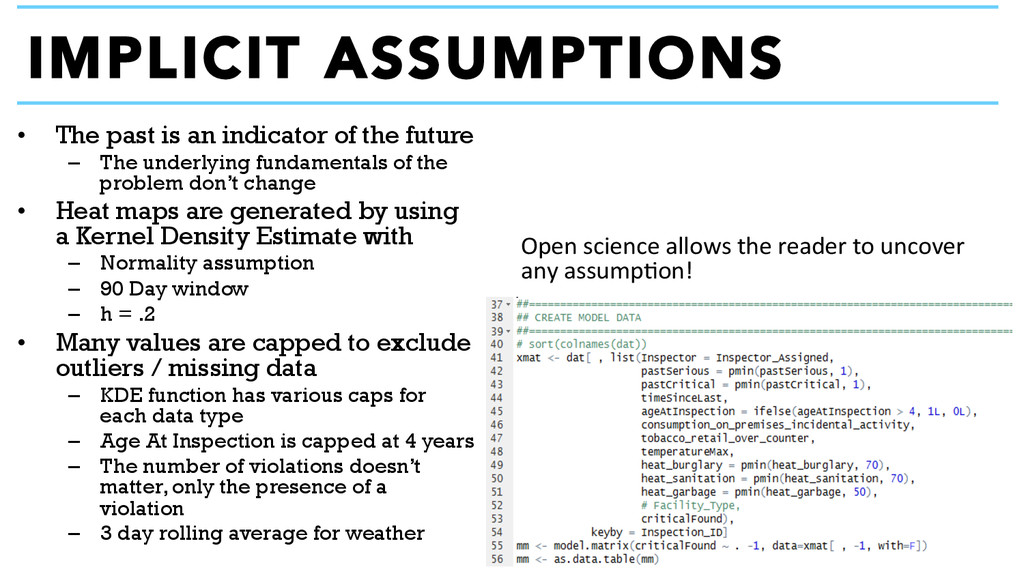
The underlying fundamentals of the problem don’t change • Heat maps are generated by using a Kernel Density Estimate with – Normality assumption – 90 Day window – h = .2 • Many values are capped to exclude outliers / missing data – KDE function has various caps for each data type – Age At Inspection is capped at 4 years – The number of violations doesn’t matter, only the presence of a violation – 3 day rolling average for weather IMPLICIT ASSUMPTIONS Open science allows the reader to uncover any assump+on!
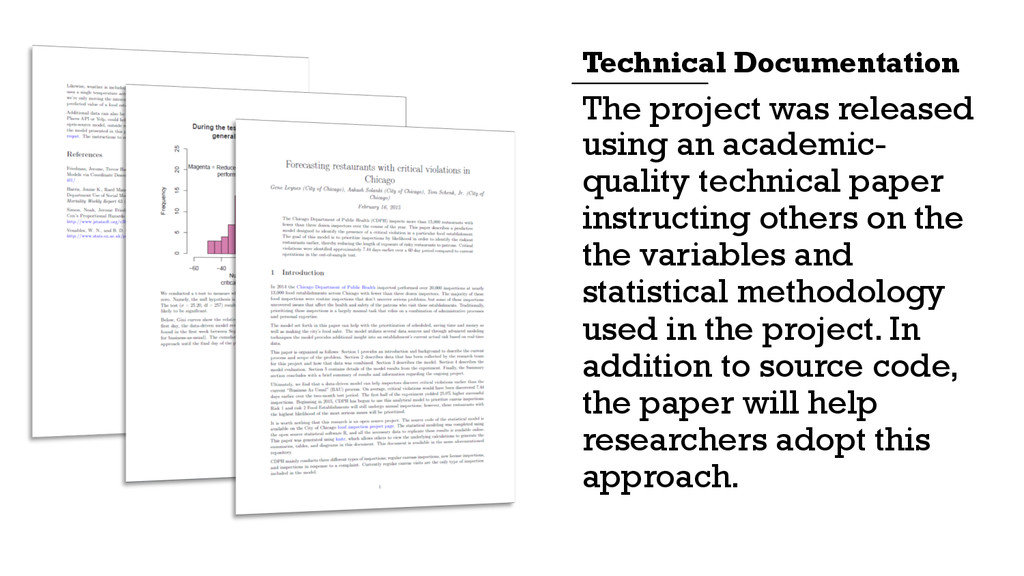
instructing others on the the variables and statistical methodology used in the project. In addition to source code, the paper will help researchers adopt this approach. Technical Documentation
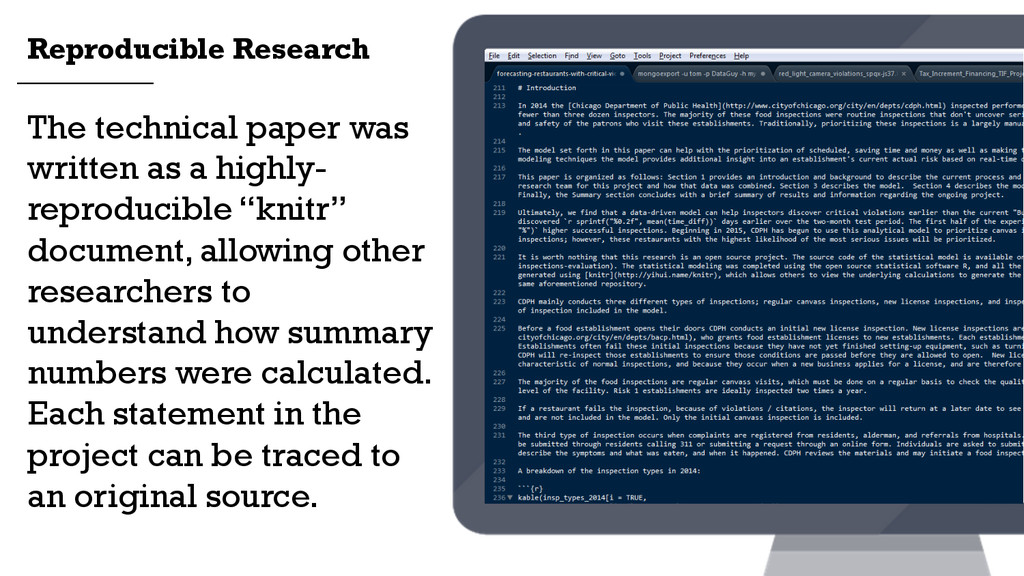
document, allowing other researchers to understand how summary numbers were calculated. Each statement in the project can be traced to an original source. Reproducible Research