A review of data visualization that is useful for the workplace, with an emphasis on visualization for clarity. A brief review of data visualization followed by practical examples of simple and complex visualizations.
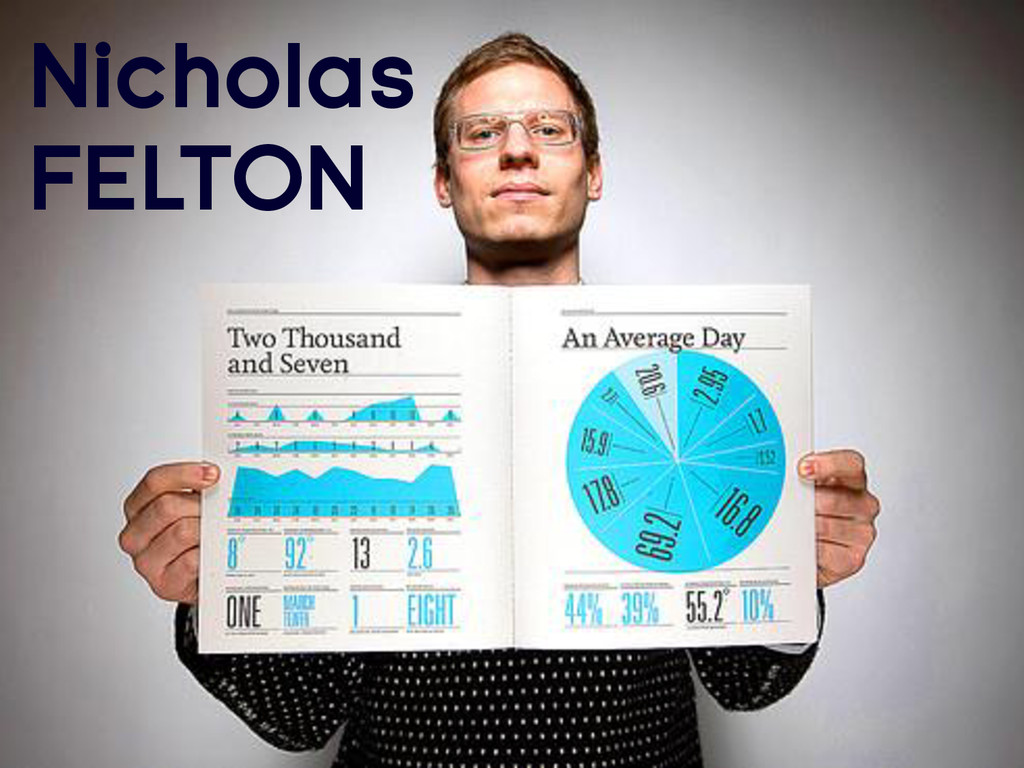
who combines the skill of software programmer, statistician, and story teller/artist to extract the nuggets of gold hidden under mountains of data. -Hal Varian, Chief Economist @ Google
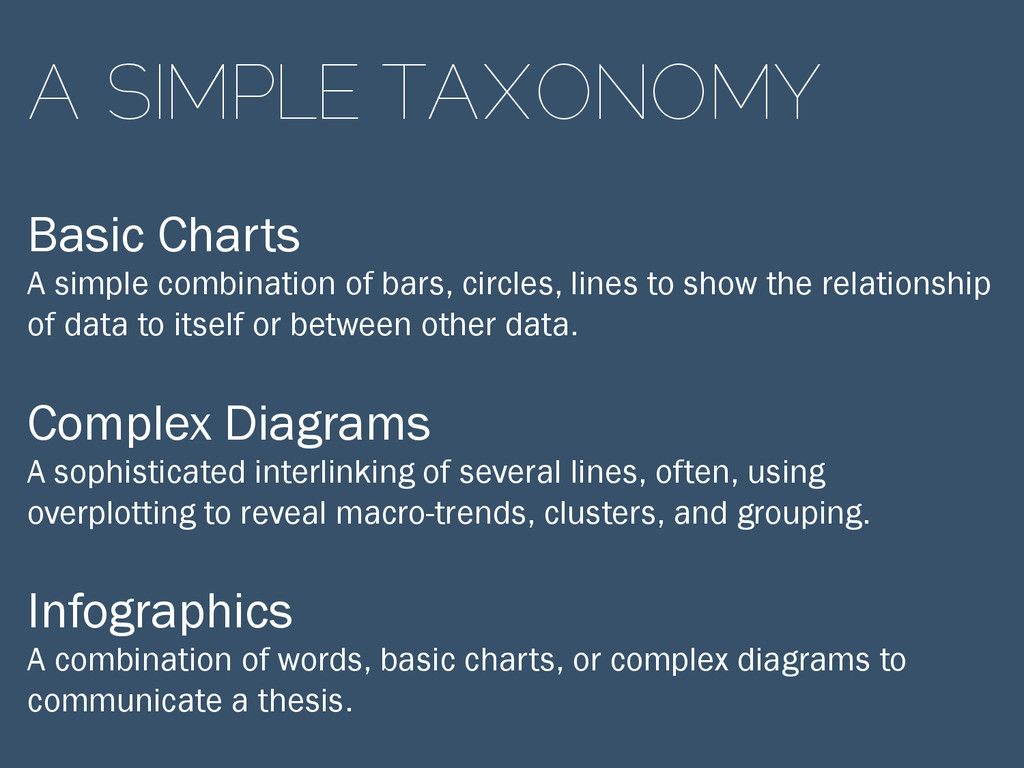
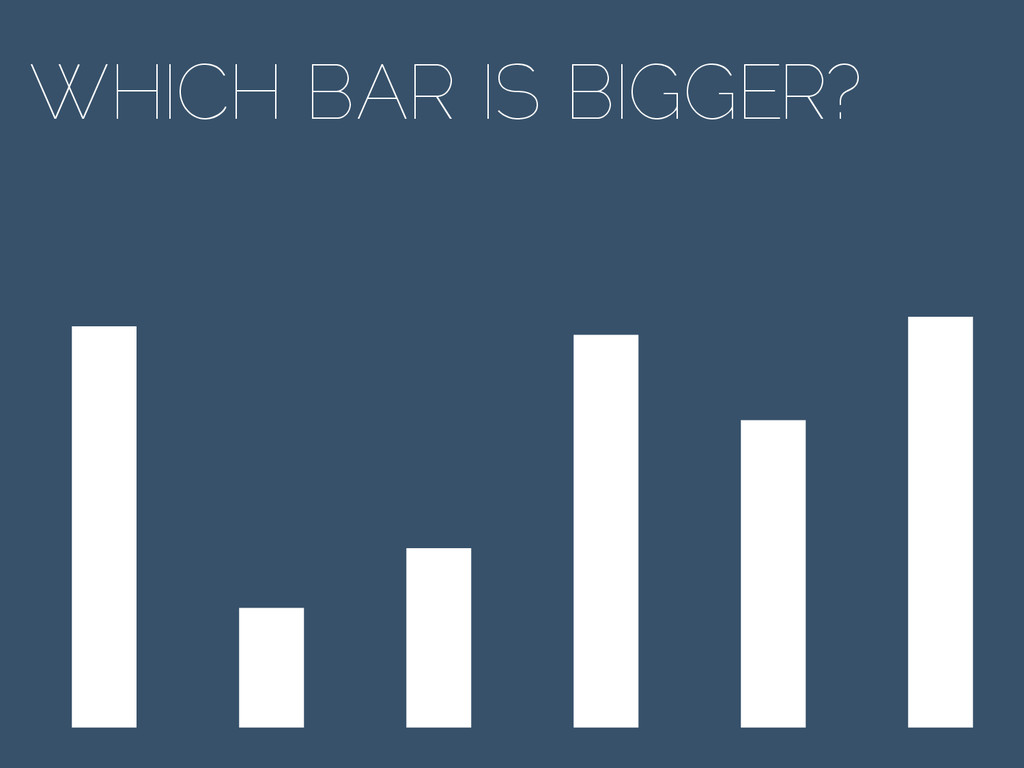
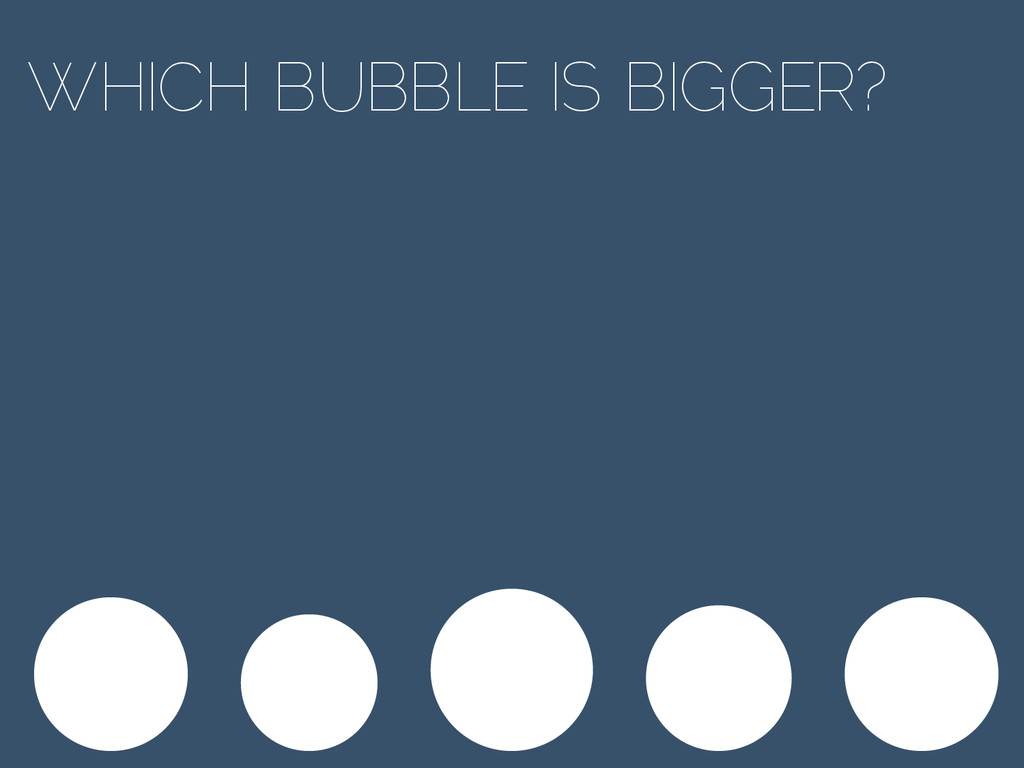
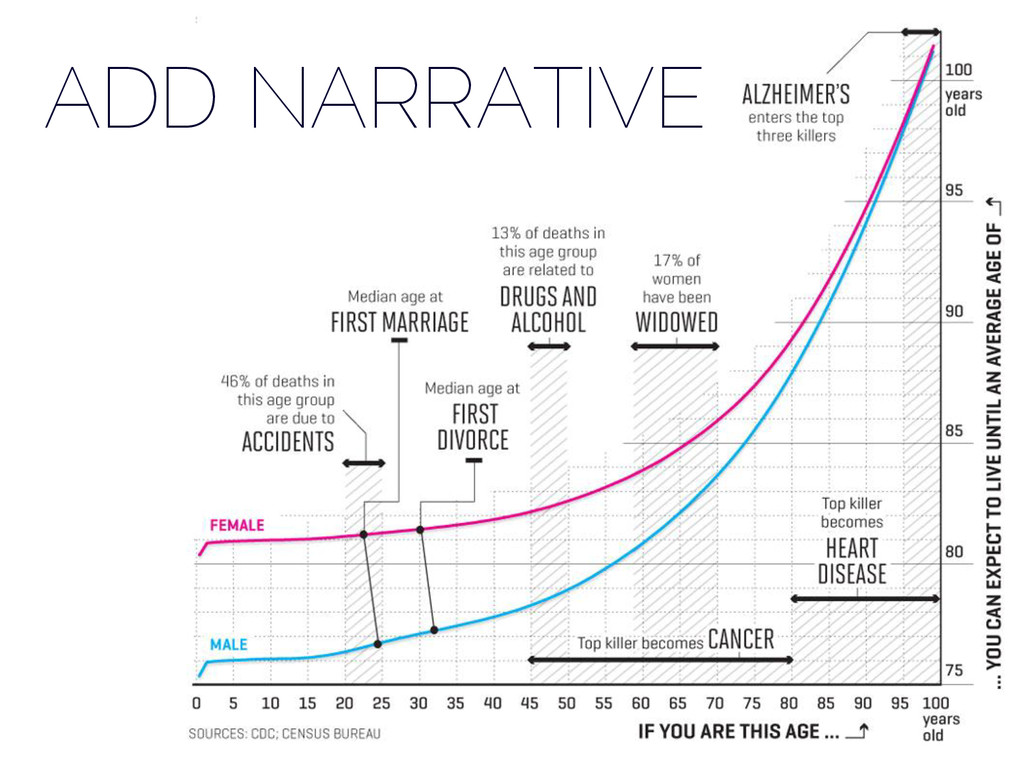
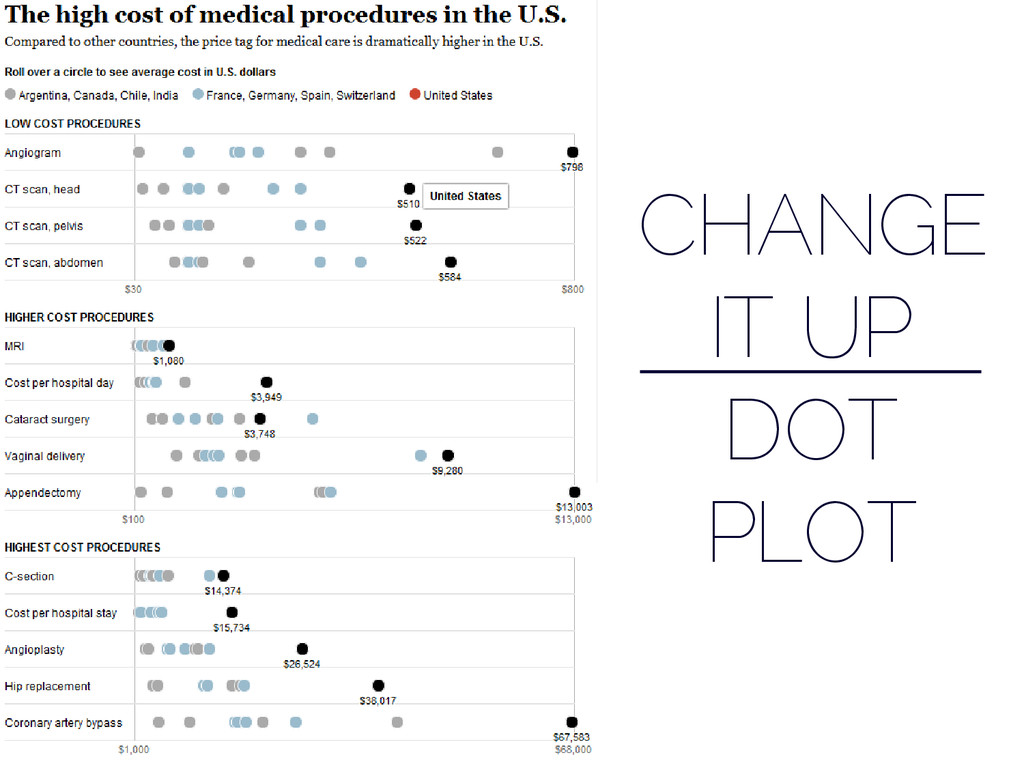
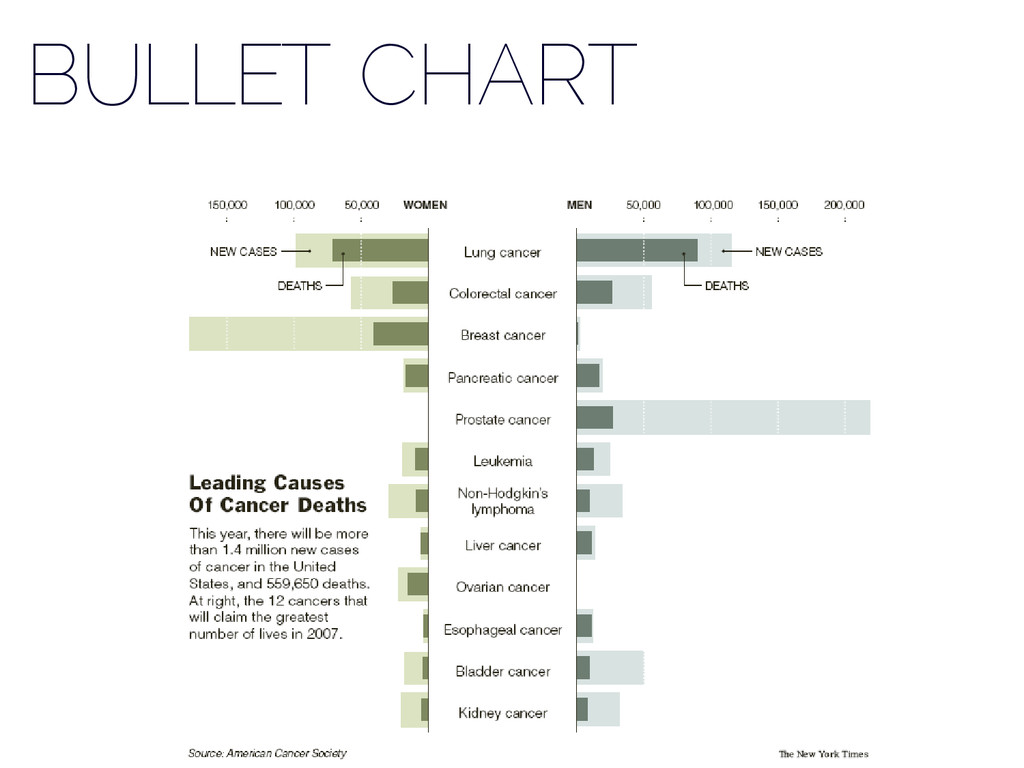
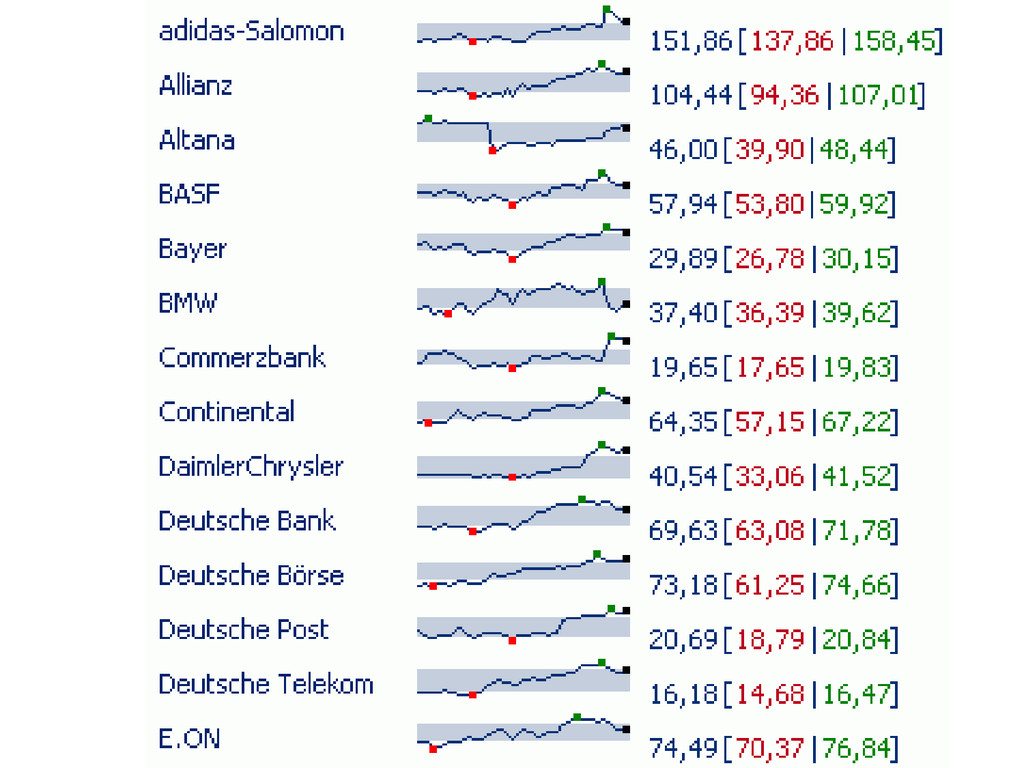
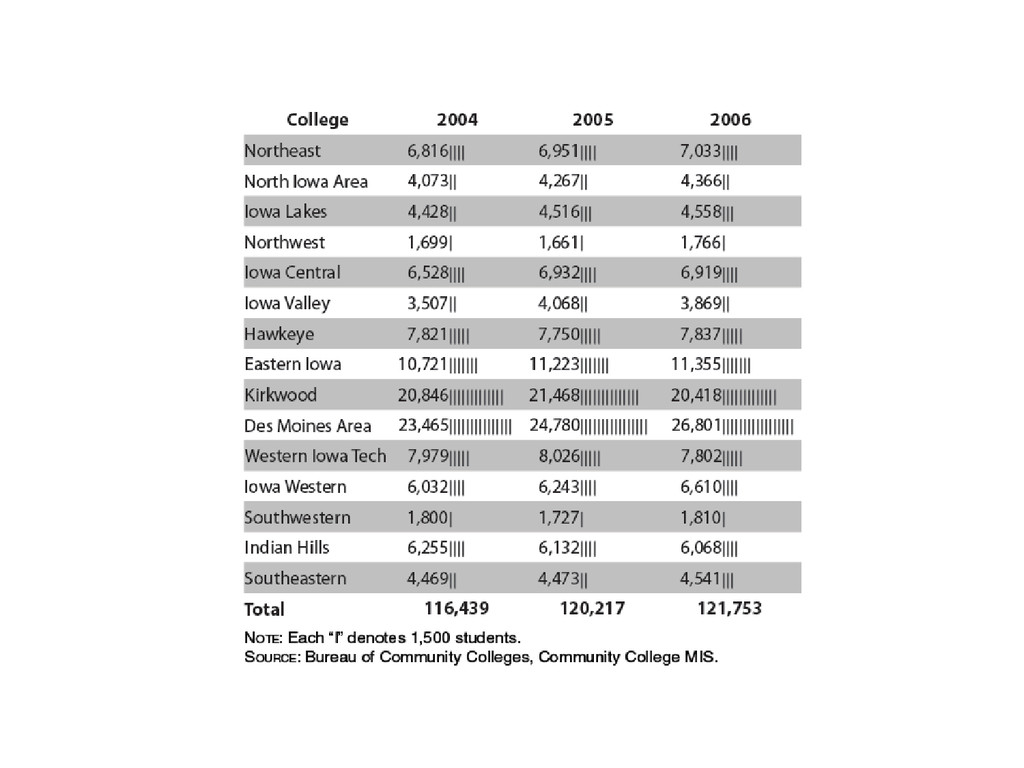
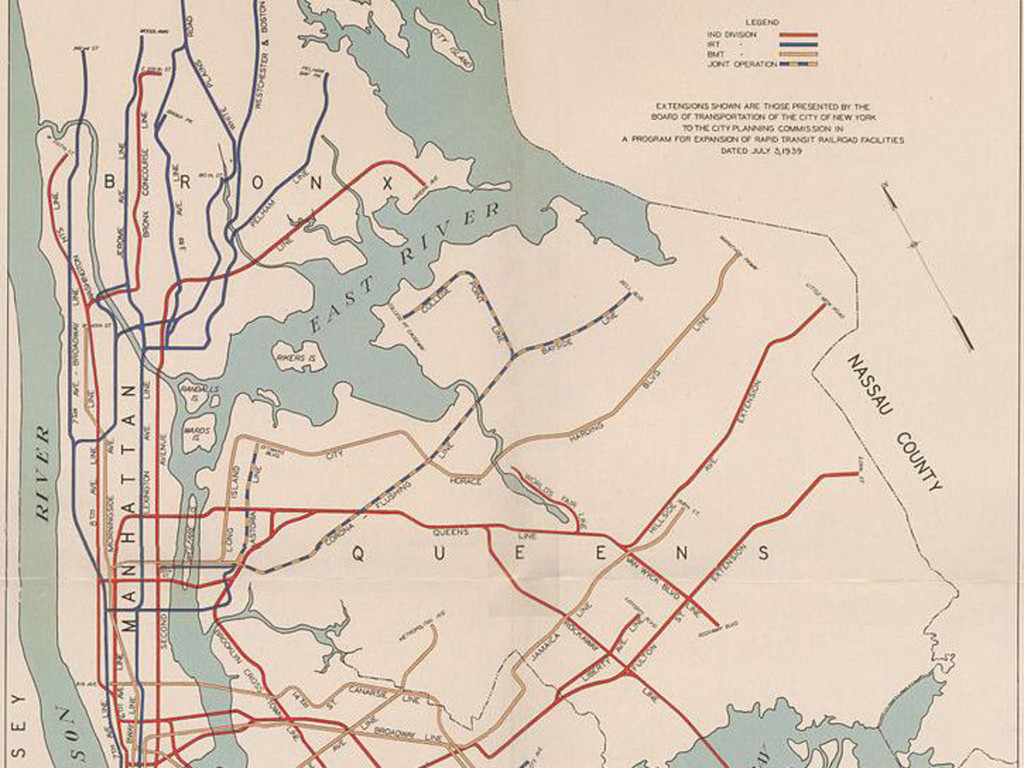
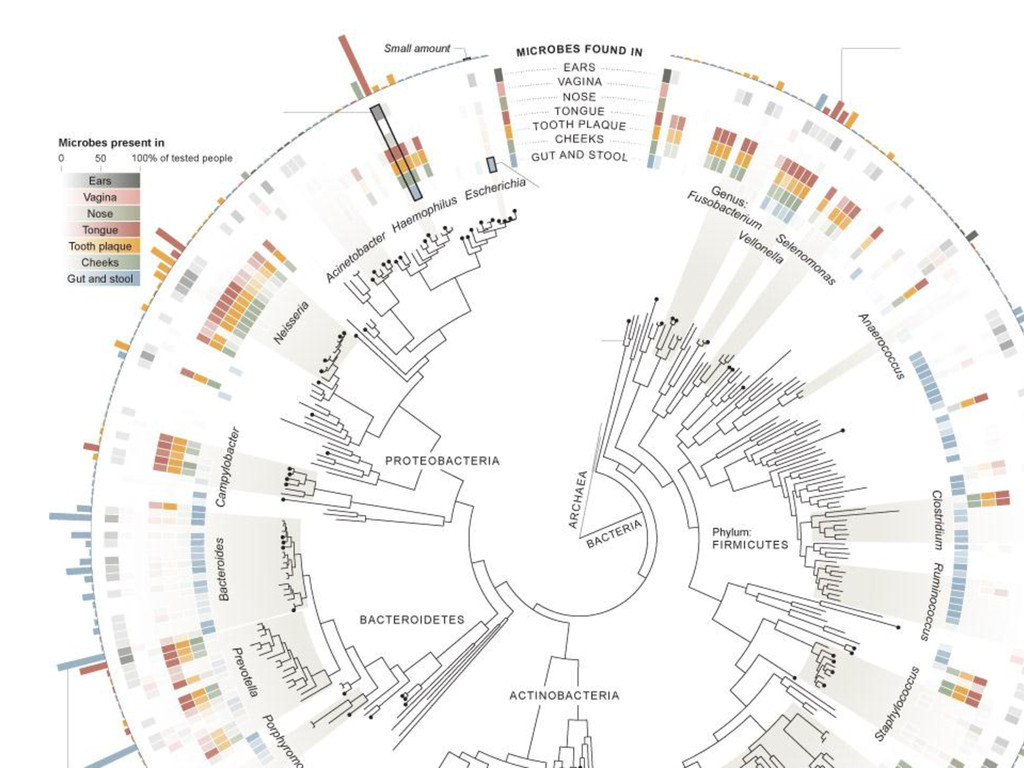
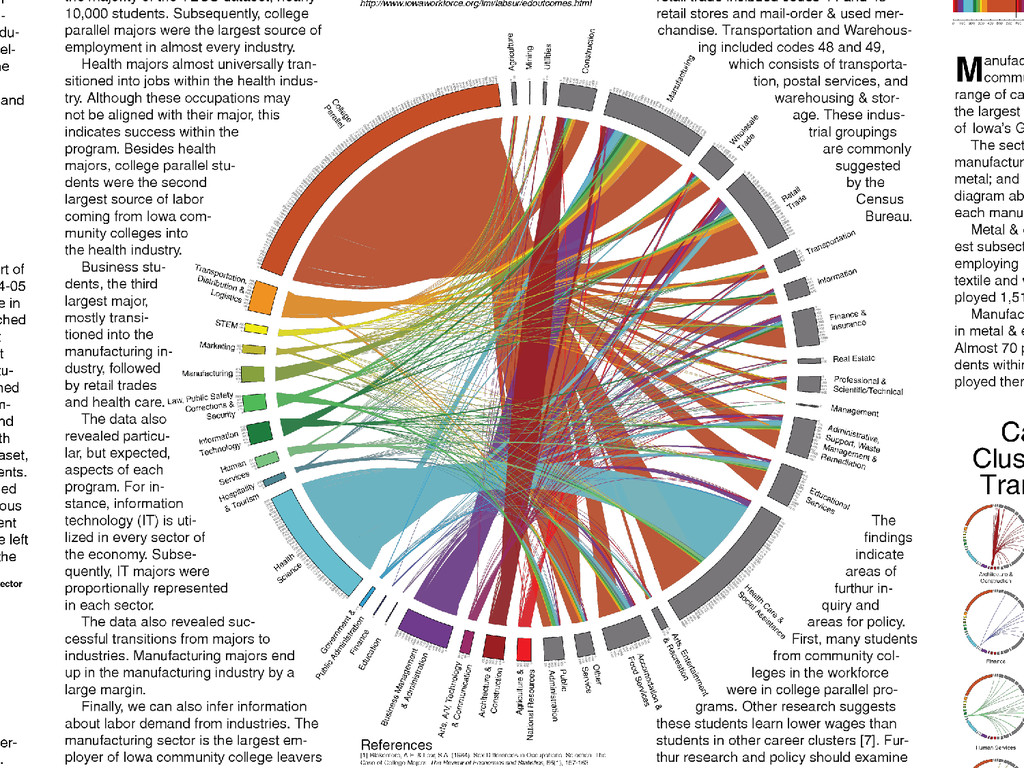
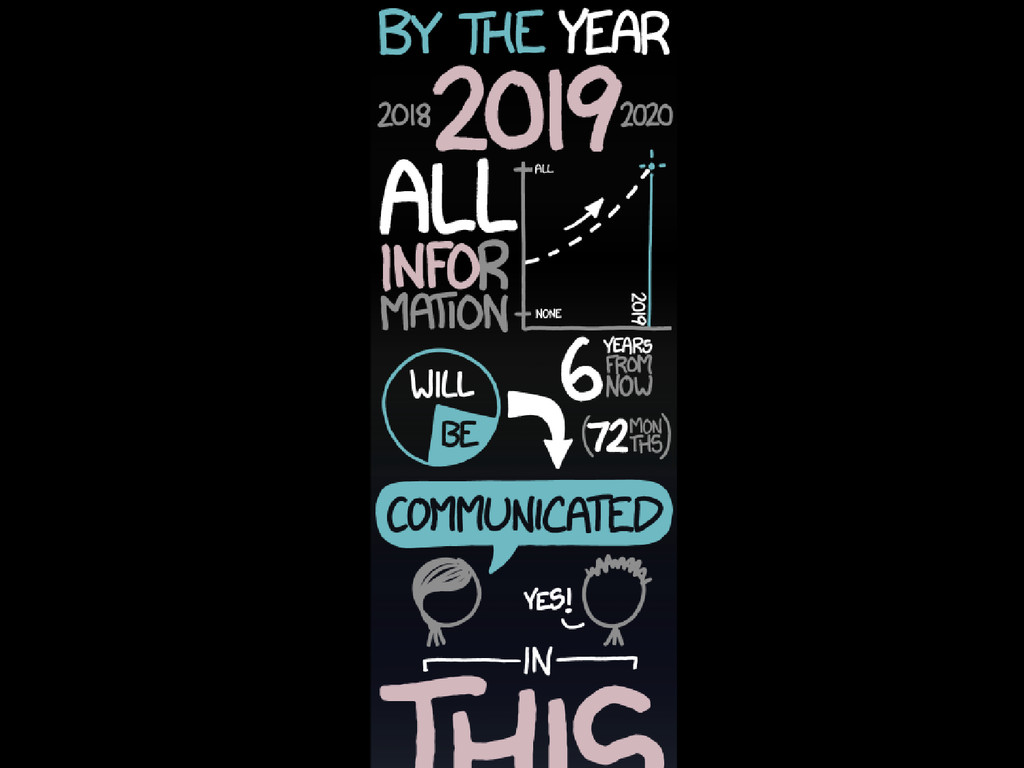
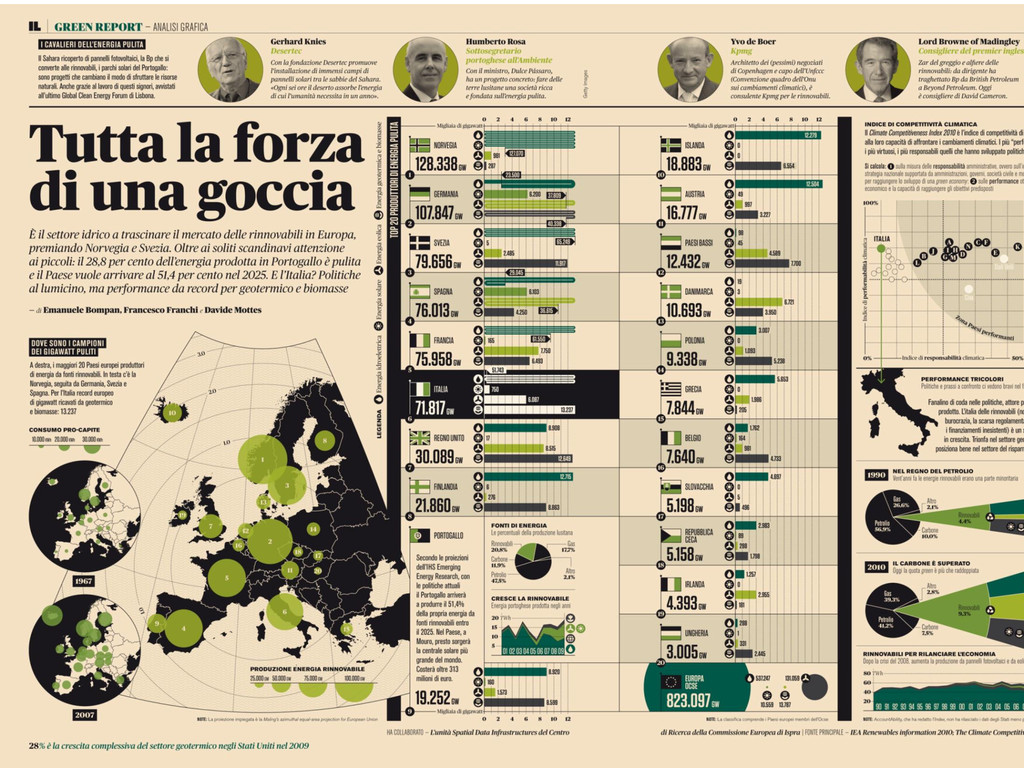
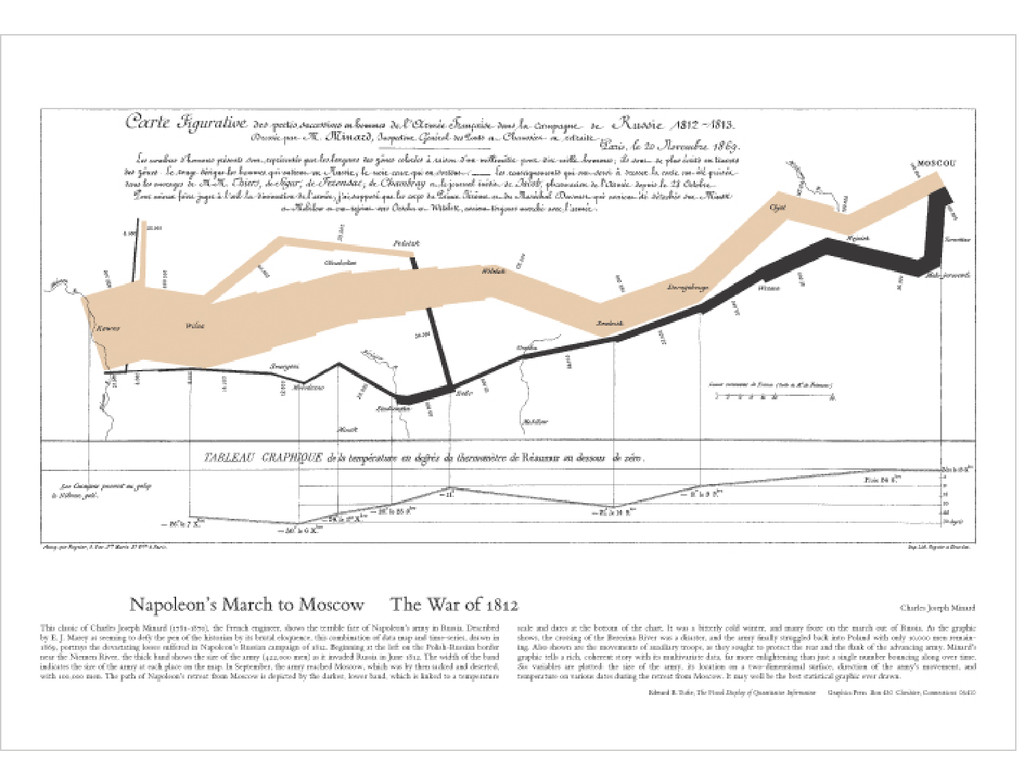
circles, lines to show the relationship of data to itself or between other data. Complex Diagrams A sophisticated interlinking of several lines, often, using overplotting to reveal macro-trends, clusters, and grouping. Infographics A combination of words, basic charts, or complex diagrams to communicate a thesis.
![[A] new kind of professional has emerged, the data scientist,](https://files.speakerdeck.com/presentations/5b6e45f071ee01314bf35aef2655508f/slide_2.jpg)
![TOM SCHENK JR [email protected]](https://files.speakerdeck.com/presentations/5b6e45f071ee01314bf35aef2655508f/slide_34.jpg)