Upgrade to Pro — share decks privately, control downloads, hide ads and more …

Data-Driven Government

Data-Driven Government

Presented to Iowa State Unviersity's Economics Club in Ames, IA on October 13th, 2016

Tom Schenk Jr

October 13, 2016
Tweet

More Decks by Tom Schenk Jr

Other Decks in Technology

Transcript

  1. How does cities form? Let’s run a simulation! How can

    a computer simulation represent reality?
  2. Hyper-local estimates for internal- rate of return for education K-12/college/employment/prison

    outcomes system Long-term program evaluation Labor-market outcomes STEM Policy
  3. Applied similar methodologies to understand the impact of treatments on

    cancer patient’s quality of life, including the effects of anti-angiogenesis treatments on renal cell cancer patients.
  4. Administrative data is data collected by governments as part of

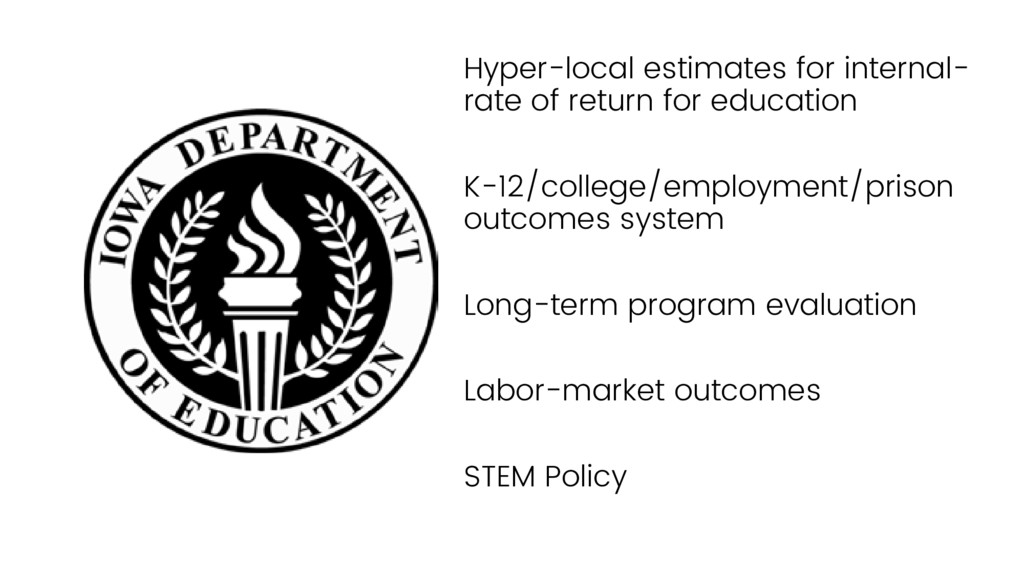
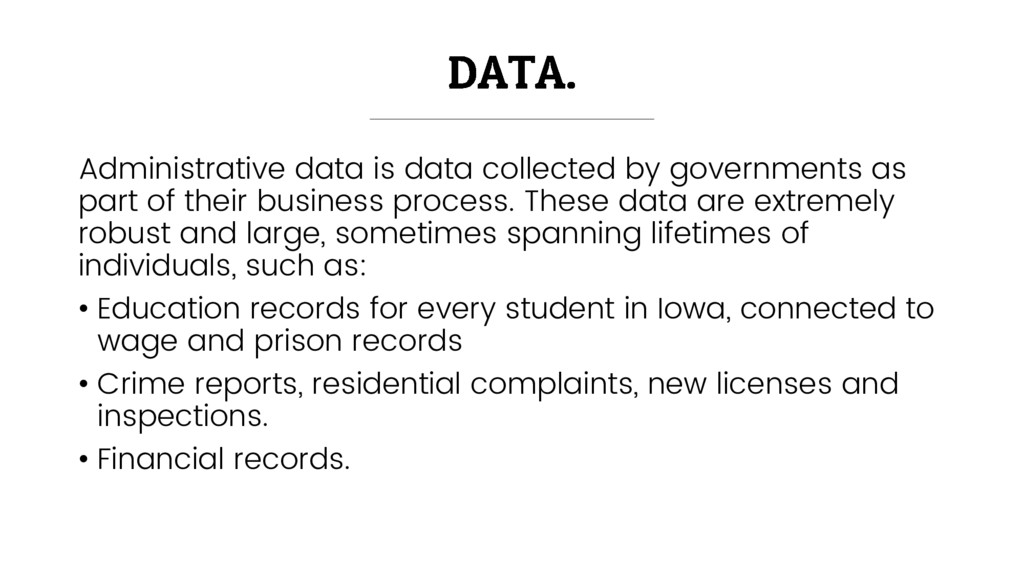
    their business process. These data are extremely robust and large, sometimes spanning lifetimes of individuals, such as: • Education records for every student in Iowa, connected to wage and prison records • Crime reports, residential complaints, new licenses and inspections. • Financial records.
  5. Research without communication is talking to yourself. Data visualization is

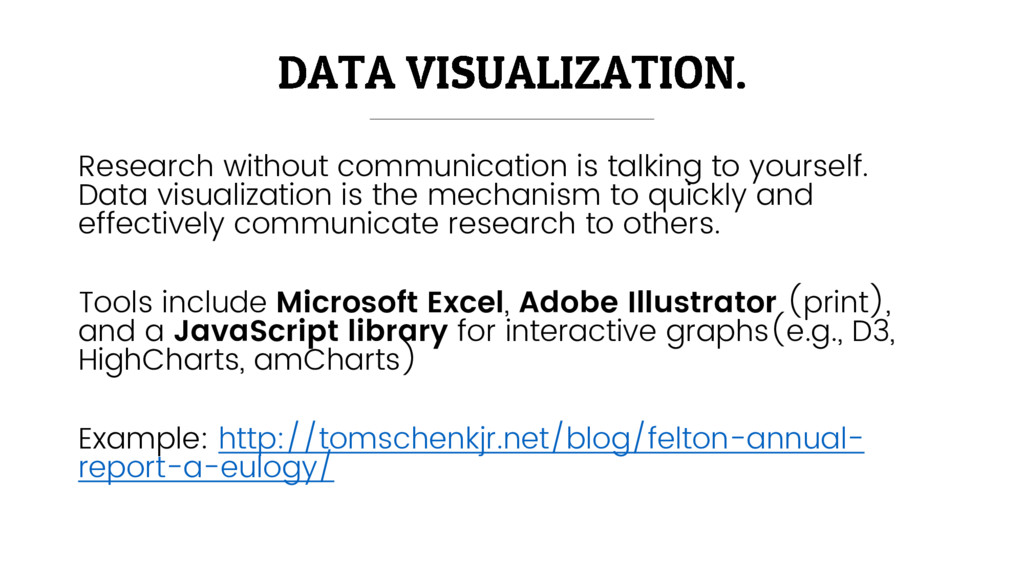
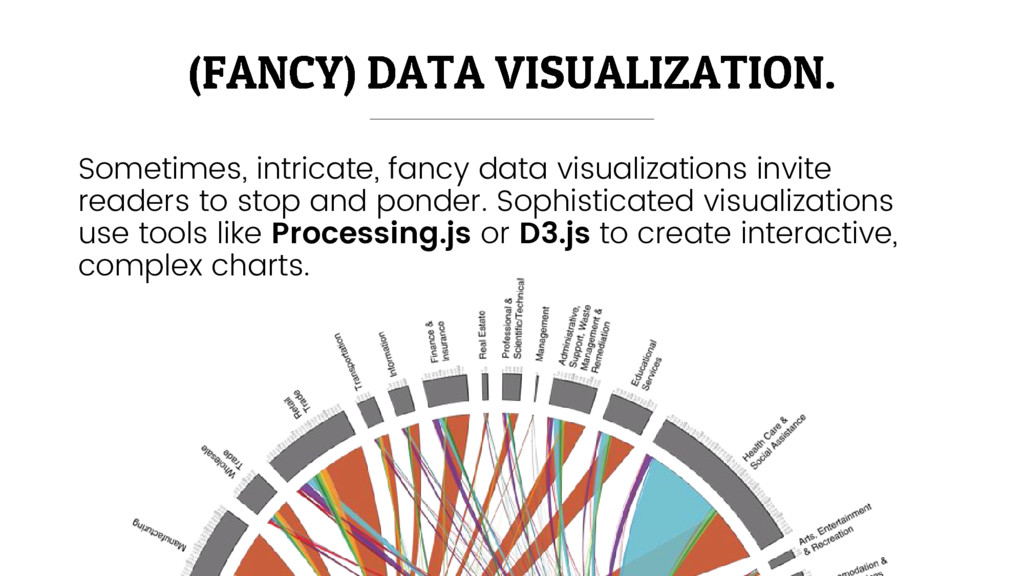
    the mechanism to quickly and effectively communicate research to others. Tools include Microsoft Excel, Adobe Illustrator (print), and a JavaScript library for interactive graphs(e.g., D3, HighCharts, amCharts) Example: http://tomschenkjr.net/blog/felton-annual- report-a-eulogy/
  6. Over 90% of a research project is data organization. Period.

    In government, organizing data includes linking it to systems across the jurisdiction and systems. Such as education-to-workforce records.
  7. Governments spend billions of dollars on new programs. Sometimes on

    just preliminary evidence. Do some of them work?
  8. Sometimes, intricate, fancy data visualizations invite readers to stop and

    ponder. Sophisticated visualizations use tools like Processing.js or D3.js to create interactive, complex charts.
  9. Basic tools are powerful statistics and programming languages like R

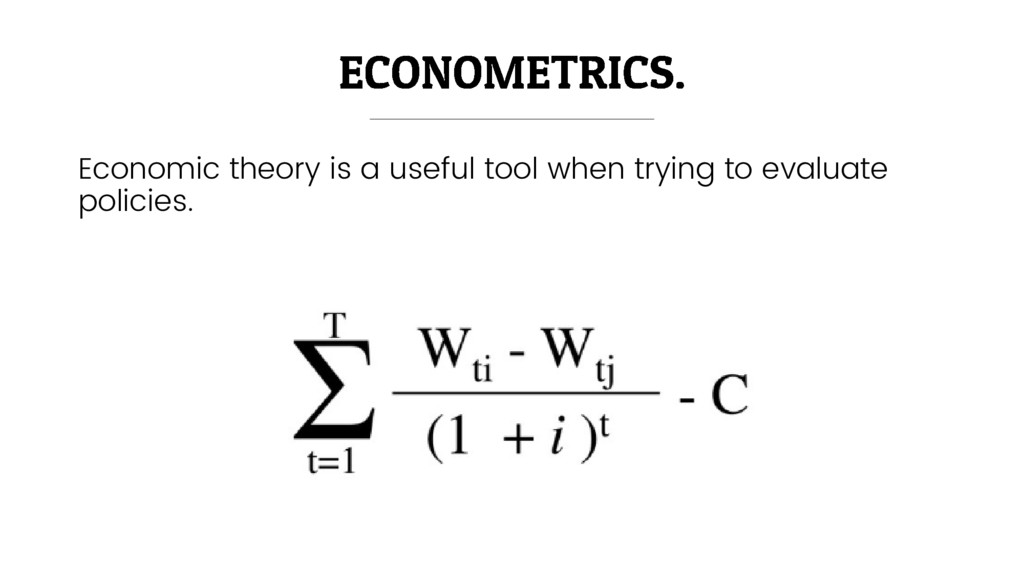
    and Python. These programs can be easily accessed and highly popular.* Technique was using Newton-Rhapson iterations to find roots of a polynomial equation (present value calculation). *STATA was used for thesis.
  10. The expectation for researchers today is the ability to share

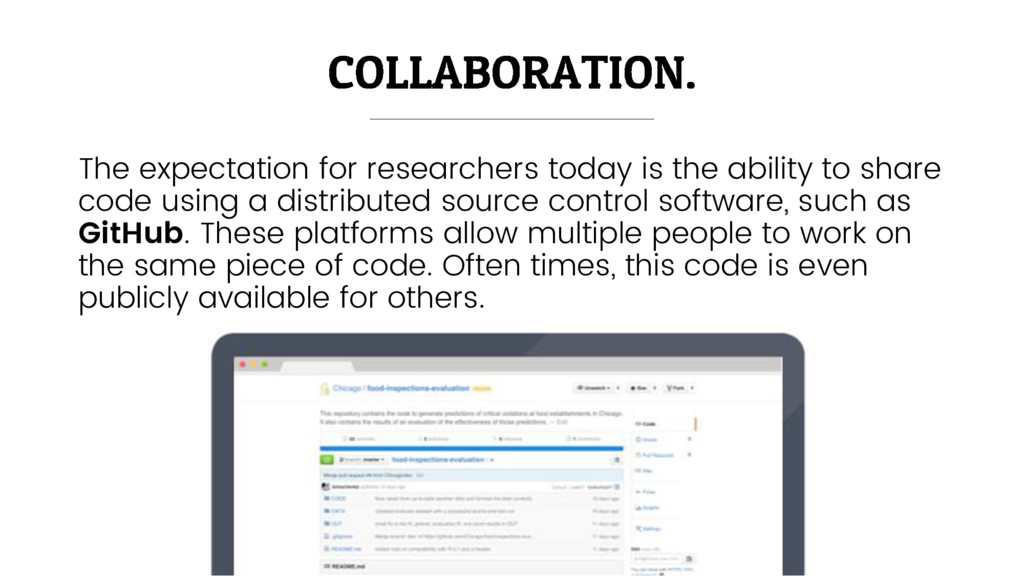
    code using a distributed source control software, such as GitHub. These platforms allow multiple people to work on the same piece of code. Often times, this code is even publicly available for others.
  11. Executive Order Number Seventy-Four: “NOW, THEREFORE, I, Terry E. Branstad,

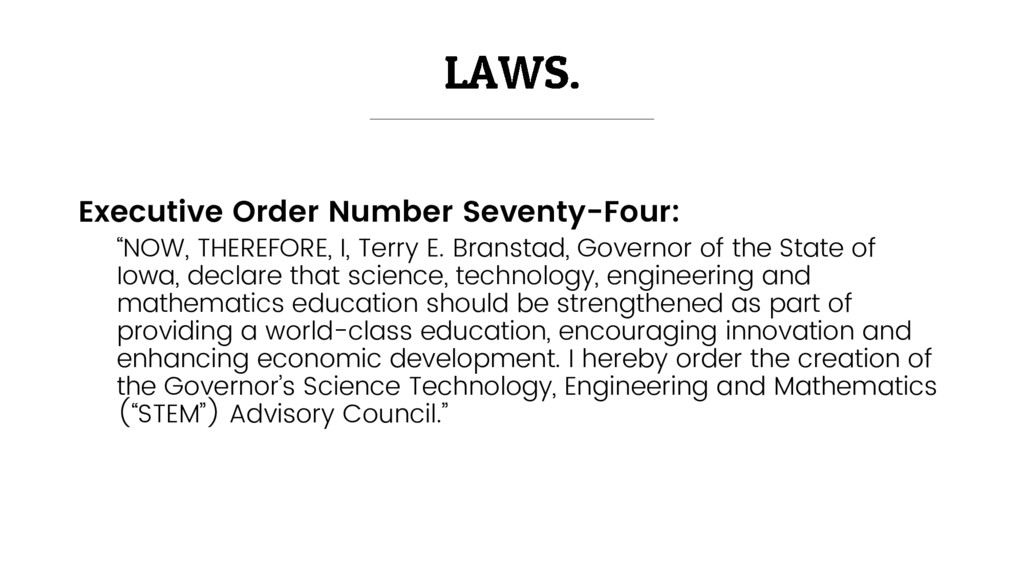
    Governor of the State of Iowa, declare that science, technology, engineering and mathematics education should be strengthened as part of providing a world-class education, encouraging innovation and enhancing economic development. I hereby order the creation of the Governor’s Science Technology, Engineering and Mathematics (“STEM”) Advisory Council.”
  12. demand_function <- function(x, demand_elasticity){ x ^ (1/demand_elasticity) } demand_function_reverse <-

    function(x, demand_elasticity){ x ^ demand_elasticity } supply_function <- function(x, supply_scaler, supply_elasticity){ supply_scaler * x ^ (1/supply_elasticity) } supply_function_reverse <- function(x, supply_scaler, supply_elasticity){ supply_scaler * x ^ supply_elasticity }
  13. Data are stored in a number of ways, not just

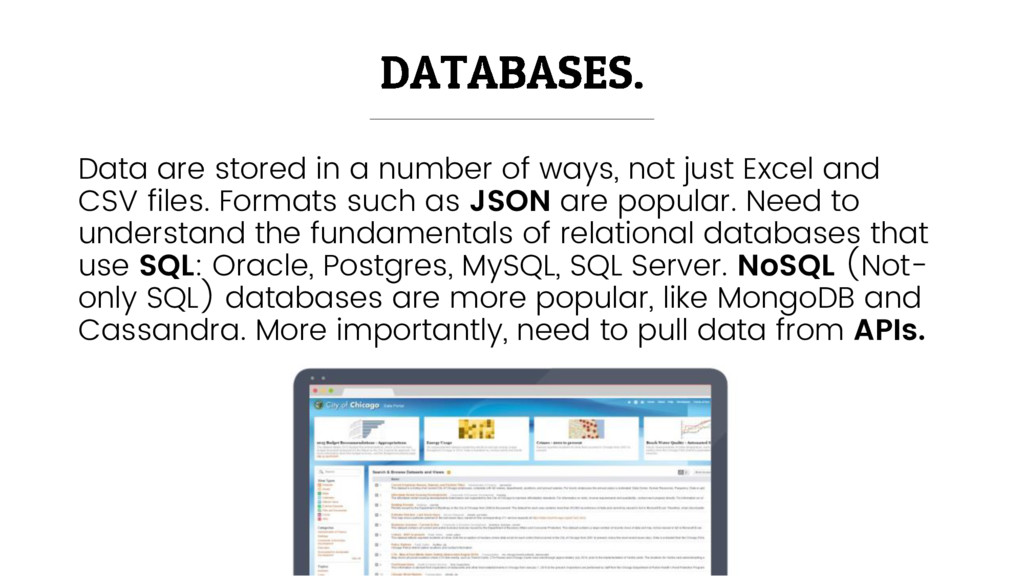
    Excel and CSV files. Formats such as JSON are popular. Need to understand the fundamentals of relational databases that use SQL: Oracle, Postgres, MySQL, SQL Server. NoSQL (Not- only SQL) databases are more popular, like MongoDB and Cassandra. More importantly, need to pull data from APIs.
  14. Computers are superior because they can be automated. More often,

    research is not one-off but a repeated exercise and done automatically.