Upgrade to Pro — share decks privately, control downloads, hide ads and more …

City of #BigData

City of #BigData

Presentation delivered multiple times describing City of Chicago innovation and technology programs.

Tom Schenk Jr

May 04, 2017
Tweet

More Decks by Tom Schenk Jr

Other Decks in Technology

Transcript

  1. CITY OF #BIGDATA
    TOM SCHENK JR.
    CHI EF DATA OFFICER, CITY OF CHICAGO
    @ CHICAGOCDO

    View Slide

  2. Source: techplan.cityofchicago.org
    IN CHICAGO, WE BELIEVE THAT THE
    POWER OF TECHNOLOGY IS DRIVEN
    BY THE PEOPLE WHO USE AND
    BENEFIT FROM IT.

    View Slide

  3. © 2012 _chrisUK CC-BY-ND 2.0

    View Slide

  4. © 2012 _chrisUK CC-BY-ND 2.0

    View Slide

  5. Adapted from © 2012 Steve Vance CC BY-NC-SA 2.0

    View Slide

  6. Adapted from © 2012 Steve Vance CC BY-NC-SA 2.0

    View Slide

  7. Data on potholes are reported by residents and city staff through the 311
    system, which is then reported on the City’s #opendata portal—updated daily.
    data.cityofchicago.org

    View Slide

  8. Chicago has released more #opendata, including important items such as
    crimes, permits, tickets, taxi trips, and most popular library items.
    data.cityofchicago.org/view/caas-knxs

    View Slide

  9. In 2012, Chicago issued
    an executive order which
    formalized the #
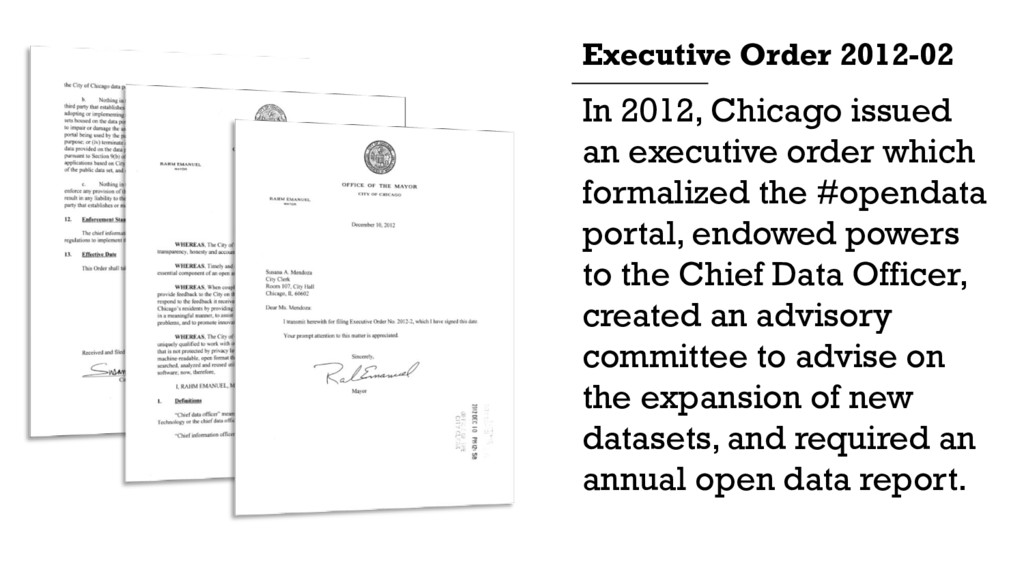
opendata
    portal, endowed powers
    to the Chief Data Officer,
    created an advisory
    committee to advise on
    the expansion of new
    datasets, and required an
    annual open data report.
    Executive Order 2012-02

    View Slide

  10. TECHPLAN.CITYOFCHICAGO.ORG

    View Slide

  11. C
    Leverage data and new technology to
    make government more efficient,
    effective, and open

    View Slide

  12. The City will continue to increase and improve the
    quality 
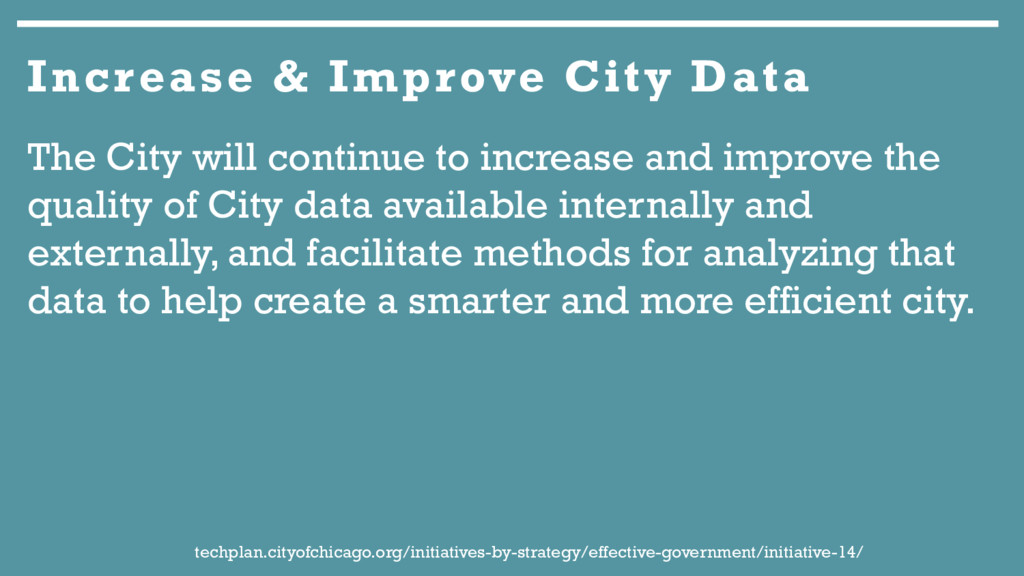
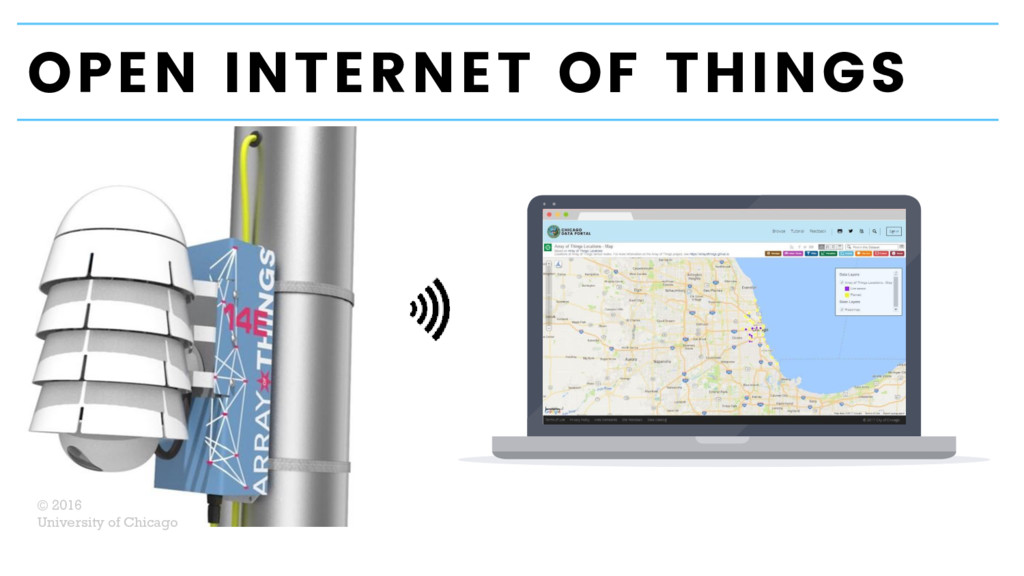
of City data available internally and
    externally, and facilitate methods for analyzing that
    data to help create a smarter and more efficient city.
    Increase & Improve City Data
    techplan.cityofchicago.org/initiatives-by-strategy/effective-government/initiative-14/

    View Slide

  13. #OPENDATA PROVIDES A MEANS
    TO CREATE AN ECOSYSTEM
    AROUND DATA, WHICH INCLUDES
    MULTIPLE STAKEHOLDERS AND
    INITIATIVES THAT EXTEND BEYOND
    TRANSPARENCY.

    View Slide

  14. View Slide

  15. NLC issued a report
    discussing the role of
    Chicago’s leadership 
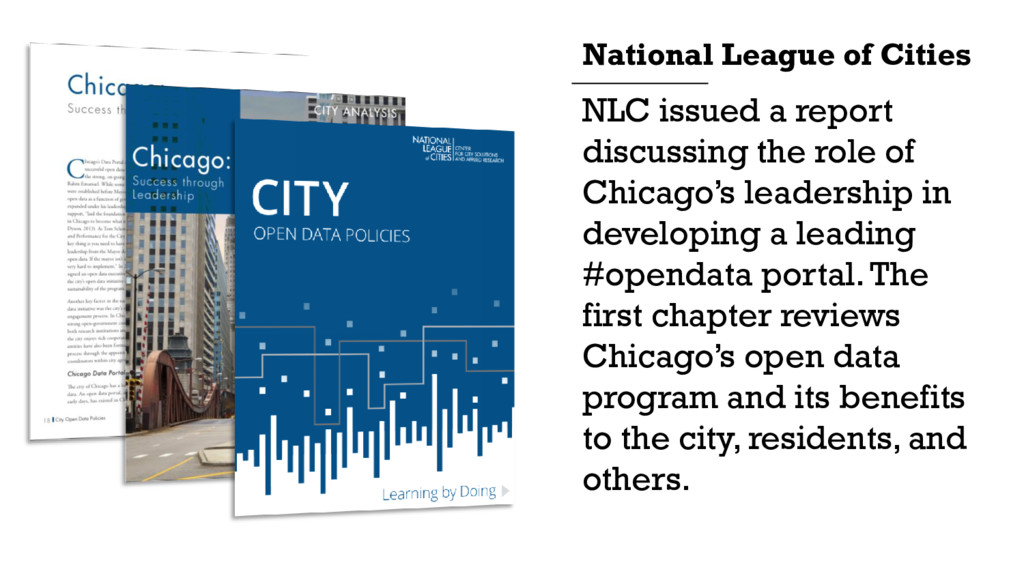
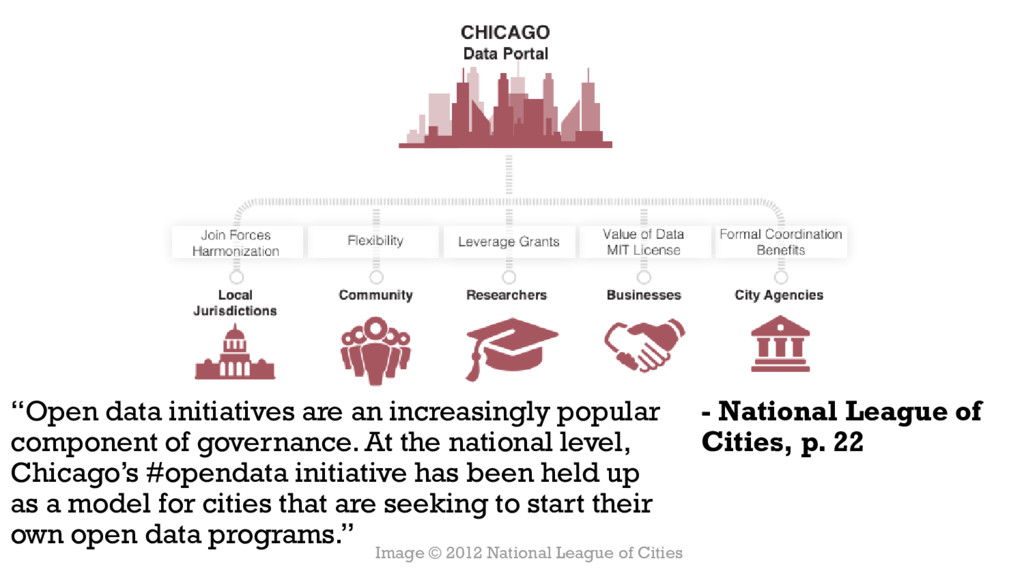
in
    developing a leading
    #opendata portal. The
    first chapter reviews
    Chicago’s open data
    program and its benefits
    to the city, residents, and
    others.
    National League of Cities

    View Slide

  16. - National League of
    Cities, p. 22
    “Open data initiatives are an increasingly popular
    component of governance. At the national level,
    Chicago’s #opendata initiative has been held up
    as a model for cities that are seeking to start their
    own open data programs.”
    Image © 2012 National League of Cities

    View Slide

  17. Civic Tech
    Community
    Chicago has a large, vibrant, productive, civic
    community built around #opendata. This is led by
    Chicago residents interested in technology and
    society that, along with non-profits, help
    Chicagoans.
    © Tom Schenk Jr, 2016. CC-BY

    View Slide

  18. Using #opendata, this
    service developed by
    the civic community
    alerts individuals to
    street sweeping
    activity by providing
    email, text, or
    calendar alerts.
    sweeparound.us

    View Slide

  19. Chicago Flu Shots
    uses #opendata to
    easily find flu-shot
    locations 
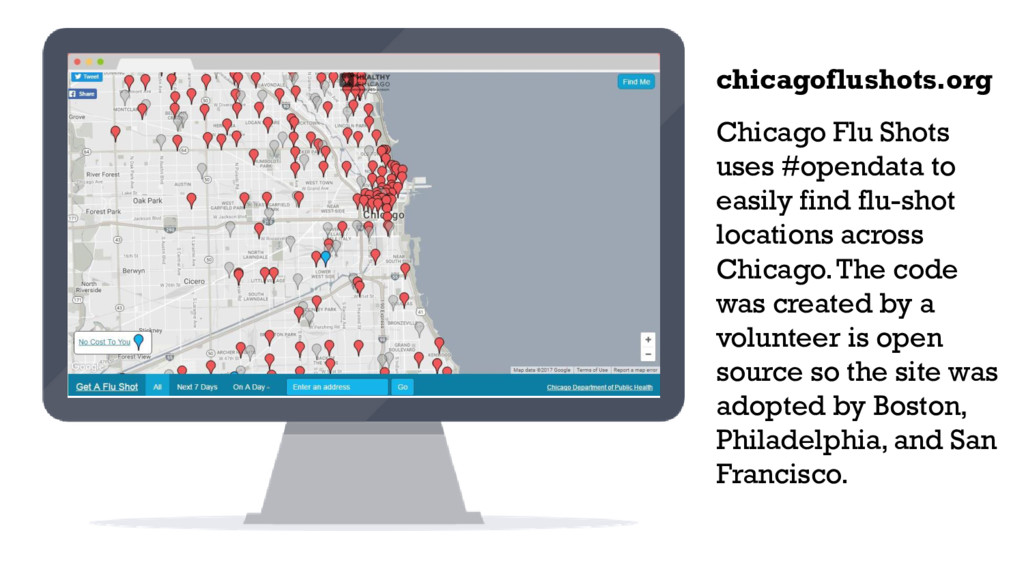
across
    Chicago. The code
    was created by a
    volunteer is open
    source so the site was
    adopted by Boston,
    Philadelphia, and San
    Francisco.
    chicagoflushots.org

    View Slide

  20. The City of Chicago has a
    number of high-quality
    research 
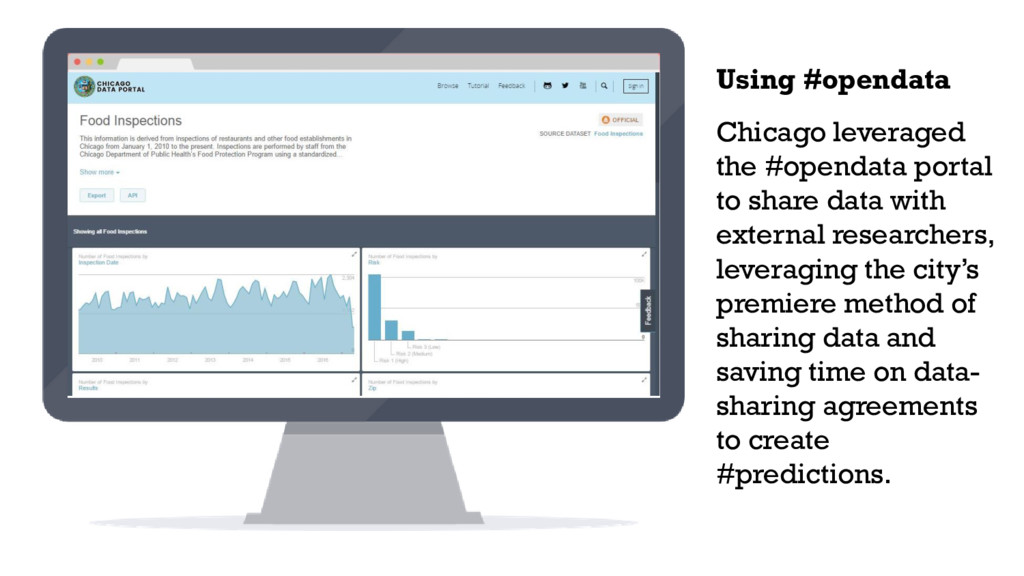
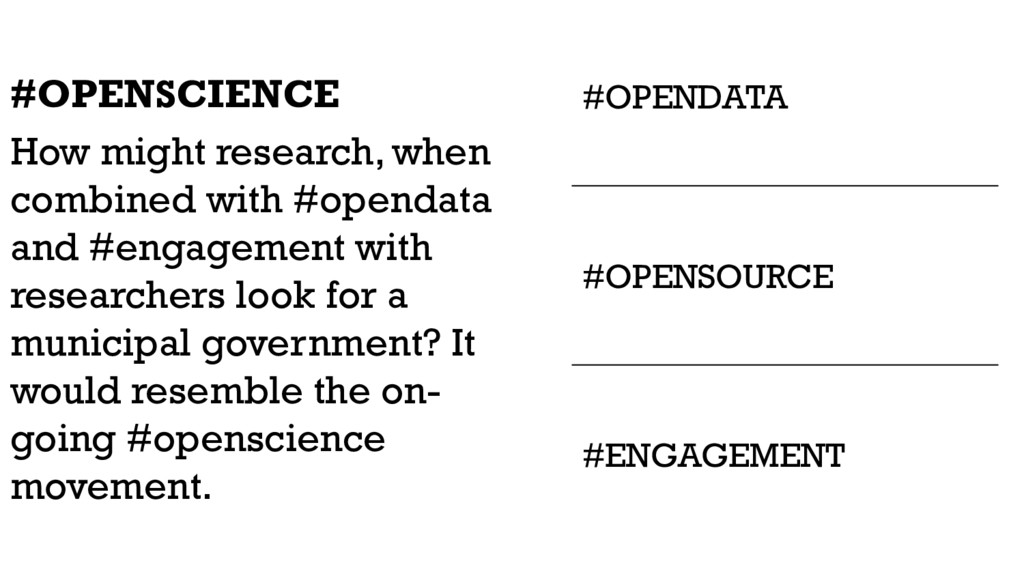
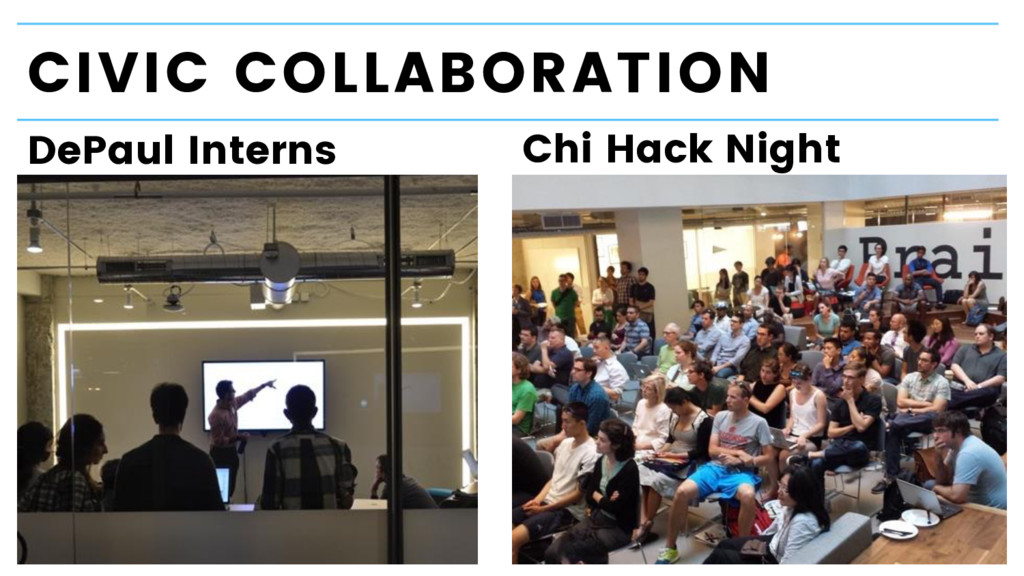
universities and
    groups willing to engage
    in projects with the city.
    We can leverage
    #opendata portal and
    data itself to create
    cooperative
    relationships.
    Academia

    View Slide

  21. Array of Things
    arrayofthings.github.io
    University of Chicago has partnered with multiple
    institutions to build a mesh network of small
    sensors, dubbed the Array of Things, that will
    frequently post data for public consumption.
    © 2015 University of Chicago

    View Slide

  22. The Array of Things will
    provide hyper-local, temporal
    data on using a variety of
    sensors:
    ▪Sensors measuring sound
    and vibration
    ▪Low-resolution infrared
    cameras measuring sidewalk
    temperature
    ▪Climate and
    environmental data, such as
    air-quality and temperature
    Array of Things
    © 2016 University of Chicago

    View Slide

  23. Array of Things
    © 2016 University of Chicago

    View Slide

  24. OPEN INTERNET OF THINGS
    © 2016
    University of Chicago

    View Slide

  25. © 2012 _chrisUK CC-BY-ND 2.0

    View Slide

  26. © 2015 Always Shooting CC-BY 2.0

    View Slide

  27. © 2015 Always Shooting CC-BY 2.0

    View Slide

  28. An #opensource platform
    which allows you to
    explore events such 
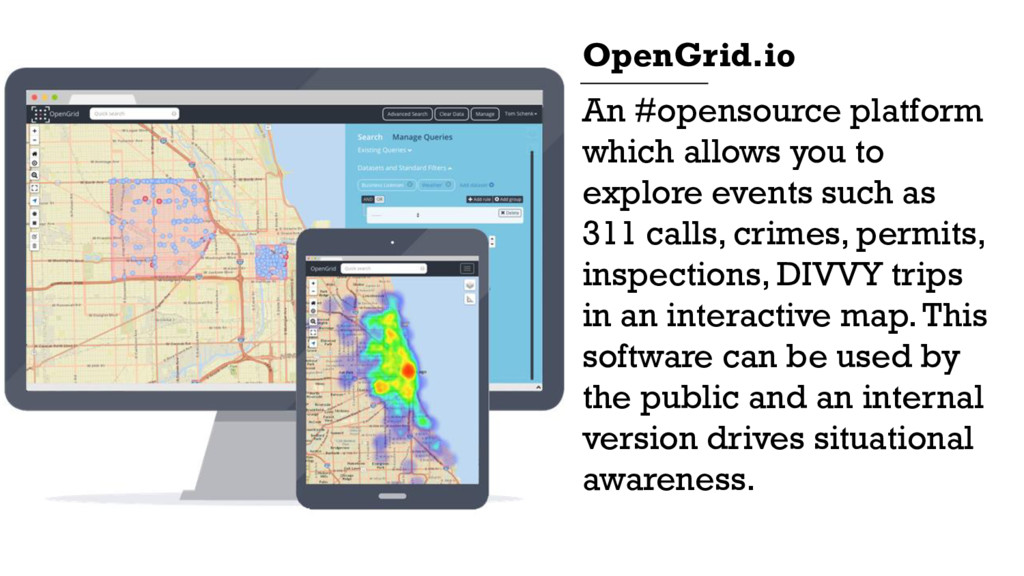
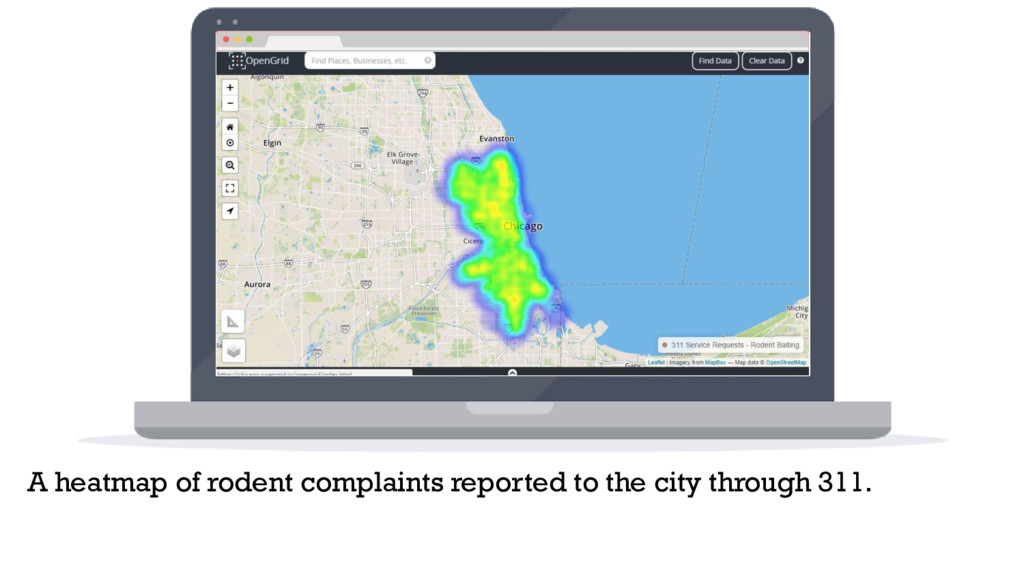
as
    311 calls, crimes, permits,
    inspections, DIVVY trips
    in an interactive map. This
    software can be used by
    the public and an internal
    version drives situational
    awareness.
    OpenGrid.io

    View Slide

  29. View Slide

  30. View Slide

  31. UNDERGROUND INFRASTRUCTURE
    IS HIT ON AVERAGE EVERY 60
    SECONDS. THE TOTAL COST TO THE
    NATIONAL ECONOMY IS ESTIMATED
    TO BE $1.6 BILLION

    View Slide

  32. View Slide

  33. Using off-the-shelf
    DSLR cameras, photos
    are stitched together
    to create 
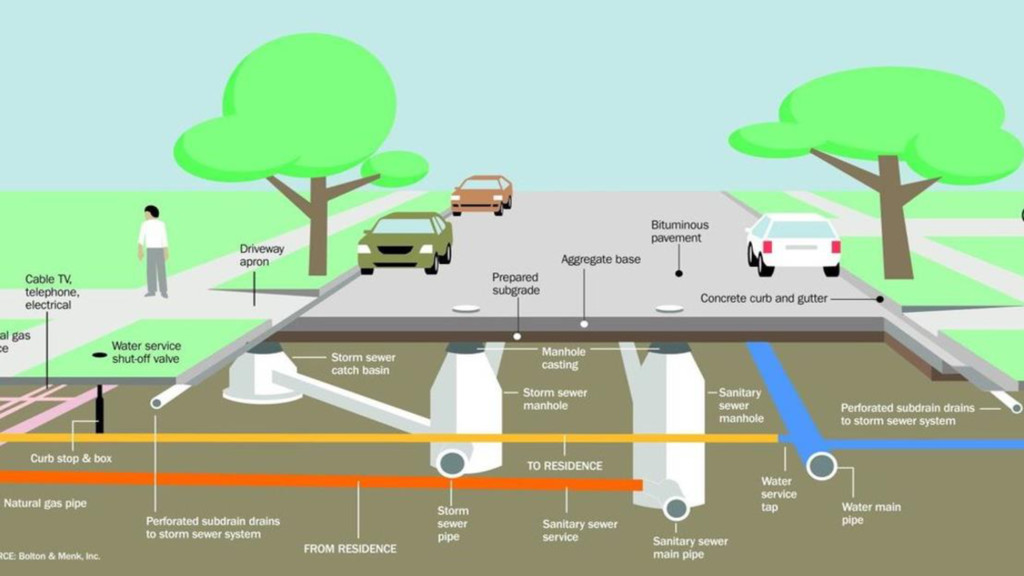
a 3-D model
    of the city’s
    underground
    infrastructure. City
    Digital, City of
    Chicago and a
    consortium of
    partners are piloting
    the tech.
    Underground Map

    View Slide

  34. #Predictions
    Using advanced research
    techniques to forecast and
    predict events in the city.
    #Optimization
    Optimizing the allocation of
    resources across the city to
    for a more efficient city.
    #Evaluation
    Evaluate programs,
    including the effectiveness
    of advanced analytics.

    View Slide

  35. View Slide

  36. A heatmap of rodent complaints reported to the city through 311.

    View Slide

  37. View Slide

  38. City of Chicago found 31
    factors that predicted
    when and 
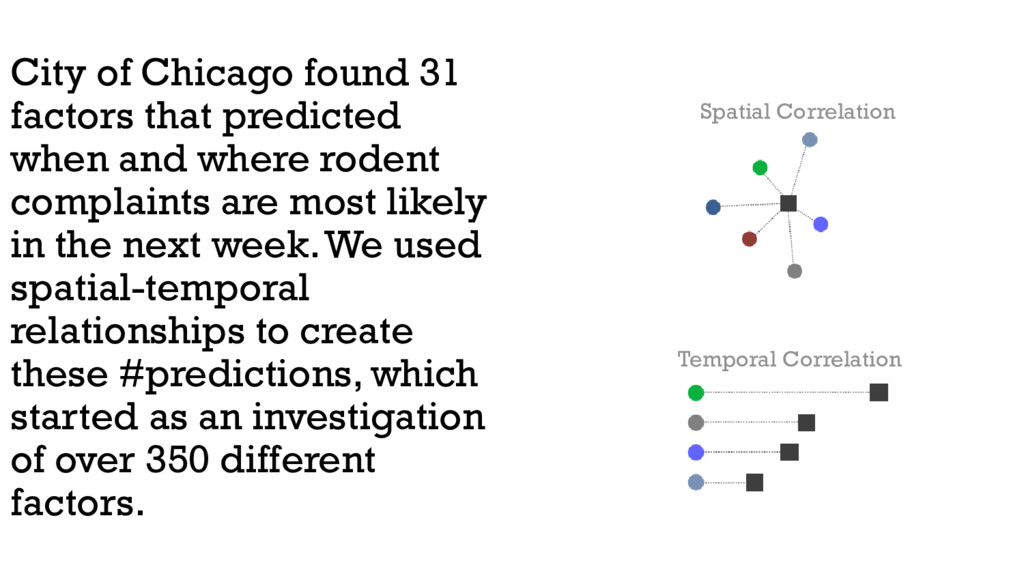
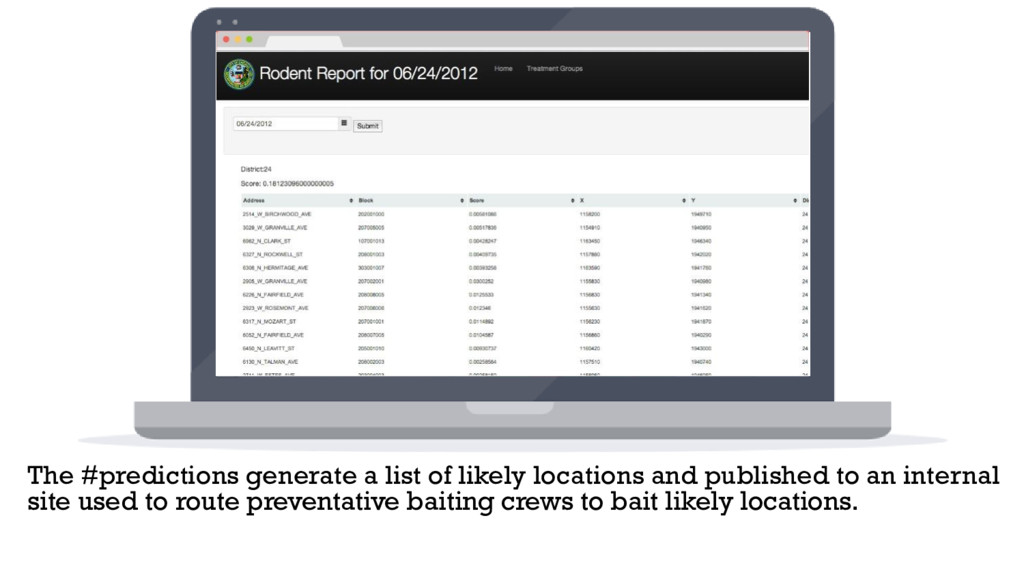
where rodent
    complaints are most likely
    in the next week. We used
    spatial-temporal
    relationships to create
    these #predictions, which
    started as an investigation
    of over 350 different
    factors.
    Spatial Correlation
    Temporal Correlation

    View Slide

  39. The #predictions generate a list of likely locations and published to an internal
    site used to route preventative baiting crews to bait likely locations.

    View Slide

  40. © 2015 PBS Newshour

    View Slide

  41. Image adapted from Michael Mooney’s Little Chicago (CC-BY 2.0).

    View Slide

  42. Chicago leveraged
    the #opendata portal
    to share data with
    external researchers,
    leveraging the city’s
    premiere method of
    sharing data and
    saving time on data-
    sharing agreements
    to create
    #predictions.
    Using #opendata

    View Slide

  43. Establishments with previous critical or
    serious violations
    Three-day average high 
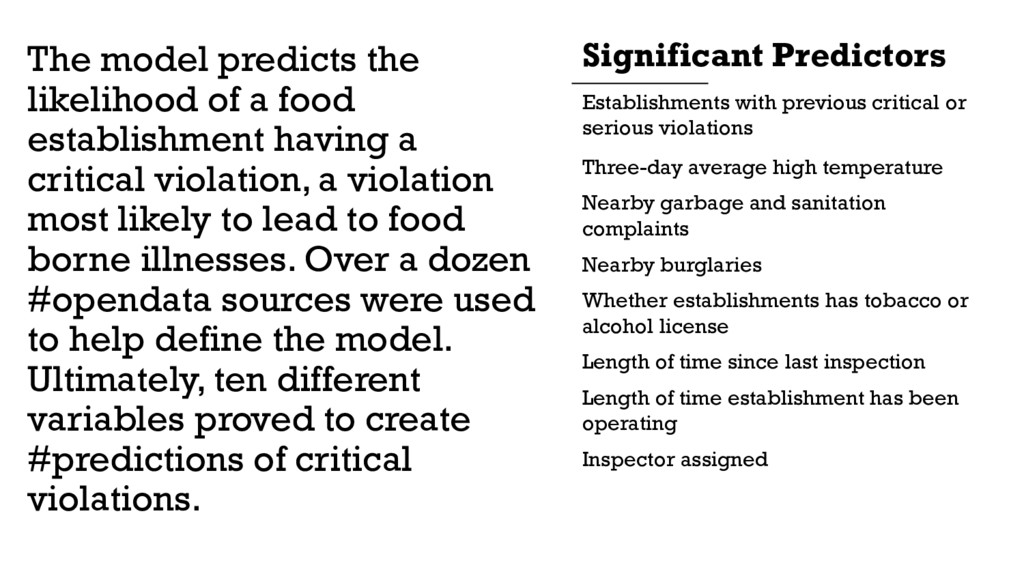
temperature
    Nearby garbage and sanitation
    complaints
    Nearby burglaries
    Whether establishments has tobacco or
    alcohol license
    Length of time since last inspection
    Length of time establishment has been
    operating
    Inspector assigned
    The model predicts the
    likelihood of a food
    establishment having a
    critical violation, a violation
    most likely to lead to food
    borne illnesses. Over a dozen
    #opendata sources were used
    to help define the model.
    Ultimately, ten different
    variables proved to create
    #predictions of critical
    violations.
    Significant Predictors

    View Slide

  44. The #predictions revealed
    an opportunity to find
    deliver results faster. 
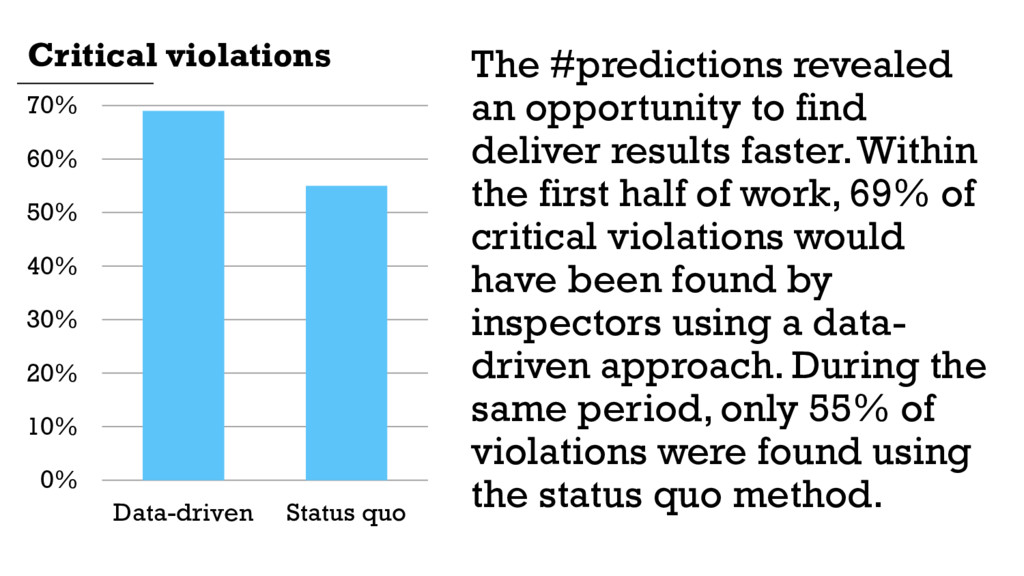
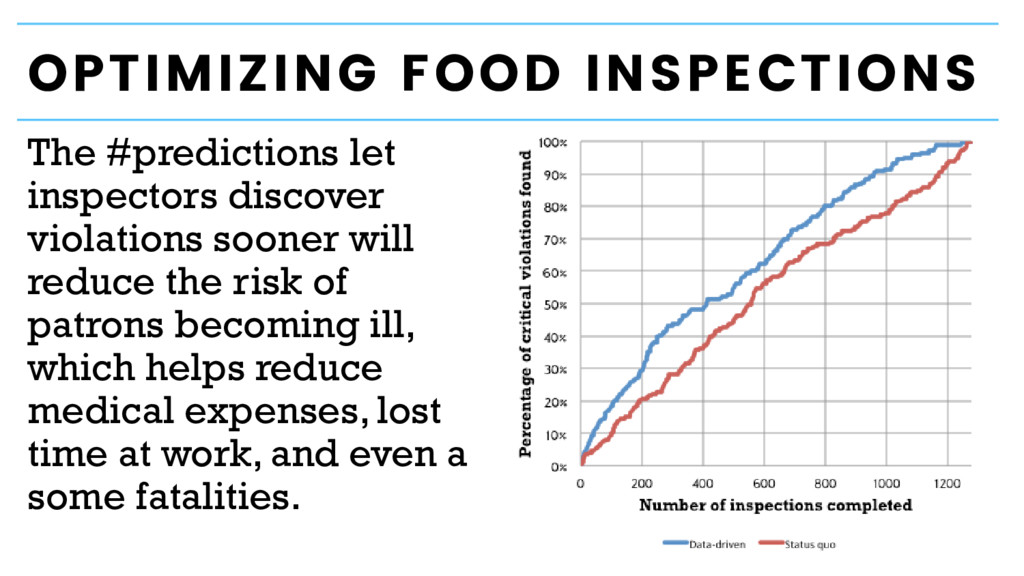
Within
    the first half of work, 69% of
    critical violations would
    have been found by
    inspectors using a data-
    driven approach. During the
    same period, only 55% of
    violations were found using
    the status quo method.
    Critical violations
    Data-driven Status quo
    0%
    10%
    20%
    30%
    40%
    50%
    60%
    70%

    View Slide

  45. The food inspection model is able
    to deliver results faster.
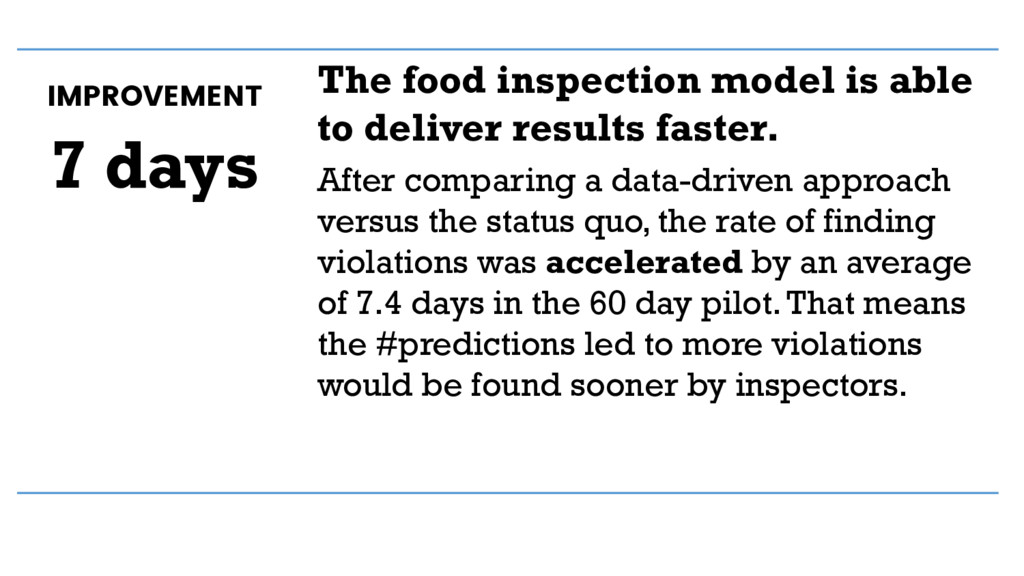
    After comparing a data-driven approach
    versus the status quo, the rate of finding
    violations was accelerated by an average
    of 7.4 days in the 60 day pilot. That means
    the #predictions led to more violations
    would be found sooner by inspectors.
    IMPROVEMENT
    7 days

    View Slide

  46. OPTIMIZING FOOD INSPECTIONS
    The #predictions let
    inspectors discover
    violations sooner will
    reduce the risk of
    patrons becoming ill,
    which helps reduce
    medical expenses, lost
    time at work, and even a
    some fatalities.

    View Slide

  47. The data science team has built a website which lets CDPH prioritize
    inspections based on #predictions.

    View Slide

  48. The analytical model
    will be released as an
    open source 
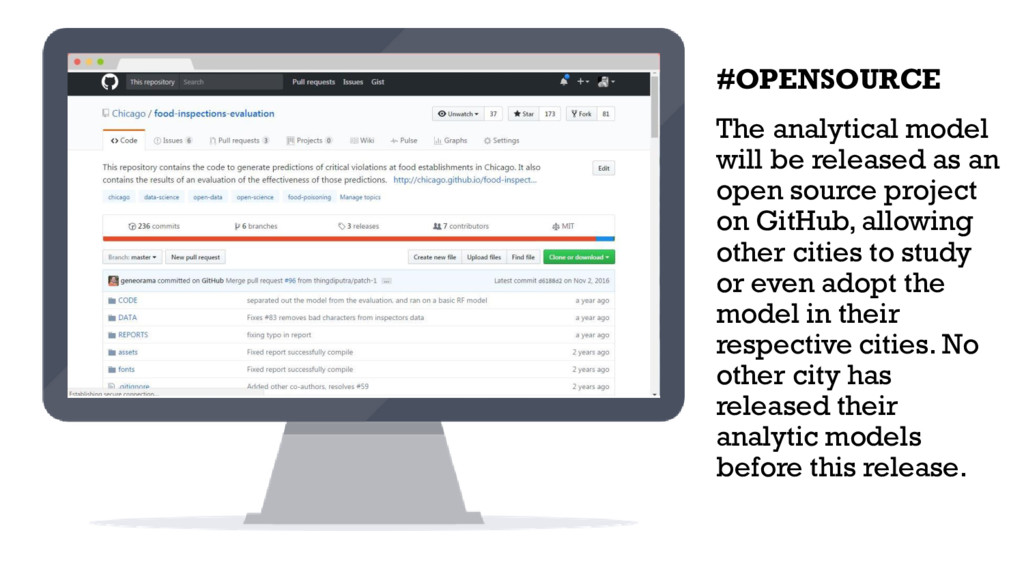
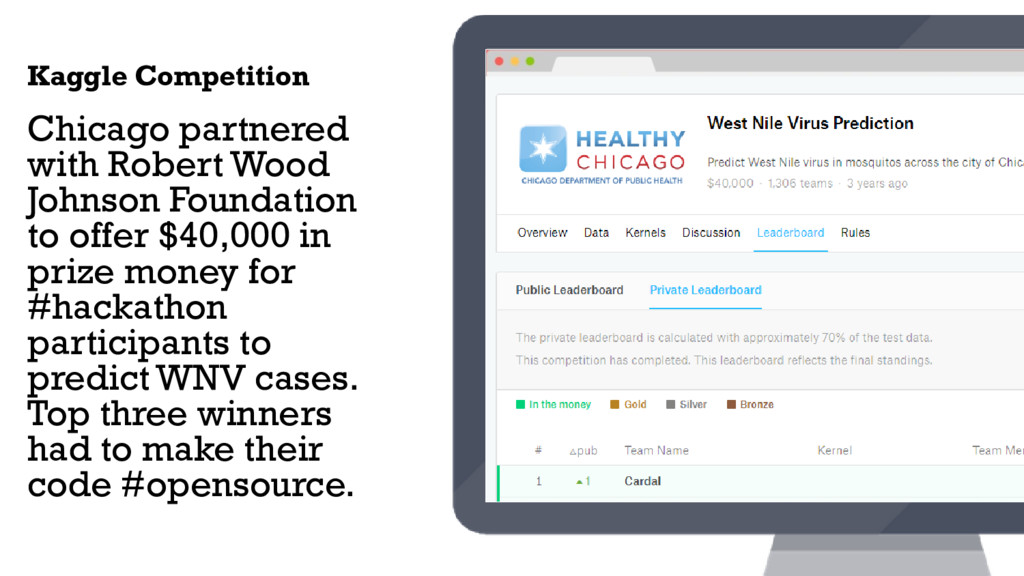
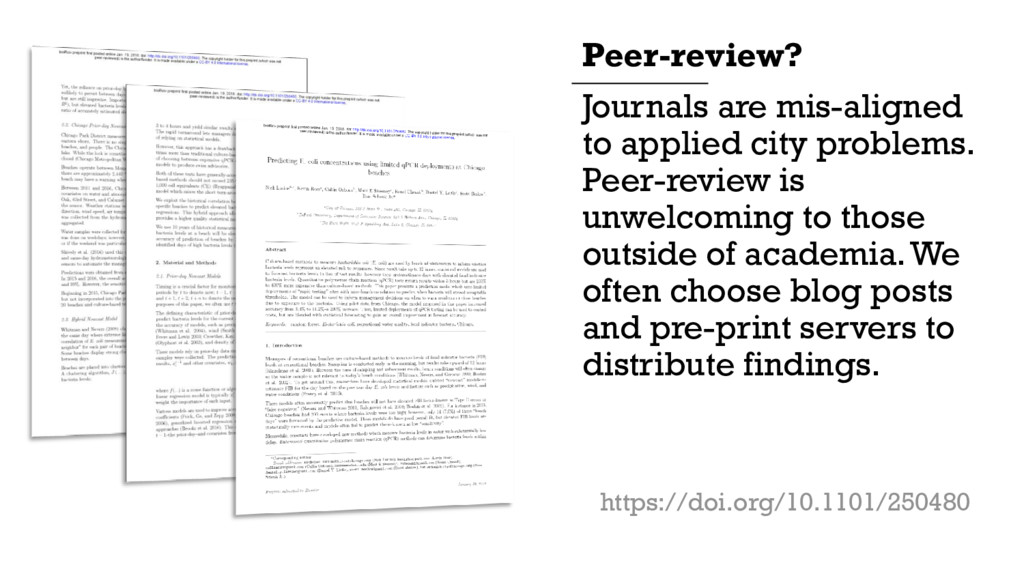
project
    on GitHub, allowing
    other cities to study
    or even adopt the
    model in their
    respective cities. No
    other city has
    released their
    analytic models
    before this release.
    #OPENSOURCE

    View Slide

  49. View Slide

  50. D
    Work with civic technology
    innovators to develop creative
    solutions to city challenges

    View Slide

  51. View Slide

  52. WEST NILE VIRUS
    CURTAILING VECTOR-BORN DISEASES

    View Slide

  53. WEST NILE VIRUS
    • Between 5 and 884 human cases
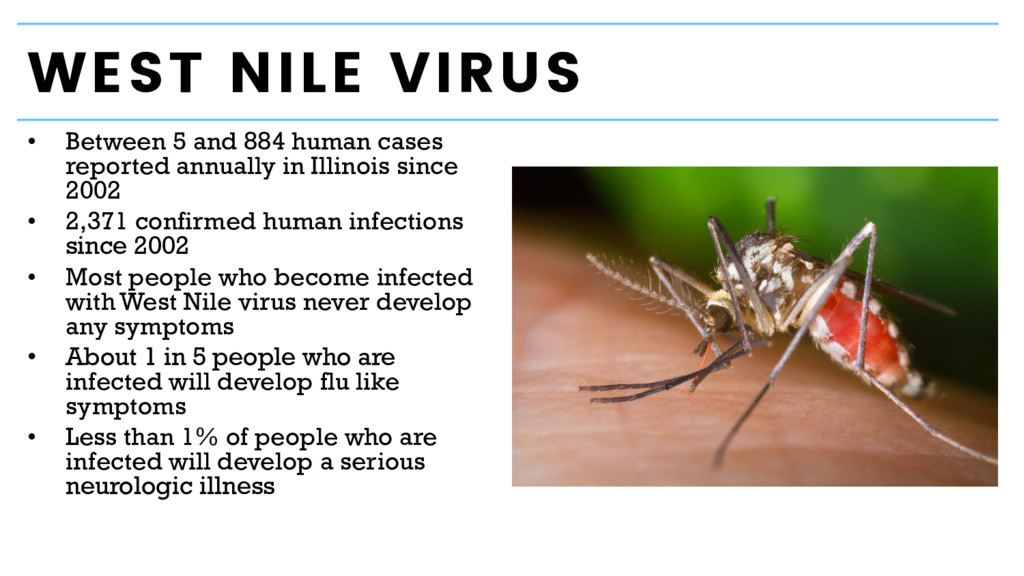
    reported annually in Illinois since
    2002
    • 2,371 confirmed human infections
    since 2002
    • Most people who become infected
    with West Nile virus never develop
    any symptoms
    • About 1 in 5 people who are
    infected will develop flu like
    symptoms
    • Less than 1% of people who are
    infected will develop a serious
    neurologic illness

    View Slide

  54. PREVENTION & COLLECTION
    • The Chicago Department of Public Health 
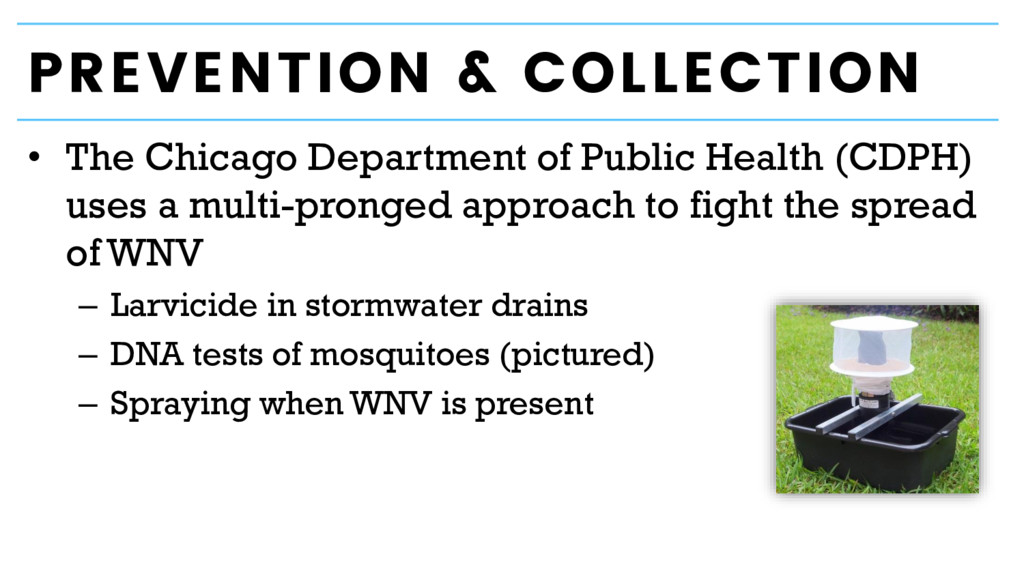
(CDPH)
    uses a multi-pronged approach to fight the spread
    of WNV
    – Larvicide in stormwater drains
    – DNA tests of mosquitoes (pictured)
    – Spraying when WNV is present

    View Slide

  55. DNA MONITORING
    • At any given time there are 60+
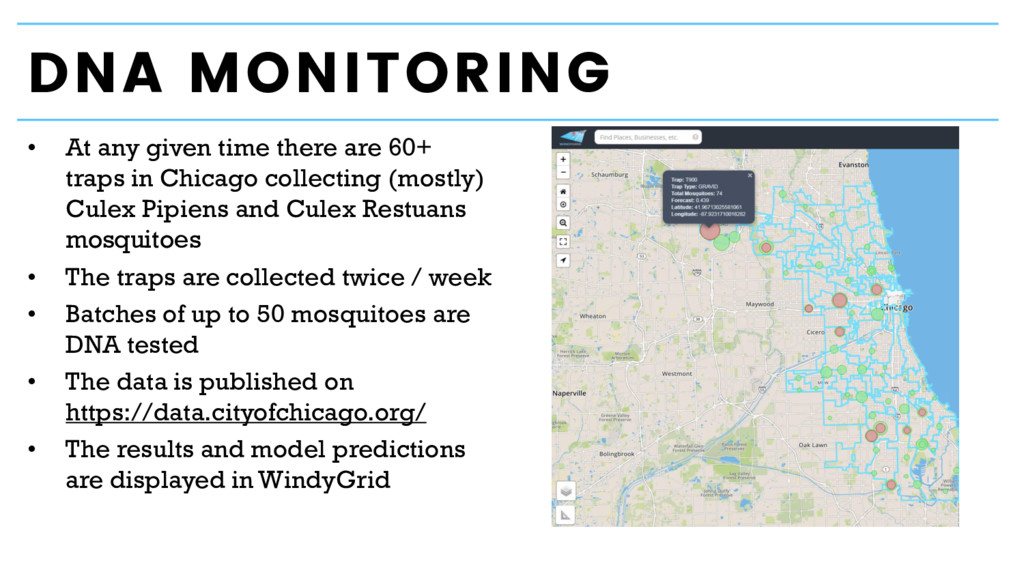
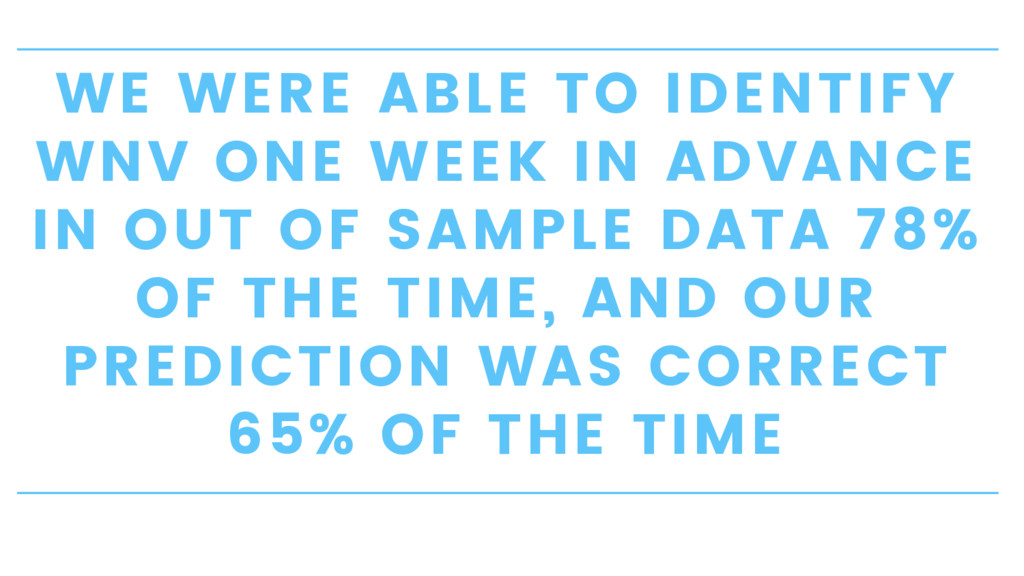
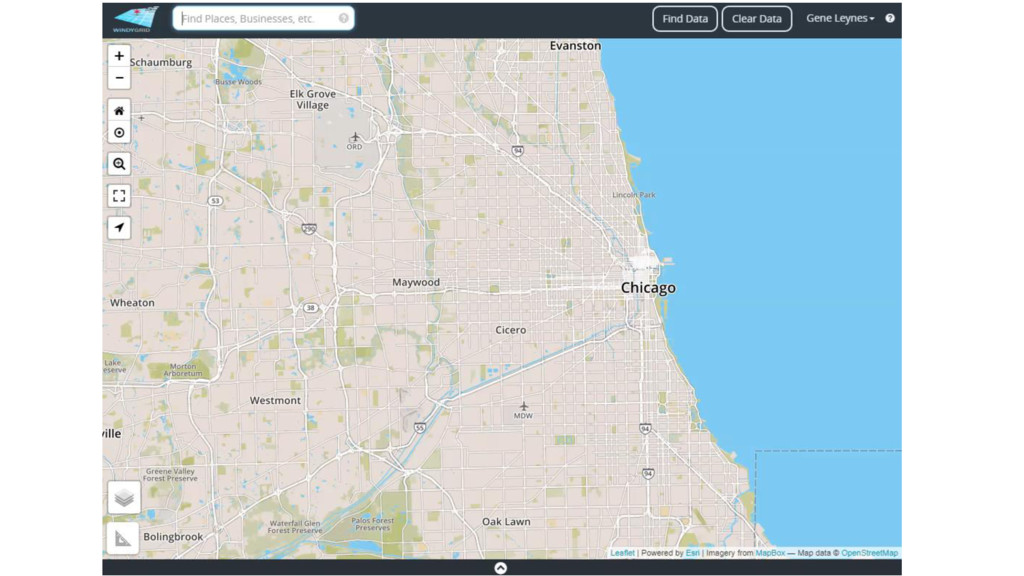
    traps in Chicago collecting (mostly)
    Culex Pipiens and Culex Restuans
    mosquitoes
    • The traps are collected twice / week
    • Batches of up to 50 mosquitoes are
    DNA tested
    • The data is published on
    https://data.cityofchicago.org/
    • The results and model predictions
    are displayed in WindyGrid

    View Slide

  56. Chicago partnered
    with Robert Wood
    Johnson Foundation
    to offer $40,000 in
    prize money for
    #hackathon
    participants to
    predict WNV cases.
    Top three winners
    had to make their
    code #opensource.
    Kaggle Competition

    View Slide

  57. WE WERE ABLE TO IDENTIFY
    WNV ONE WEEK IN ADVANCE
    IN OUT OF SAMPLE DATA 78%
    OF THE TIME, AND OUR
    PREDICTION WAS CORRECT
    65% OF THE TIME

    View Slide

  58. View Slide

  59. #OPENDATA
    #OPENSCIENCE
    How might research, when
    combined with #opendata
    and #engagement with
    researchers look for a
    municipal government? It
    would resemble the on-
    going #openscience
    movement.
    #OPENSOURCE
    #ENGAGEMENT

    View Slide

  60. CLEAR WATER
    FORECASTING CHICAGO’S WATER QUALITY

    View Slide

  61. View Slide

  62. Chicago
    Beaches
    More than 20 million visitors visit the beach
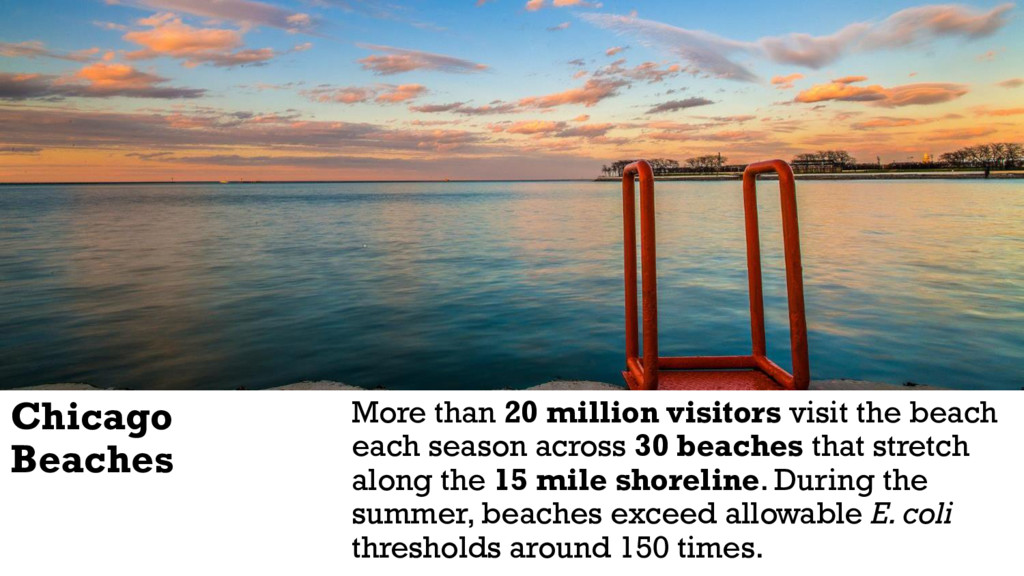
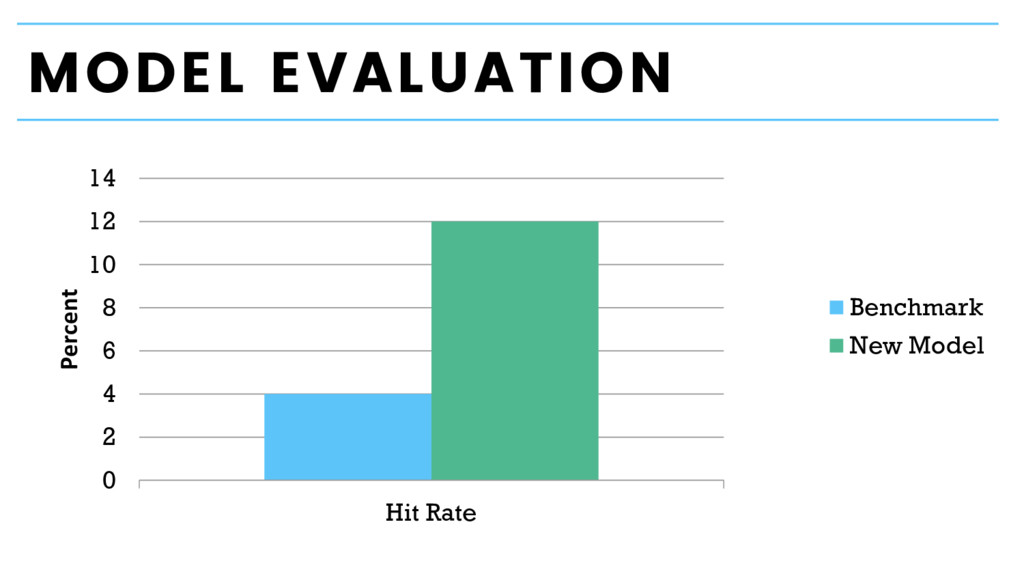
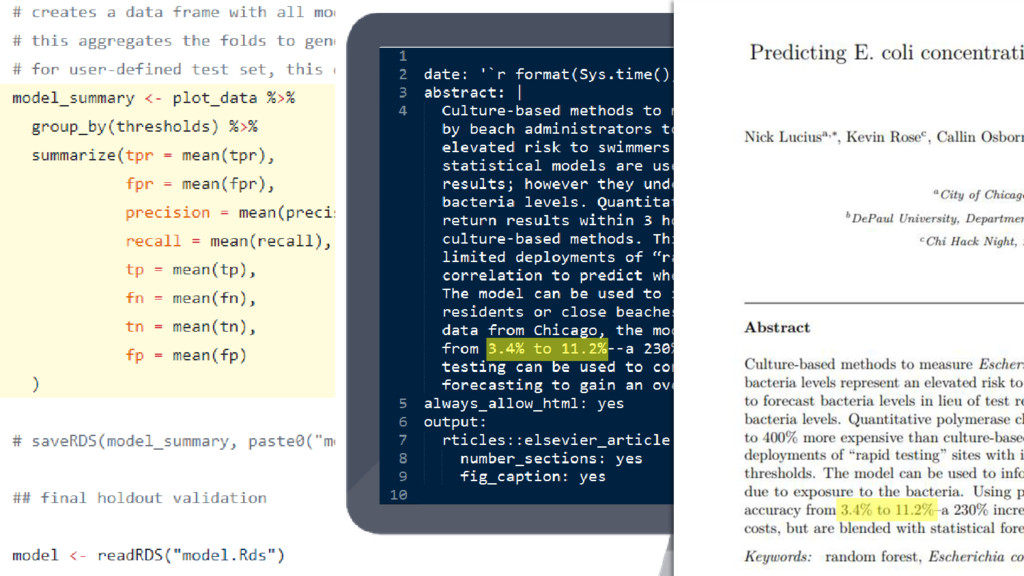
    each season across 30 beaches that stretch
    along the 15 mile shoreline. During the
    summer, beaches exceed allowable E. coli
    thresholds around 150 times.

    View Slide

  63. CIVIC COLLABORATION
    DePaul Interns Chi Hack Night

    View Slide

  64. MODEL EVALUATION
    0
    2
    4
    6
    8
    10
    12
    14
    Hit Rate
    Percent
    Benchmark
    New Model

    View Slide

  65. WATER QUALITY
    ADVISORIES ISSUED WITH
    3 TIMES MORE ACCURACY
    THEN PREVIOUS MODEL

    View Slide

  66. Total hours dedicated to this project through
    volunteers, Chi Hack Night, and students.
    1,000 HOURS

    View Slide

  67. GITHUB PUNCH CARD

    View Slide

  68. View Slide

  69. Journals are mis-aligned
    to applied city problems.
    Peer-review is
    unwelcoming to those
    outside of academia. We
    often choose blog posts
    and pre-print servers to
    distribute findings.
    https://doi.org/10.1101/250480
    Peer-review?

    View Slide

  70. View Slide

  71. LEAD SAFE

    View Slide

  72. View Slide

  73. LEAD SAFE
    FOR HEALTH NETWORKS
    COMING SOON…

    View Slide

  74. View Slide

  75. View Slide

  76. View Slide

  77. View Slide

  78. View Slide

  79. View Slide

  80. View Slide

  81. View Slide

  82. Based out of Harvard’s Kennedy School of
    Government, Civic Analytics 
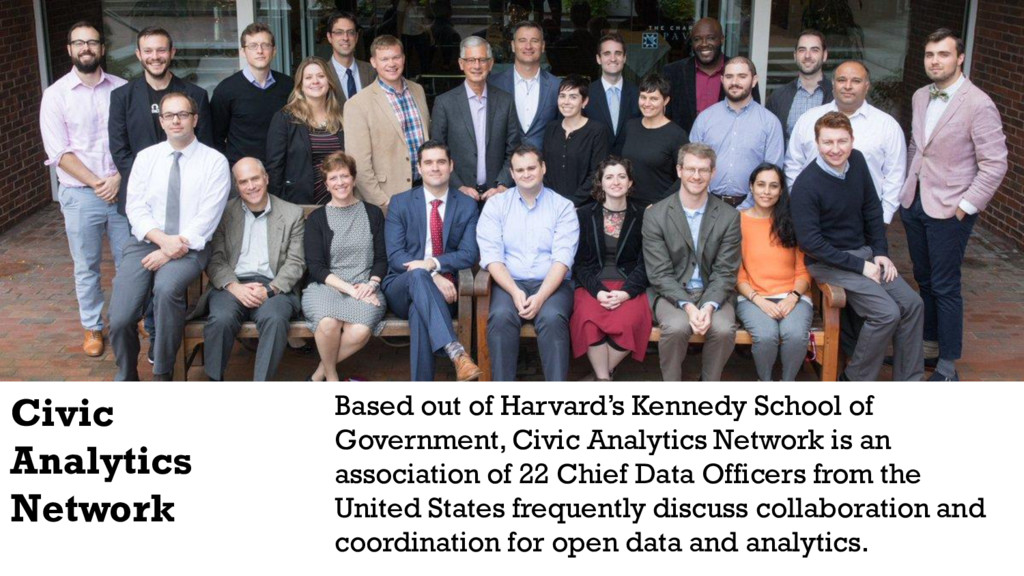
Network is an
    association of 22 Chief Data Officers from the
    United States frequently discuss collaboration and
    coordination for open data and analytics.
    Civic
    Analytics
    Network

    View Slide

  83. THANK YOU
    Contact Info:
    Websites:
    Tom Schenk Jr.
    Chief Data Officer
    City of Chicago
    @ChicagoCDO
    [email protected]
    data.cityofchicago.org
    digital.cityofchicago.org
    opengrid.io
    techplan.cityofchicago.org
    speakerdeck.com/tomschenkjr

    View Slide