Upgrade to Pro — share decks privately, control downloads, hide ads and more …

popmon: population shift monitoring made easy

popmon: population shift monitoring made easy

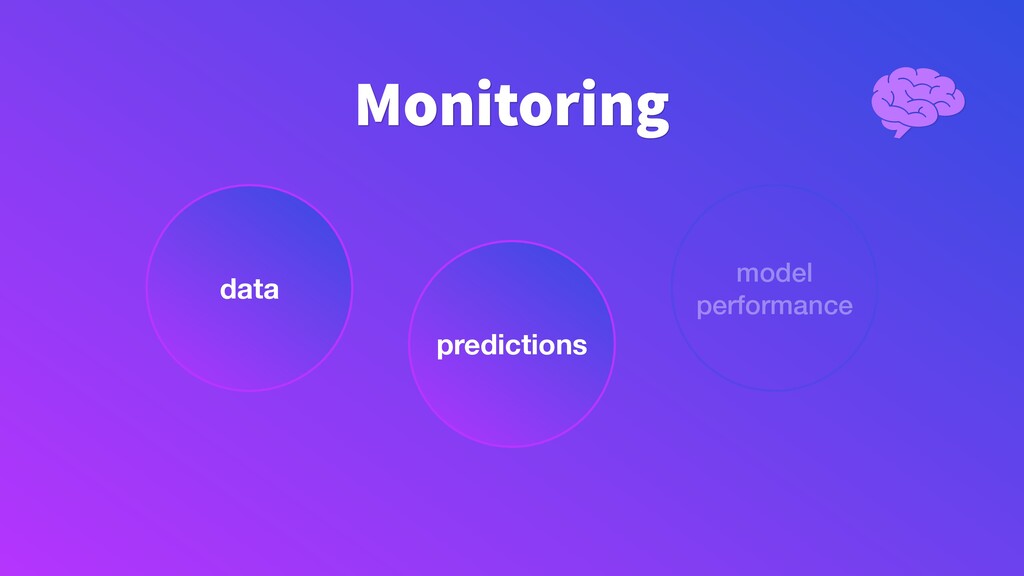
Tracking model performance is crucial to guarantee that a model behaves as designed initially. Predictions may be way ahead in time, so the performance can only be verified later, for example, in one year. Taking actions at that point might be already too late. Typical model performance questions are: is the model performing as expected, and are predictions made on current incoming data still valid?

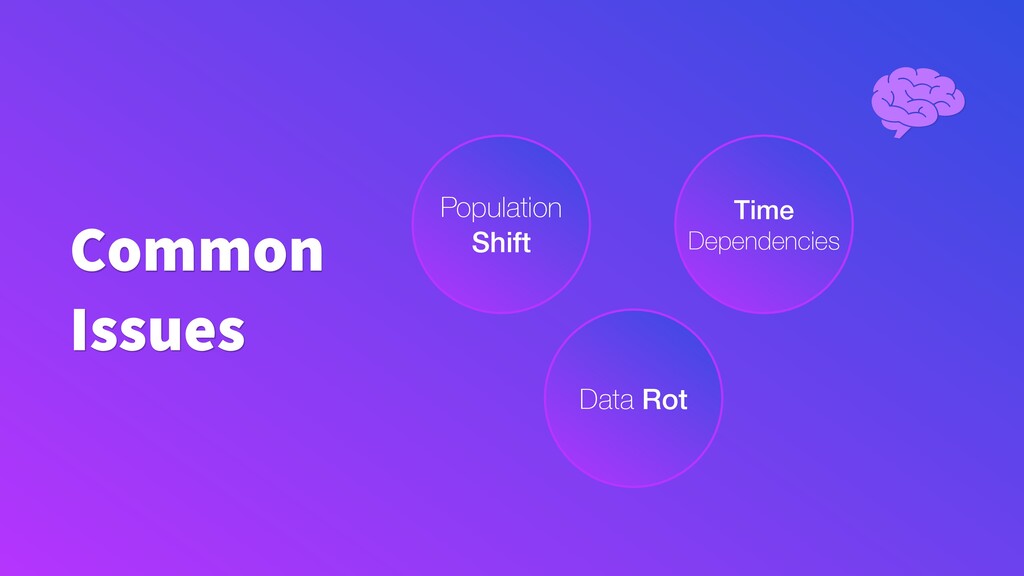
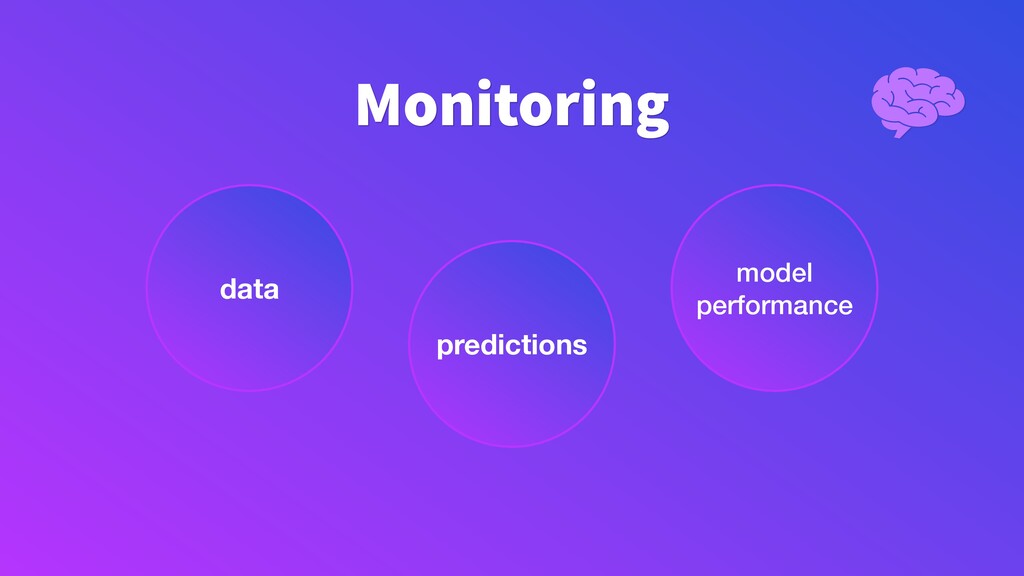
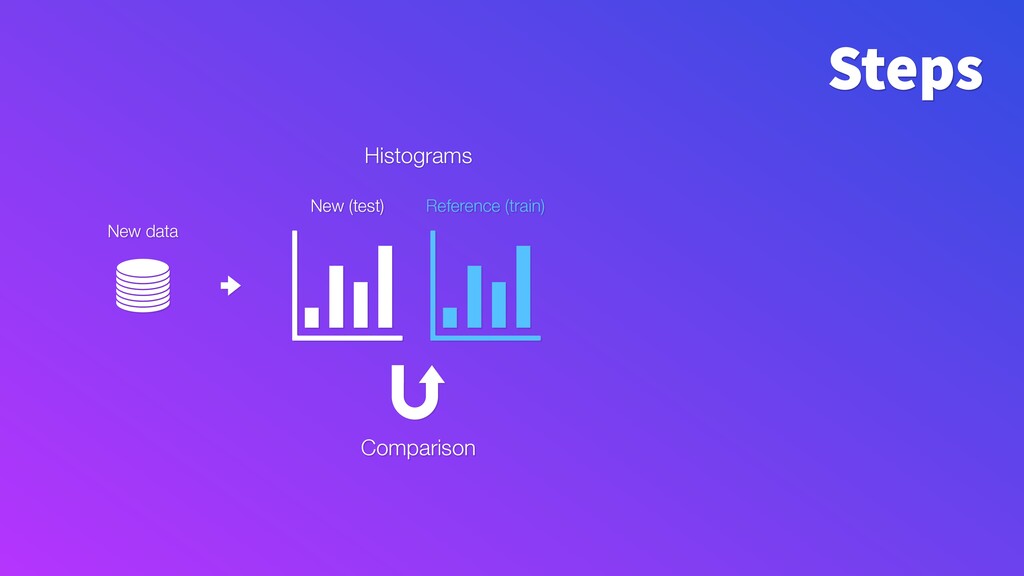
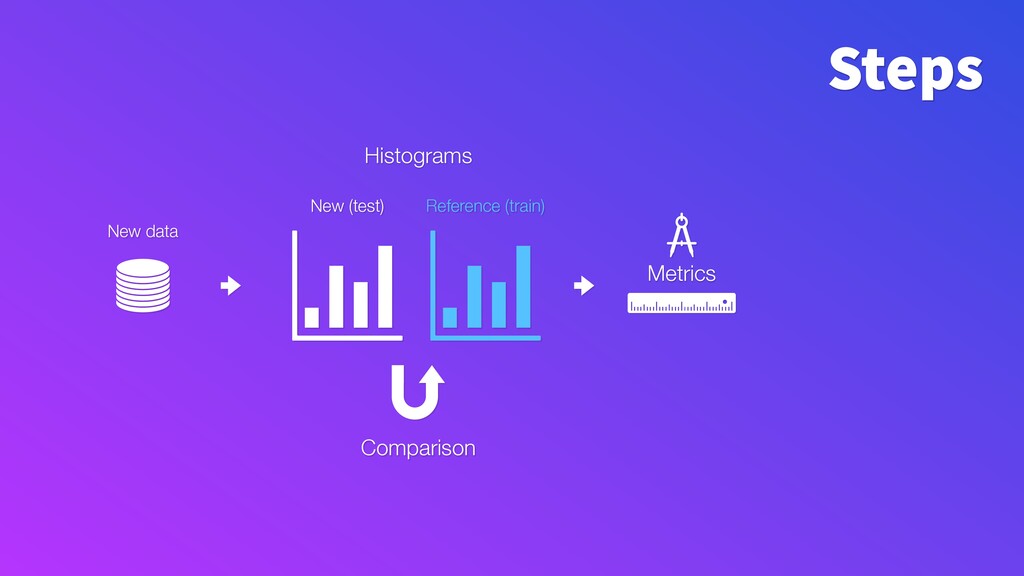
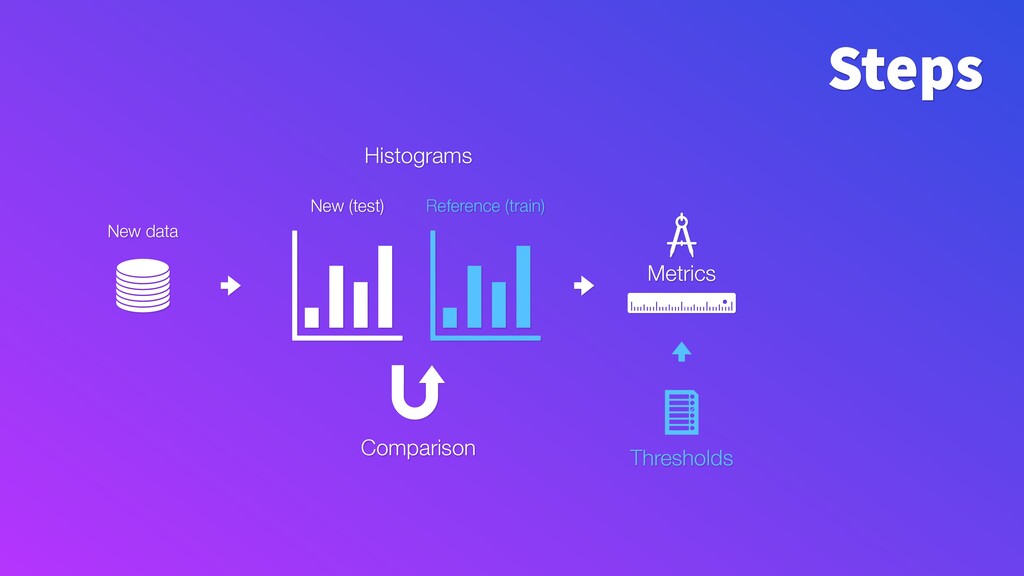
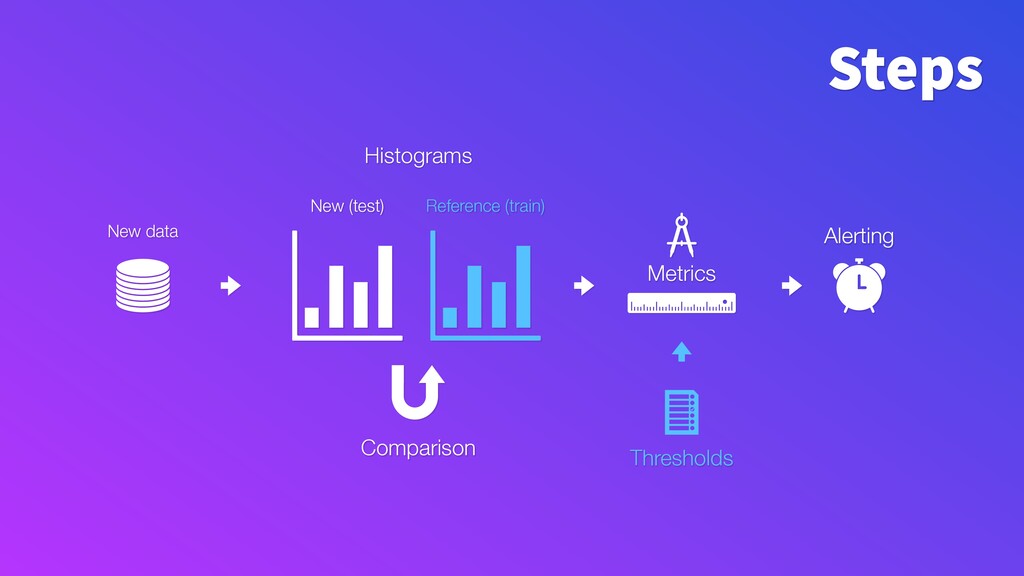
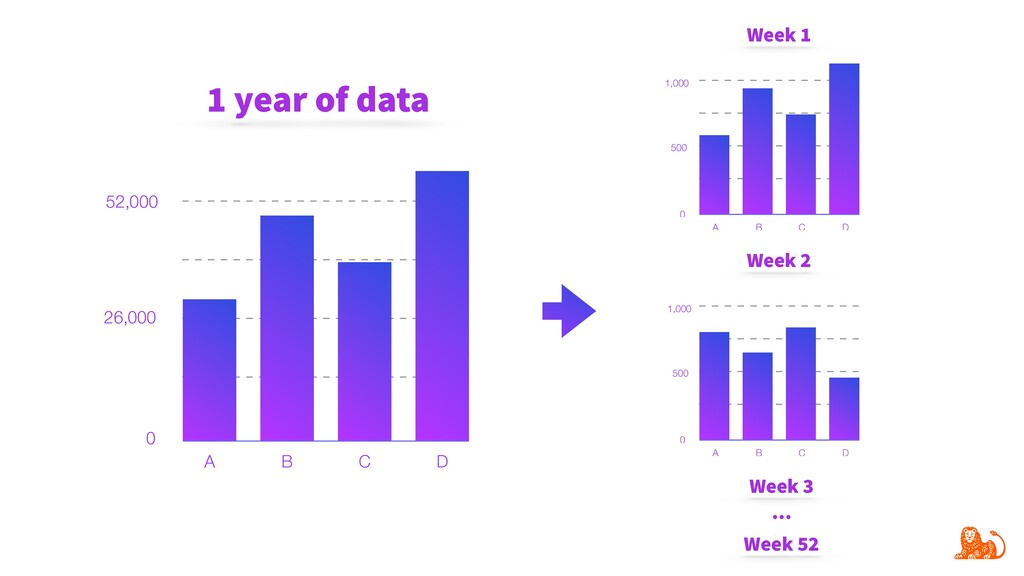
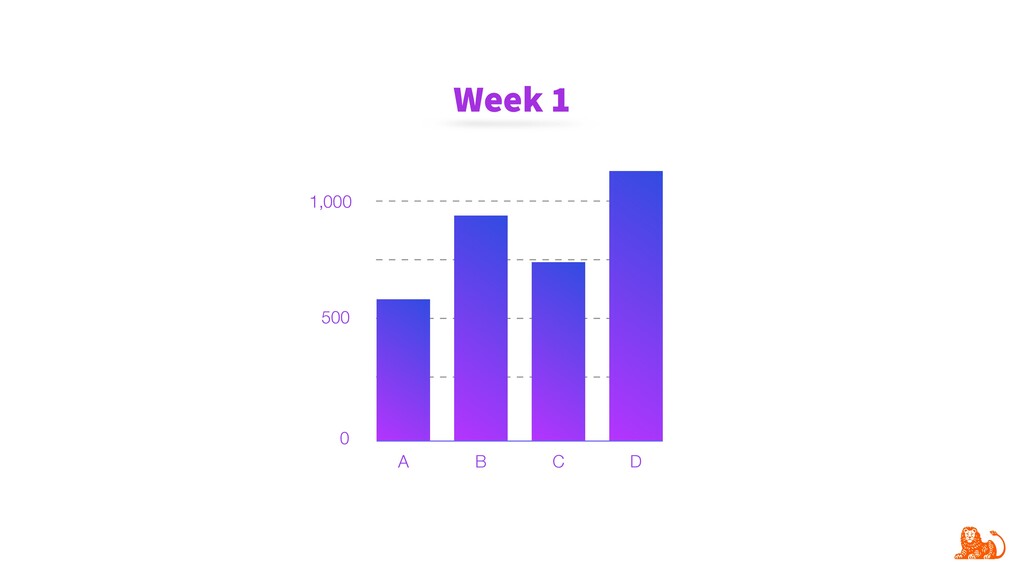
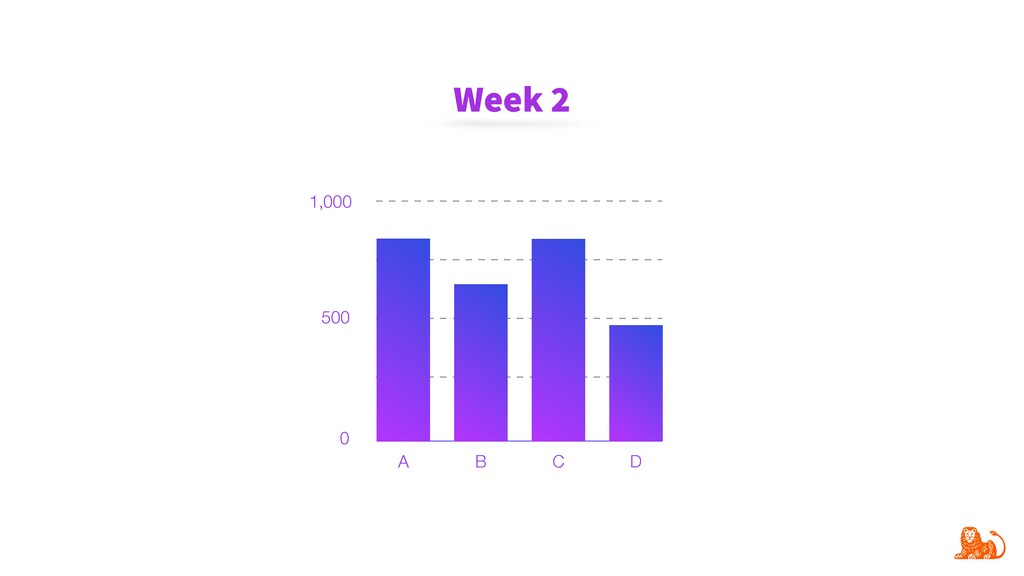
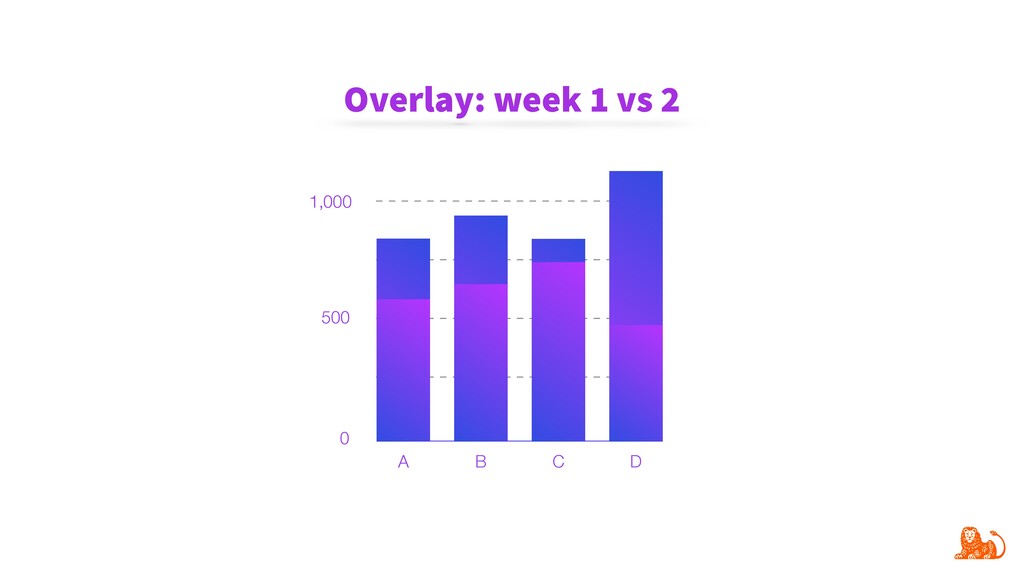
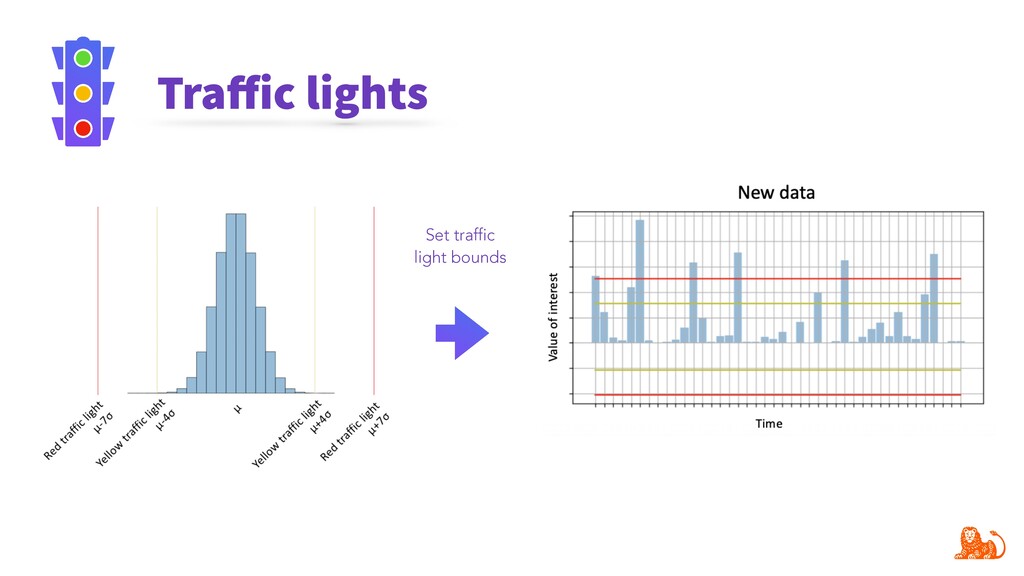
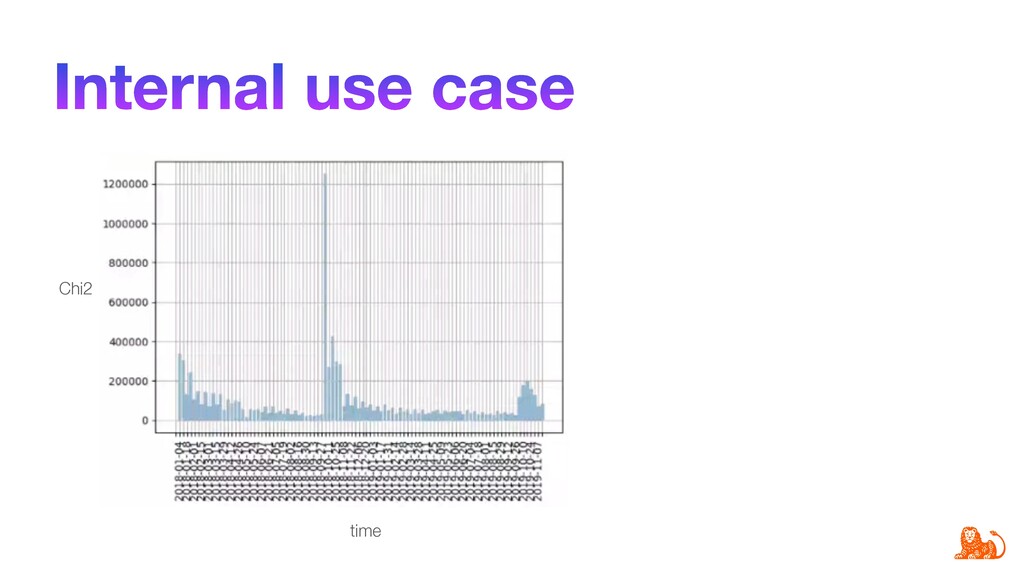
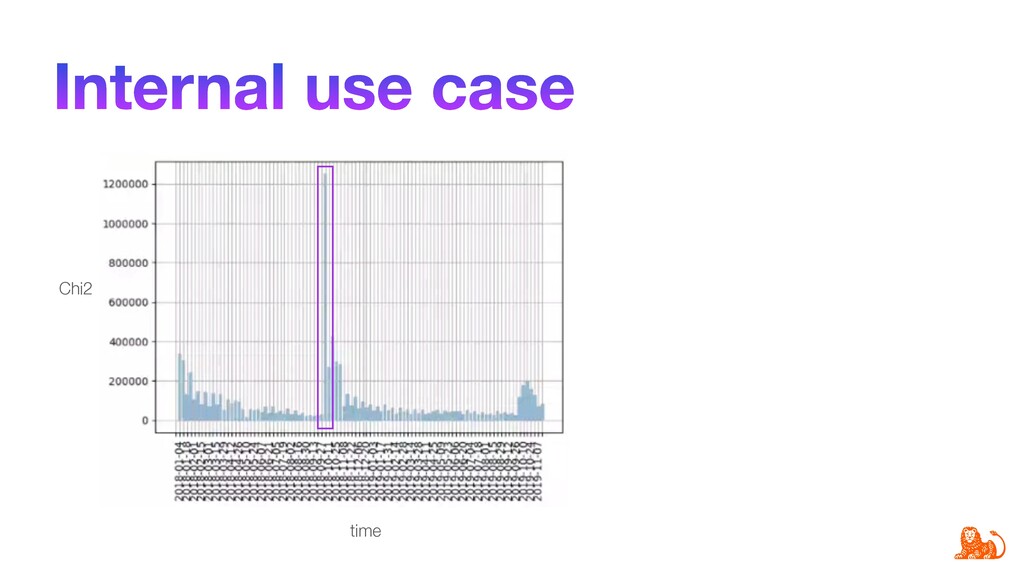
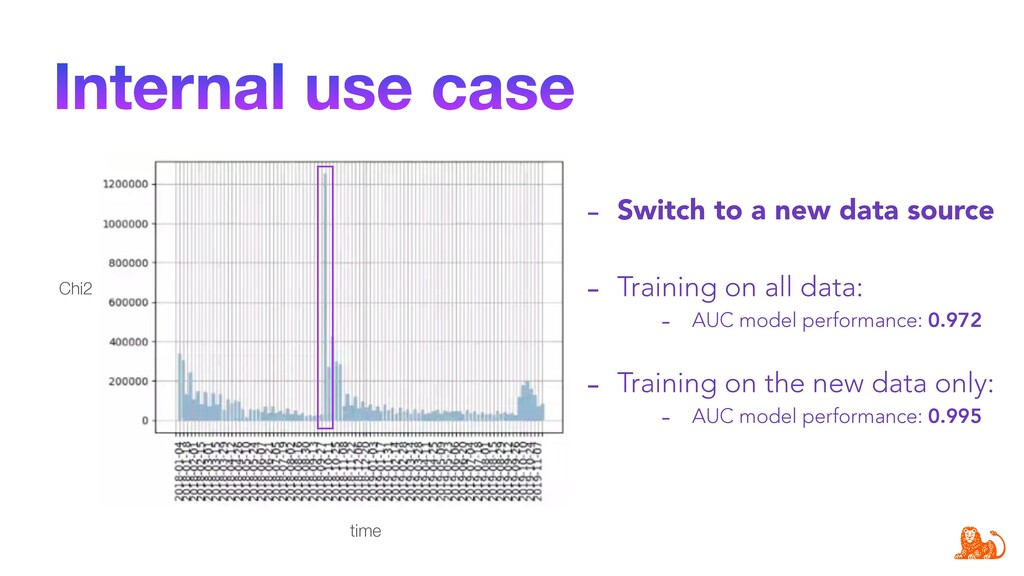
Model performance depends directly on the data used for training and the data to make predictions. Changes in the latter (e.g. certain word frequency, user demographics, etc.) can affect the performance and make predictions unreliable. Given that input data often change over time, it is important to track changes in both input distributions and delivered predictions periodically, and when they differ significantly - take actions. For example, diagnose and retrain an incorrect model in production.

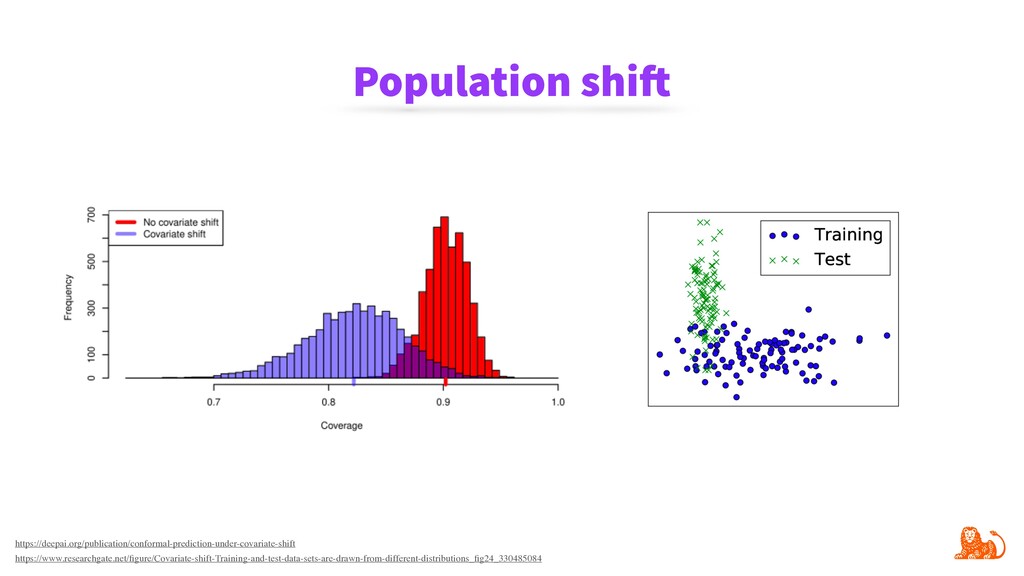
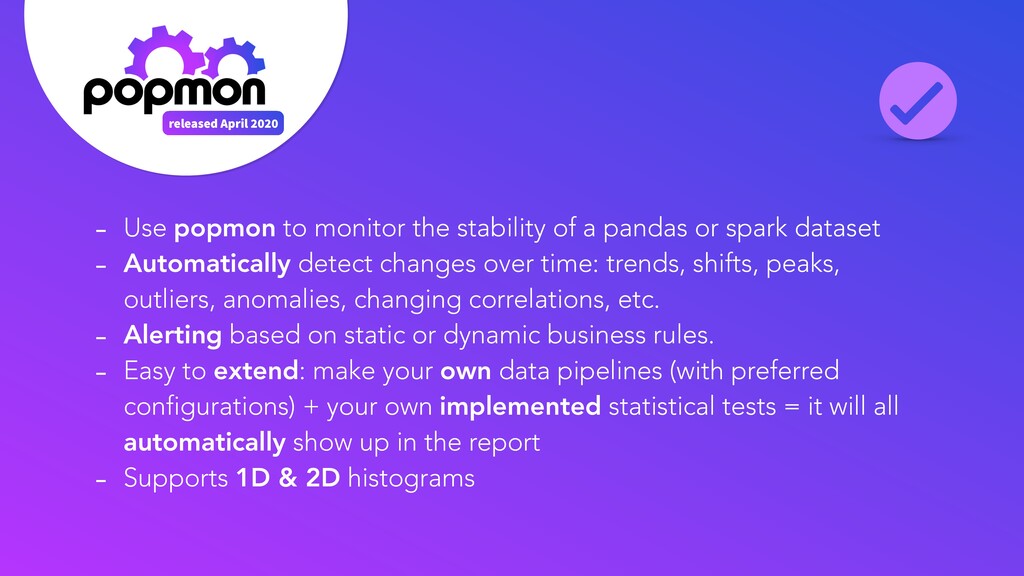
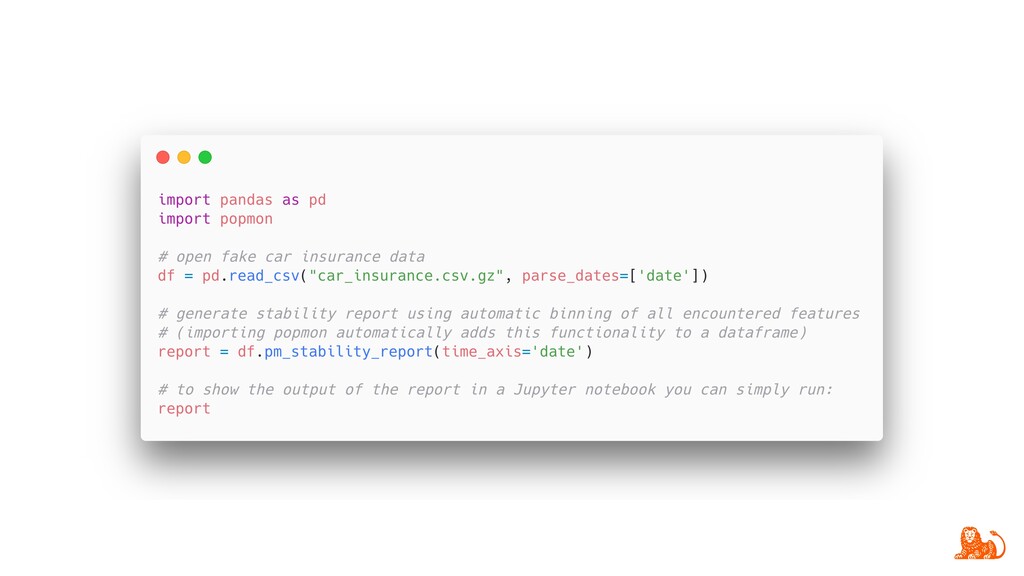
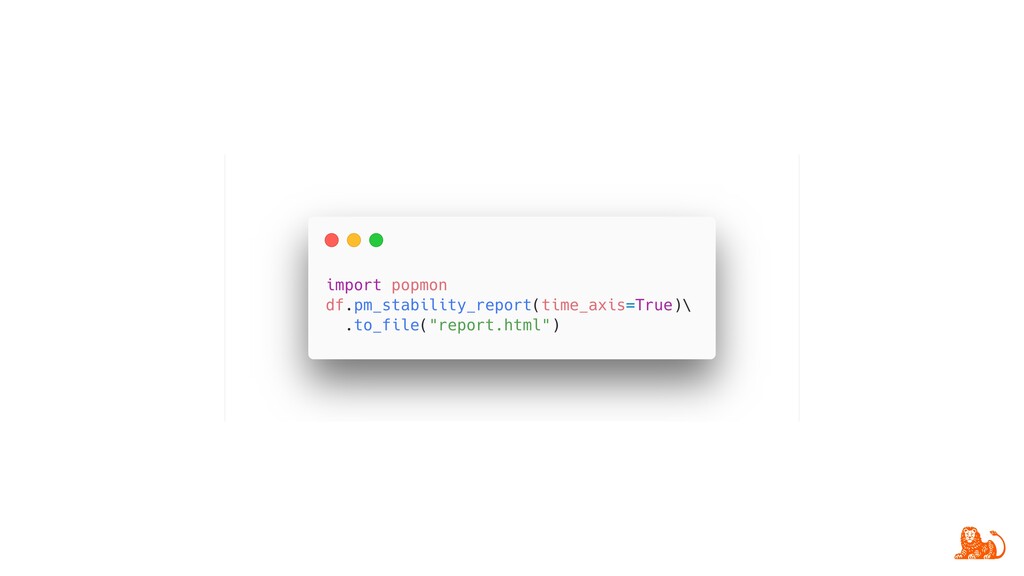
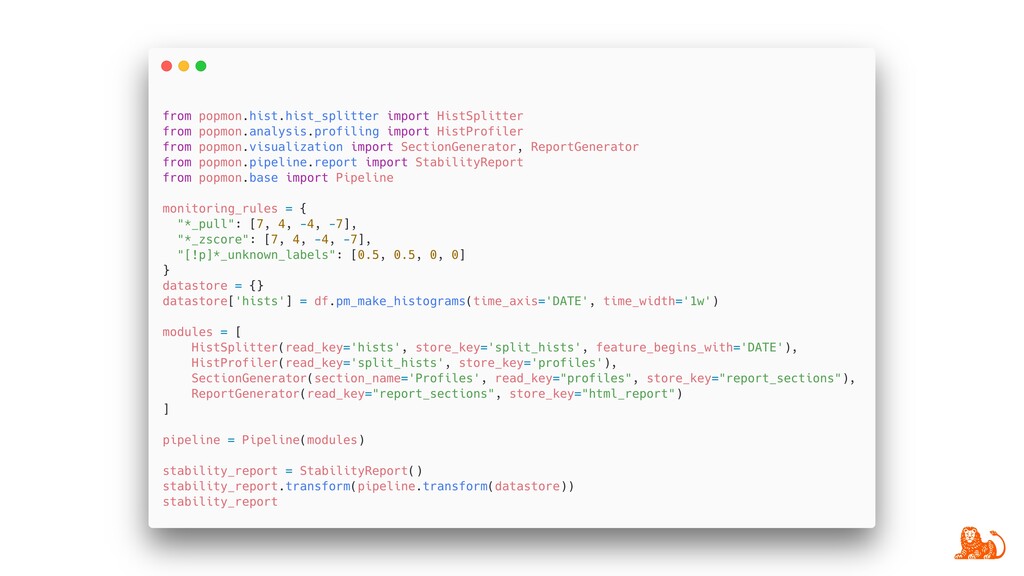
To make monitoring both more consistent and semi-automatic, at ING we have developed a generic Python package called "popmon" to monitor the stability of data populations over time, using techniques from statistical process control. In this talk, the speaker will present multiple scenarios of population shift, the motivation and challenges of population monitoring, as well as our open-source solution to these.

Tomas Sostak

June 16, 2020
Tweet

Other Decks in Science

Transcript

  1. ` ` population shi monitoring made easy Tomas Sostak 16

    June 2020 @tomassostak ING Wholesale Banking Advanced Analytics
  2. PRESENTATION OUTLINE • MOTIVATION • PROBLEMS • POPMON SOLUTION •

    DEMO • USE CASE About me Tomas Sostak Data Scientist @ ING Wholesale Banking Advanced Analytics @tomassostak
  3. Our why - Our ML models and data were not

    being monitored carefully enough - No good open-source solution available - Past experience in doing this right
  4. Motive ‣ Running reliable and consistent models in production ‣

    Are newly incoming data/predictions consistent with the historical data on which model has been trained and tested on initially? ‣ If input features change, then tested performance is not guaranteed ‣ Full control of continuous retraining of deployed models ‣ Think twice before retraining your model if new data has different distribution than the old one ‣ Reporting - audit, paper trail
  5. 1 year of data 52,000 26,000 0 A B C

    D Week 1 1,000 500 0 A B C D Week 2 1,000 500 0 A B C D Week 3 Week 52 …
  6. Statistical tests 1,000 500 0 A B C D •

    Chi-squared • Kolmogorov-Smirnov • Pearson’s correlation • Your own tests
  7. WHY HISTOGRAMS? • Aggregated information (data privacy) • Size =

    easy to store, light for sending over APIs • Monitoring works identically with both big and small data • More visual - adds information (distribution) • Useful for applying all sorts of statistical tests
  8. DS & DE - Great for data exploration (seeing data

    patterns, trend, seasonality, outliers). - Very valuable for early inspection of covariate shifts - Data ingestion pipelines (monitor your incoming data to prevent drop in performance); stitching is available (e.g. data coming in batches: over certain period, or a number records)
  9. Profiling Statistical comparisons Reference points count, mean, std, filled, nan,

    min, max, p01, p05, p25, p50, p75, p95, p99,… • Self • Reference (train) • Rolling (sliding) • Expanding • Chi-squared • Kolmogorov-Smirnov • Pearson’s correlation • Trend detection (LR) • Custom tests
  10. - Use popmon to monitor the stability of a pandas

    or spark dataset - Automatically detect changes over time: trends, shifts, peaks, outliers, anomalies, changing correlations, etc. - Alerting based on static or dynamic business rules. - Easy to extend: make your own data pipelines (with preferred configurations) + your own implemented statistical tests = it will all automatically show up in the report - Supports 1D & 2D histograms released April 2020
  11. time Chi2 - Switch to a new data source -

    Training on all data: - AUC model performance: 0.972 - Training on the new data only: - AUC model performance: 0.995 Internal use case