Upgrade to Pro — share decks privately, control downloads, hide ads and more …

Better Web Development with WebKit Remote Debugging

toshsharma
April 18, 2012

Better Web Development with WebKit Remote Debugging

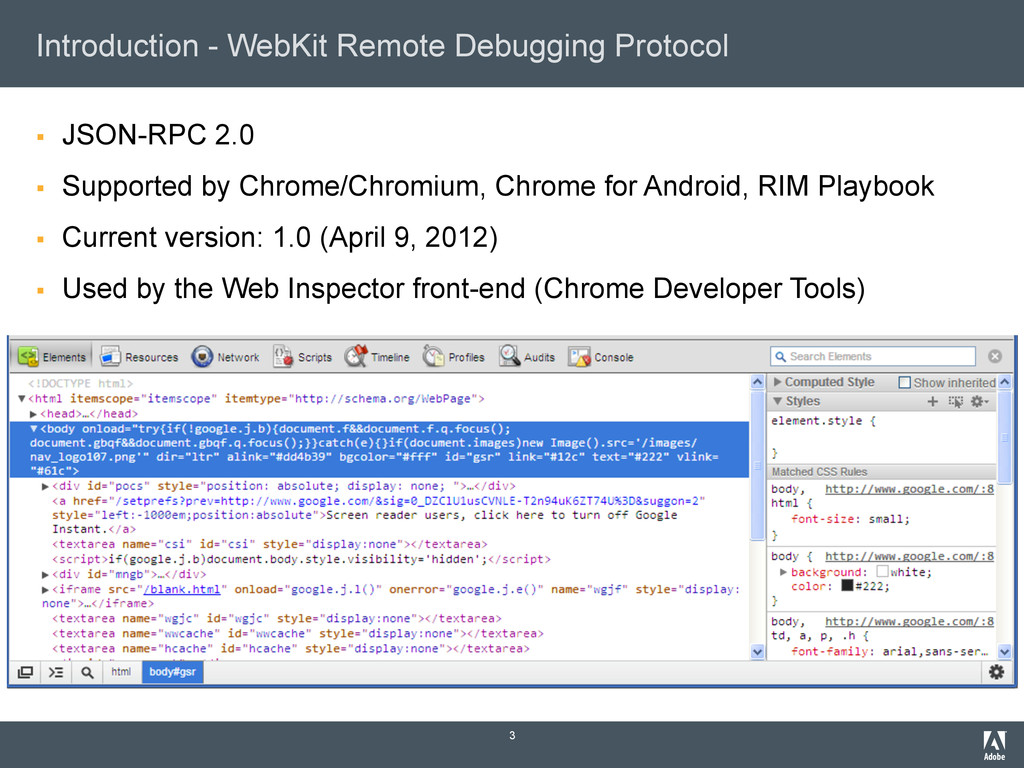
The WebKit Remote Debugging API can be used to build custom
tools, such as Web Development IDEs to aid in web design and
development. In this presentation, source code walkthroughs and
demos are presented to highlight the power of this API and show
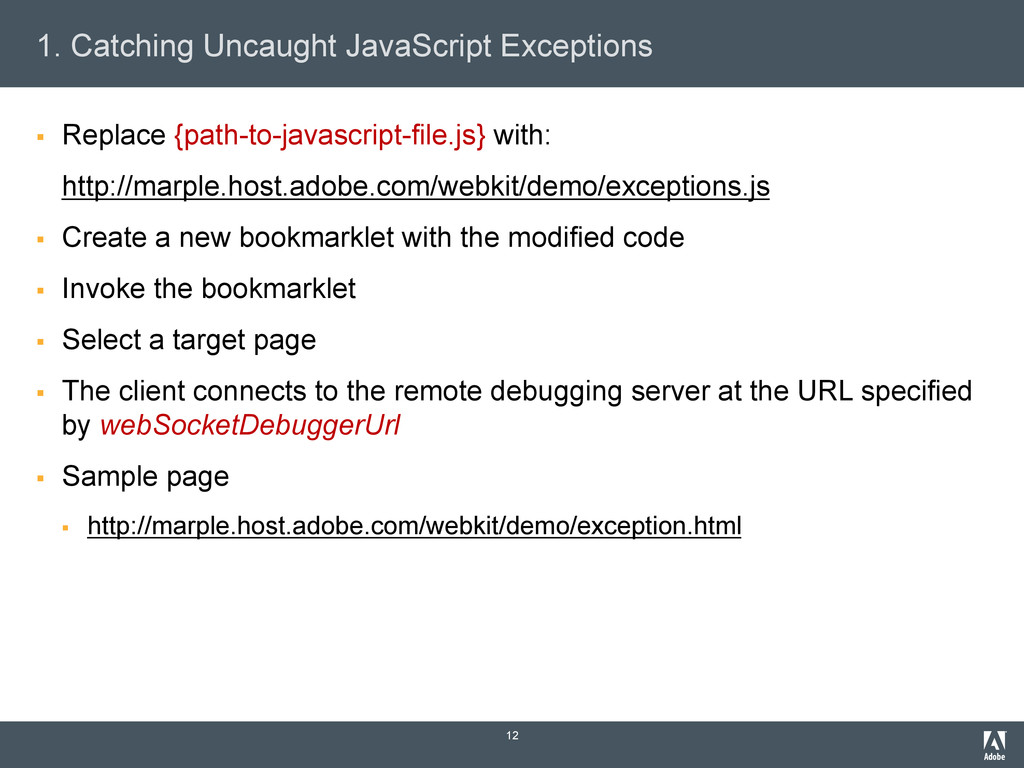
how it can be used in one’s own tools - 1) Pausing the debugger
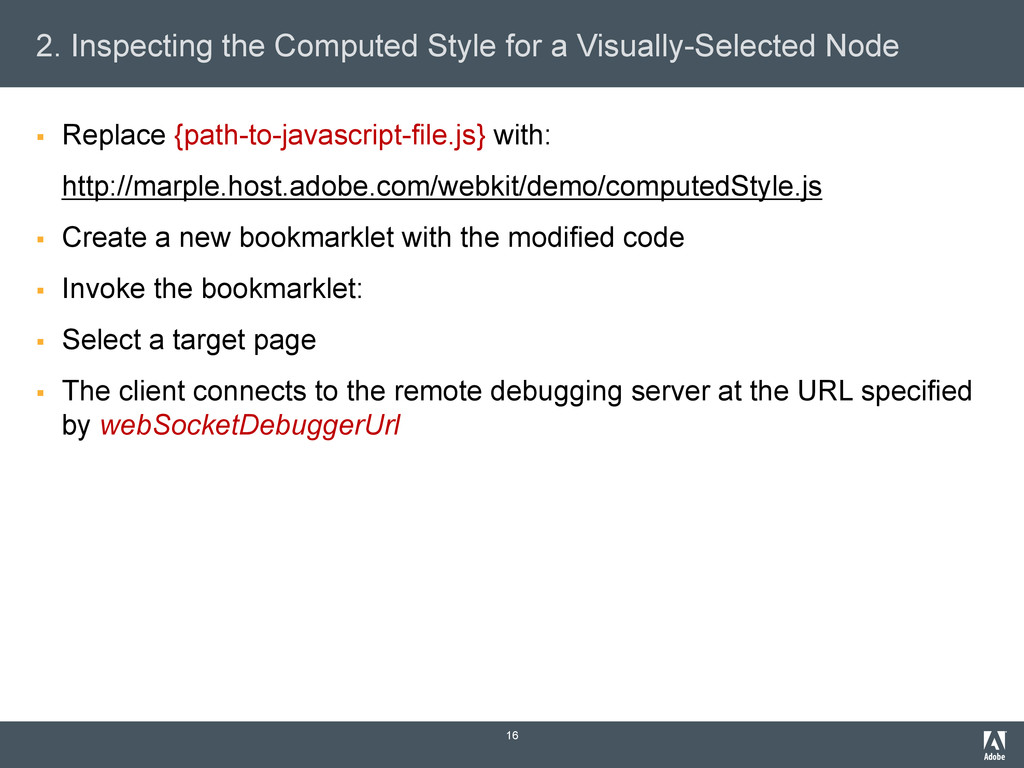
when an uncaught exception is thrown, 2) Inspecting the computed
style of a node that is visually selected by the user. Developers are
encouraged to create their own tools based on this API

toshsharma

April 18, 2012
Tweet

More Decks by toshsharma

Other Decks in Technology

Transcript

  1. Ashutosh Jagdish Sharma | Senior Computer Scientist | Adobe Better

    Web Development with WebKit Remote Debugging Developer Track | WWW 2012 | Lyon
  2. Agenda §  WebKit Remote Debugging Protocol §  Demos and Code

    Walkthroughs §  Catching uncaught JavaScript exceptions §  Inspecting the computed style for a visually selected node 2
  3. Introduction - WebKit Remote Debugging Protocol §  JSON-RPC 2.0 § 

    Supported by Chrome/Chromium, Chrome for Android, RIM Playbook §  Current version: 1.0 (April 9, 2012) §  Used by the Web Inspector front-end (Chrome Developer Tools) 3
  4. Why Use the Remote Debugging Protocol? §  Debug over the

    wire §  Chrome for Android §  RIM Playbook §  Enhance existing tools §  Build custom tools §  Integrate with IDEs §  Sample Use cases §  Tracking profiling data over time §  Logging and filtering console messages 4
  5. WebKit Remote Debugging Protocol §  Web browser as a server

    §  Clients can reside in another process §  Useful for mobile devices that have a limited screen area §  Asynchronous communication over a websocket §  Inspector.json 5
  6. API Surface §  Divided into categories (called domains) §  Each

    domain contains: §  Commands §  Allow clients to send requests to the browser §  e.g. DOM.querySelectorAll is a command that requests the set of nodes that match a given selector §  Events §  Used for asynchronous notifications §  Used as responses to commands §  e.g. DOM.childNodeRemoved is an event dispatched when a child node is removed from its parent 6
  7. Domains §  Protocol version 1.0: §  Console - Interaction with

    the JavaScript console §  DOM - DOM read/write operations §  DOMDebugger - Breakpoints on DOM events and operations §  Debugger - JavaScript debugging capabilities §  Network - Tracking network activities of the page §  Page - Actions and events related to the inspected page §  Runtime - JavaScript runtime §  Timeline - Instrumentation records for the page run-time 7
  8. Hidden Domains §  ApplicationCache §  CSS §  DOMStorage §  Database

    §  FileSystem §  IndexedDB §  Inspector §  Memory §  Profiler §  Worker 8 §  No guarantee of backwards compatibility §  Internally used by the Web Inspector §  Visible domains can also have some hidden commands and events
  9. Development Setup §  Chrome or Chromium build §  Launch with

    remote debugging enabled: §  Navigate to http://localhost:9222/ to see a list of inspectable pages 9 {Path to Chromium} --remote-debugging-port=9222
  10. Development Setup §  Navigate to http://localhost:9222/json to see details relevant

    to remote debugging: §  Multiple remote debugging connections not available (Chrome Developer Tools) 10 { "devtoolsFrontendUrl": "/devtools/devtools.html?host=localhost:9222&page=2", "faviconUrl": "http://www.google.com/favicon.ico", "thumbnailUrl": "/thumb/http://www.google.com/", "title": "Google", "url": "http://www.google.com/", "webSocketDebuggerUrl": "ws://localhost:9222/devtools/page/2" }
  11. Code Walkthroughs §  Chromium Build 127895 is used for the

    live demos §  Remote debugging client running inside the browser itself §  to minimize the required setup §  Navigate to http://localhost:9222/json and invoke a bookmarklet 11 javascript:(function(){ function loadScript(scriptURL) { var scriptElem = document.createElement("script"); scriptElem.setAttribute("language", "JavaScript"); scriptElem.setAttribute("src", scriptURL); document.body.appendChild(scriptElem); } loadScript("{path-to-javascript-file.js}"); })()
  12. 1. Catching Uncaught JavaScript Exceptions §  Replace {path-to-javascript-file.js} with: http://marple.host.adobe.com/webkit/demo/exceptions.js

    §  Create a new bookmarklet with the modified code §  Invoke the bookmarklet §  Select a target page §  The client connects to the remote debugging server at the URL specified by webSocketDebuggerUrl §  Sample page §  http://marple.host.adobe.com/webkit/demo/exception.html 12
  13. exception.js – Sending a Command to the Server 13 function

    process(webSocketDebuggerUrl, pageUrl) { var dbg = Debugger.getDebugger(webSocketDebuggerUrl); dbg.connect().done(function() { dbg.sendCommand("Debugger.enable").done(function() { dbg.sendCommand("Debugger.setPauseOnExceptions", { state: "uncaught" } ); }); }); } §  Debugger §  Helper class to manage the connection with the remote debugging server §  Utilizes jQuery’s Deferred functionality to manage and chain asynchronous callbacks. §  Not related to the Debugger domain of the remote debugging protocol
  14. Workflow 14 §  Uncaught exception thrown on the target page

    §  Debugger.paused event dispatched §  Received as a message on the debugger websocket in the client §  JSON data packet has a method property with the value Debugger.paused §  Extract useful information §  Resume the debugger (to avoid halting the page)
  15. exception.js – Obtain Information about the Exception 15 if(json.params.reason ===

    "exception") { var errorName = json.params.data.className; var callFrames = json.params.callFrames; var callStack = ""; for(var i = callFrames.length - 1; i >= 0; i--) { if(callStack !== "") callStack += " -> "; callStack += callFrames[i].functionName + "()"; } alert("Exception: " + errorName + "\n" + "Callstack: " + callStack); self.sendCommand("Debugger.resume"); }
  16. 2. Inspecting the Computed Style for a Visually-Selected Node § 

    Replace {path-to-javascript-file.js} with: http://marple.host.adobe.com/webkit/demo/computedStyle.js §  Create a new bookmarklet with the modified code §  Invoke the bookmarklet: §  Select a target page §  The client connects to the remote debugging server at the URL specified by webSocketDebuggerUrl 16
  17. computedStyle.js §  Visually selecting an element on the target page

    §  An Inspector.Inspect event is received when the user selects a node 17 dbg.sendCommand("DOM.getDocument") .done(function(response) { dbg.sendCommand("Inspector.enable") .done(function(response) { var config = { showInfo: true, contentColor: { r: 255, g: 0, b: 0, a: 0.5 }, paddingColor: { r: 255, g: 204, b: 153, a: 0.5 }, marginColor: { r: 255, g: 255, b: 204, a: 0.5 } }; dbg.sendCommand("DOM.setInspectModeEnabled", { enabled: true, highlightConfig: config }); }); });
  18. computedStyle.js §  Handling the Inspector.Inspect event §  CSS and Inspector

    are hidden domains – their usage is discouraged 18 self.sendCommand("DOM.requestNode", { objectId: objectId }) .done(function(response) { var nodeId = response.result.nodeId; self.sendCommand("CSS.getComputedStyleForNode", { nodeId: nodeId }) .done(function(response) { var result = response.result.computedStyle; var computedStyle = {}; for(var i = 0; i < result.length; i++) { var s = result[i]; computedStyle[s["name"]] = s["value"]; } alert("margin-bottom: " + computedStyle["margin-bottom"]); }); });
  19. Miscellaneous §  Chrome/Chromium also exposes remote debugging to browser extensions

    via the chrome.debugger extension API §  Other browsers §  Chrome for Android – can be debugged remotely over USB §  Firefox §  Remote debugging clients can connect to Firebug (similar to Chrome Developer Tools) via its Crossfire extension §  Firefox Mobile (Fennec) §  Remote debugging in the works §  Some patches allow remote JS debugging 19
  20. Acknowledgments §  My thanks to §  The WebKit team that

    developed the WebKit Remote Debugging Protocol §  Narciso Jaramillo (@rictus on Twitter) who wrote the Debugger helper class that manages the remote debugging connections 20
  21. References §  JSON schema for the remote debugging protocol § 

    http://trac.webkit.org/browser/trunk/Source/WebCore/inspector/Inspector.json §  Chrome Developer Tools: Remote Debugging §  https://developers.google.com/chrome-developer-tools/docs/remote-debugging §  Remote Debugging Protocol 1.0 §  https://developers.google.com/chrome-developer-tools/docs/protocol/1.0/ §  Chrome’s Dev Channel builds §  http://www.chromium.org/getting-involved/dev-channel §  Nightly Chromium builds §  http://commondatastorage.googleapis.com/chromium-browser-continuous/index.html §  Chrome Canary builds §  http://tools.google.com/dlpage/chromesxs 22
  22. References §  WebKit Remote Debugging (WebKit Blog) §  http://www.webkit.org/blog/1620/webkit-remote-debugging/ § 

    Bookmarklet §  http://en.wikipedia.org/wiki/Bookmarklet §  Chromium Build 127895 used for the live demos §  http://commondatastorage.googleapis.com/chromium-browser-continuous/Mac/127895/chrome-mac.zip §  http://commondatastorage.googleapis.com/chromium-browser-continuous/Win/127895/chrome-win32.zip §  http://commondatastorage.googleapis.com/chromium-browser-continuous/Linux/127895/chrome-linux.zip §  jQuery’s Deferred Object §  http://api.jquery.com/category/deferred-object/ §  Source code for the tool to alert the user on uncaught JavaScript exceptions §  http://marple.host.adobe.com/webkit/demo/exceptions.js 23
  23. References §  Sample web page which has code that throws

    an uncaught exception §  http://marple.host.adobe.com/webkit/demo/exception.html §  Source code for the tool to inspect the computed style of a visually- selected node §  http://marple.host.adobe.com/webkit/demo/computedStyle.js §  Chrome extension API to expose the remote debugging protocol to browser extensions §  http://code.google.com/chrome/extensions/debugger.html §  Firebug §  http://getfirebug.com/whatisfirebug §  Crossfire §  http://getfirebug.com/wiki/index.php/Crossfire §  Remote debugging in Firefox Mobile §  http://lucasr.org/2012/03/28/remote-debugging-in-firefox-mobile/ 24