Upgrade to Pro — share decks privately, control downloads, hide ads and more …

Causes of Japan‘s Decline in Research Competitiveness

Causes of Japan‘s Decline in Research Competitiveness

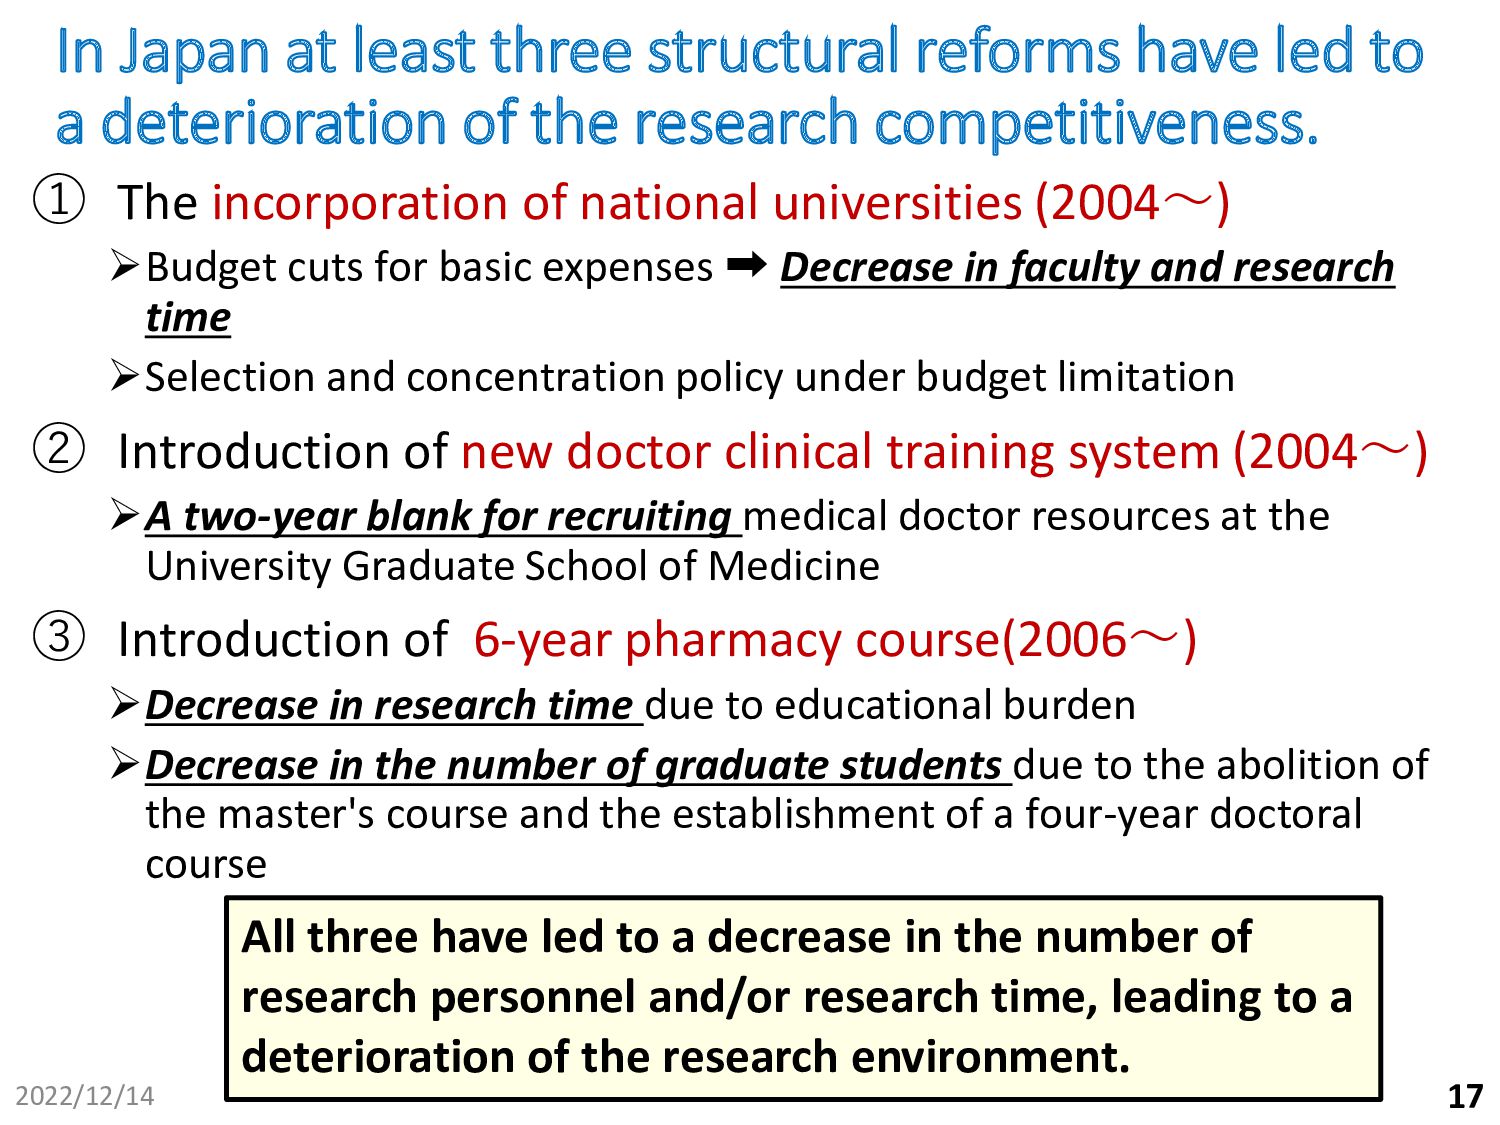
At least three policies have caused Japan's research competitiveness to decline.
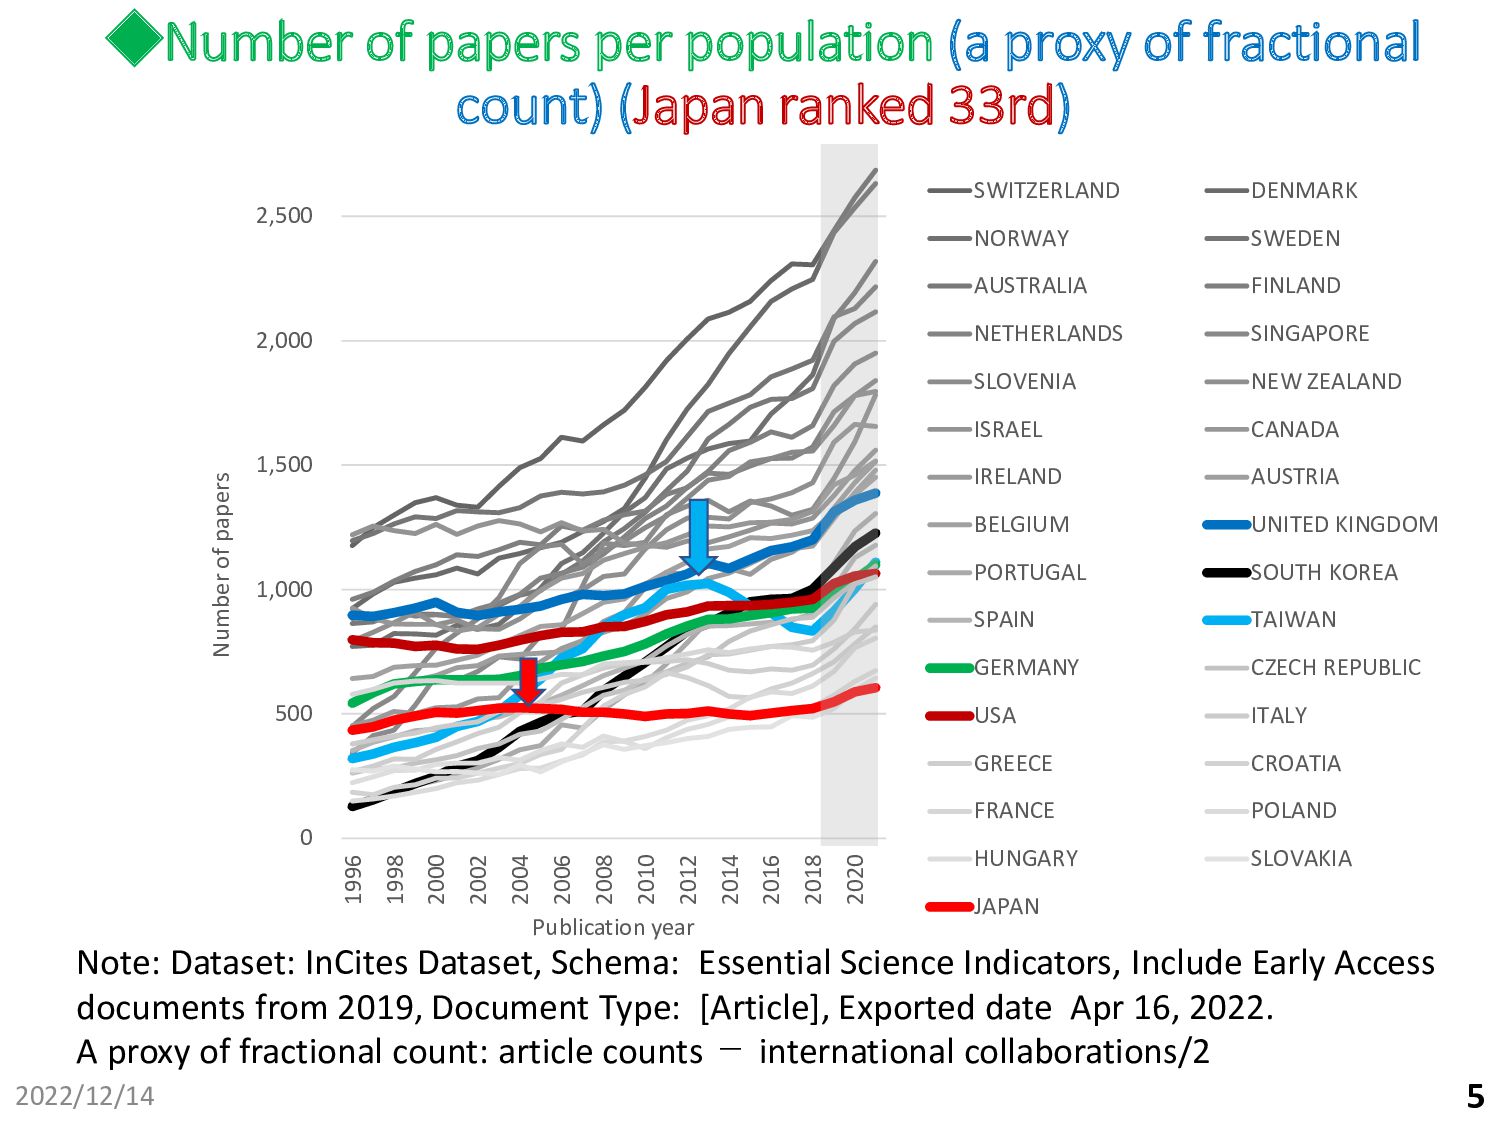
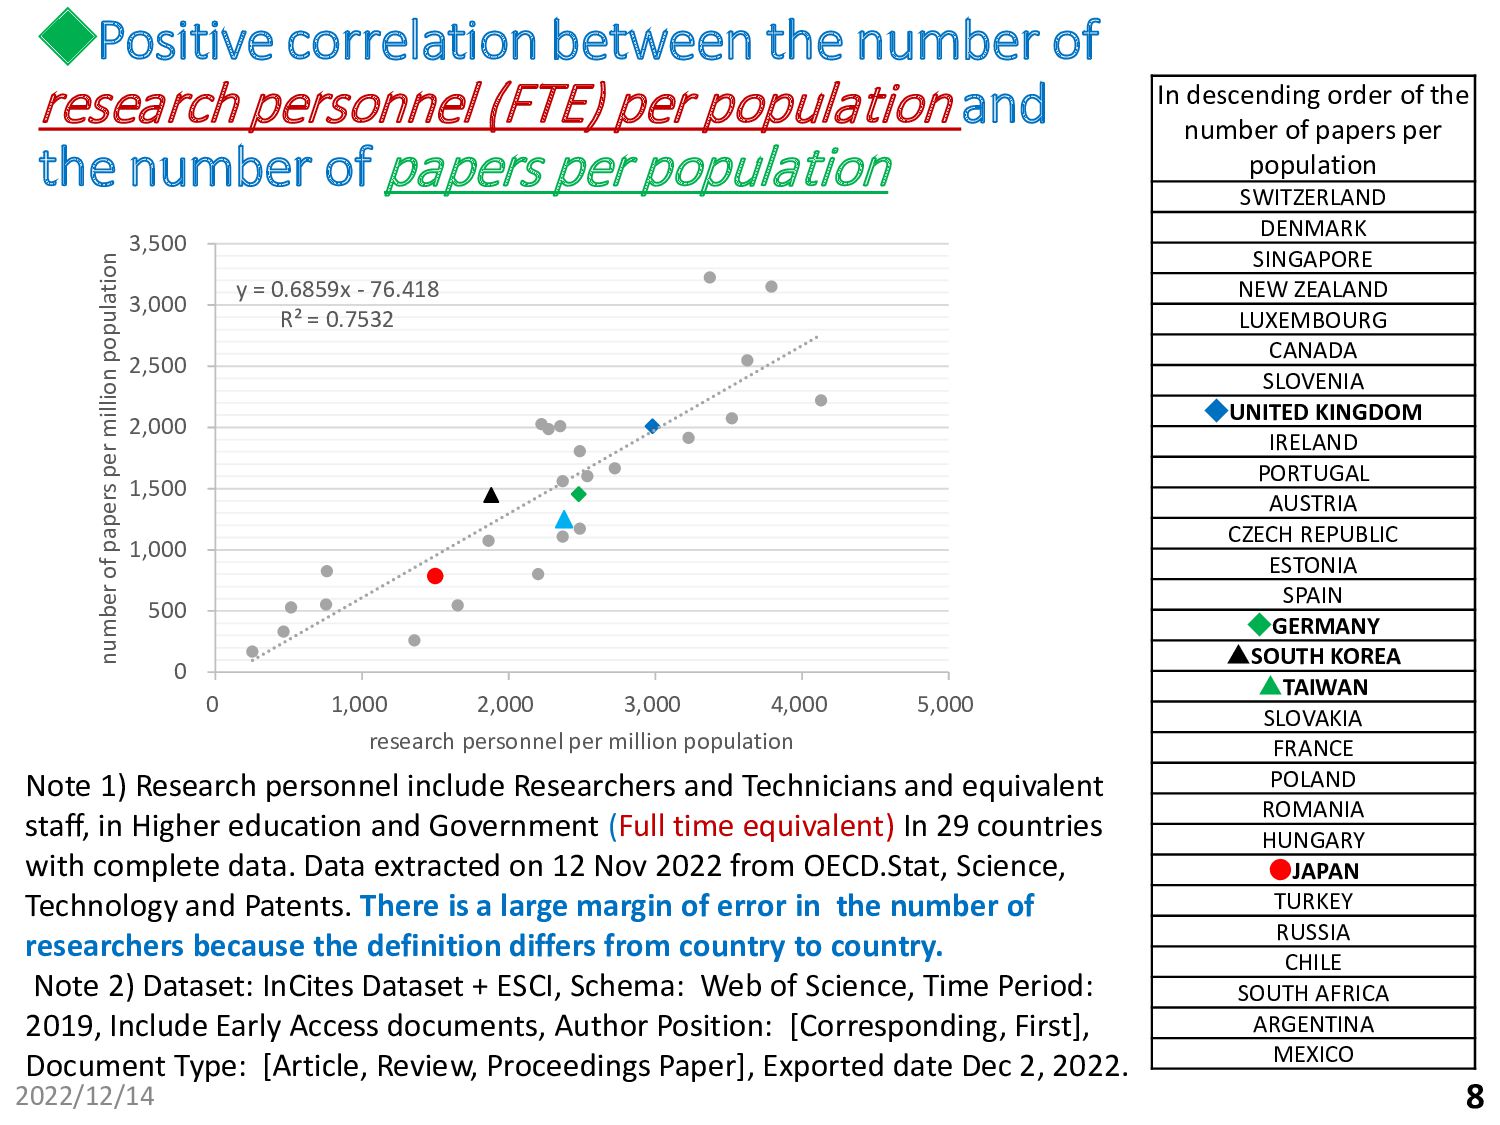
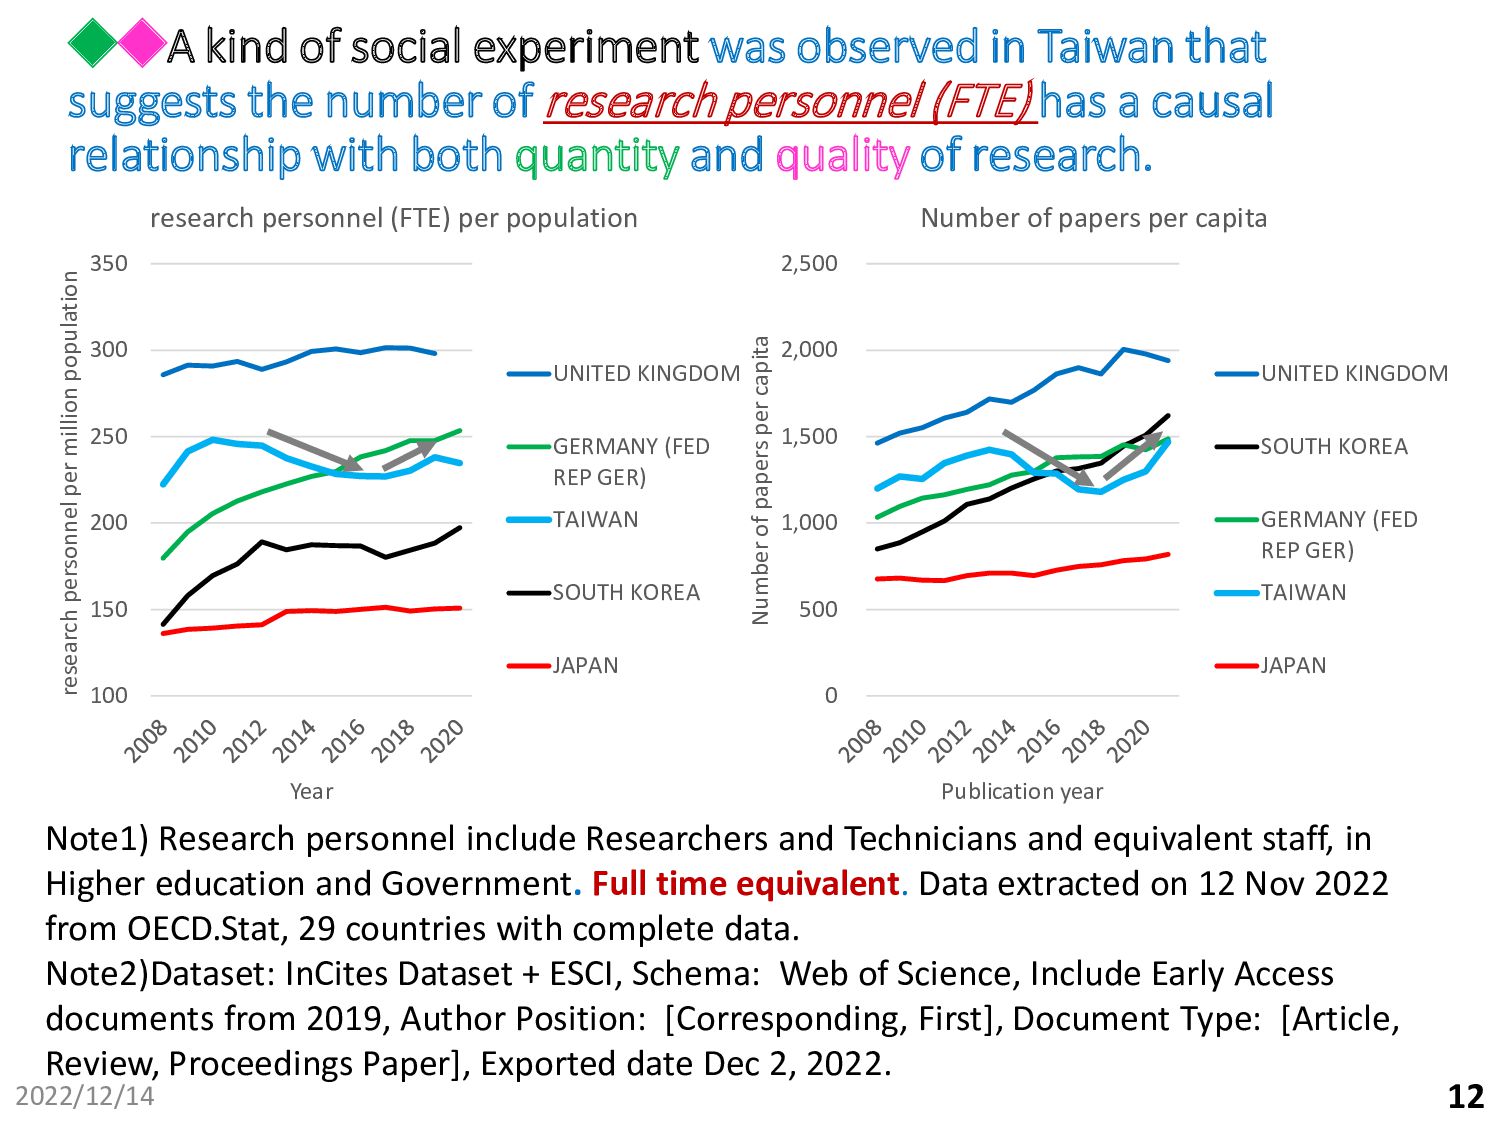
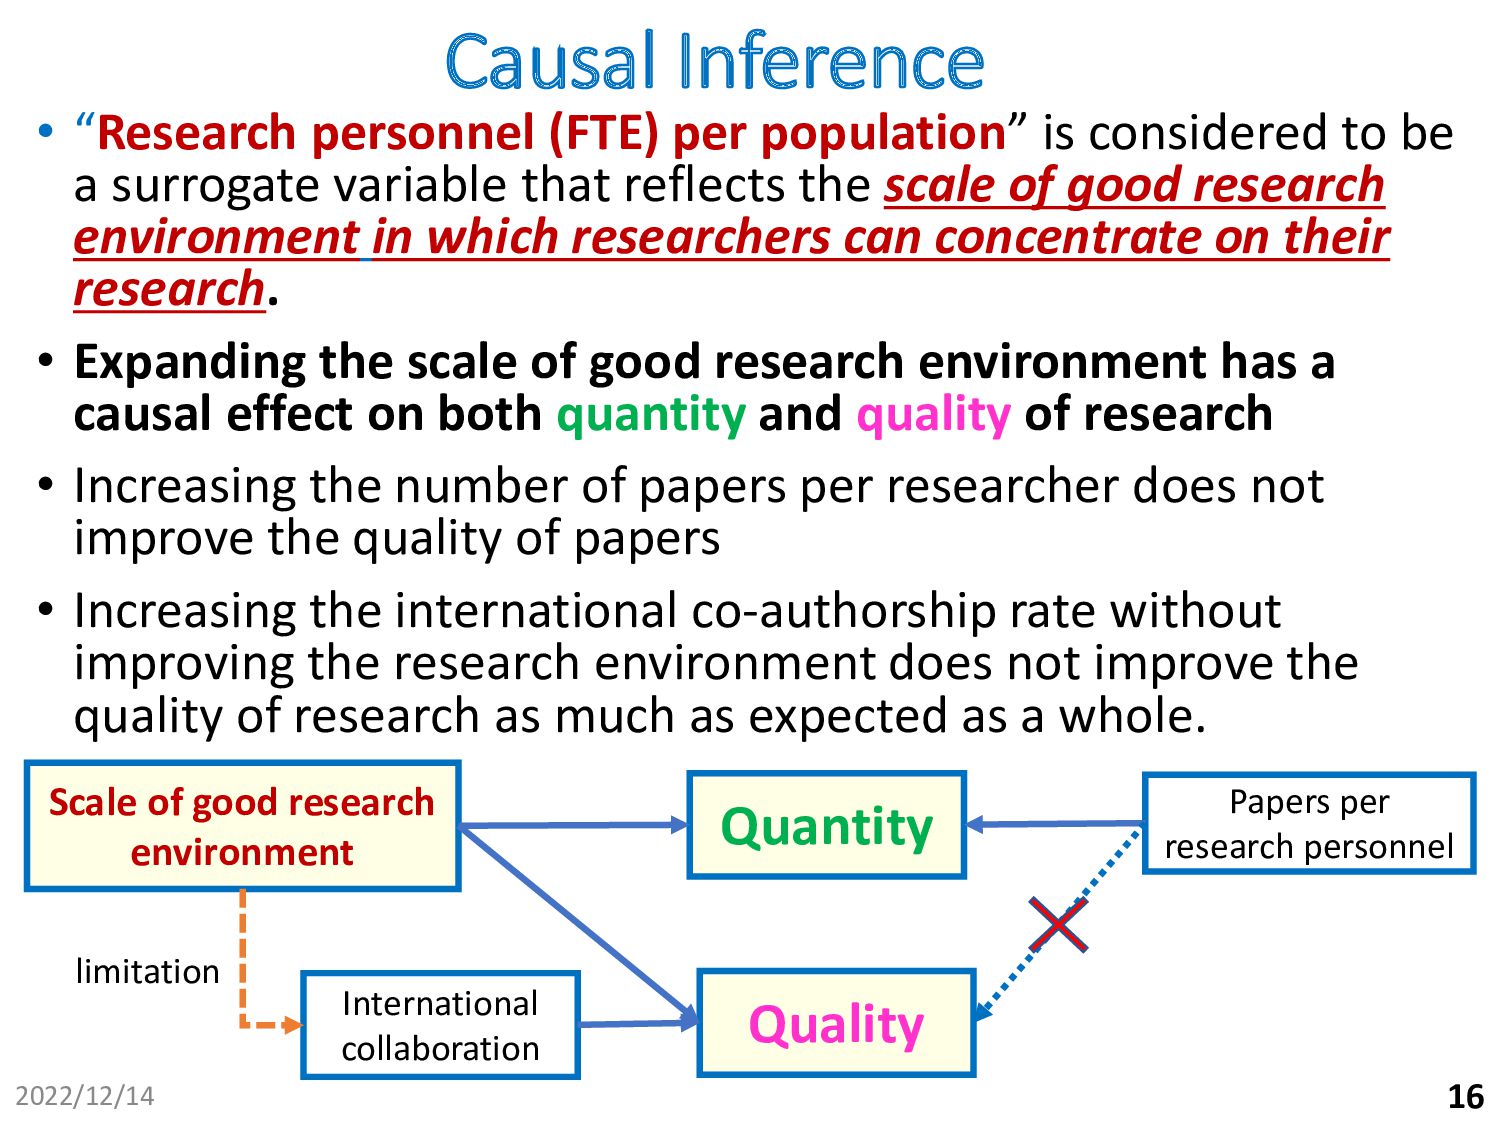
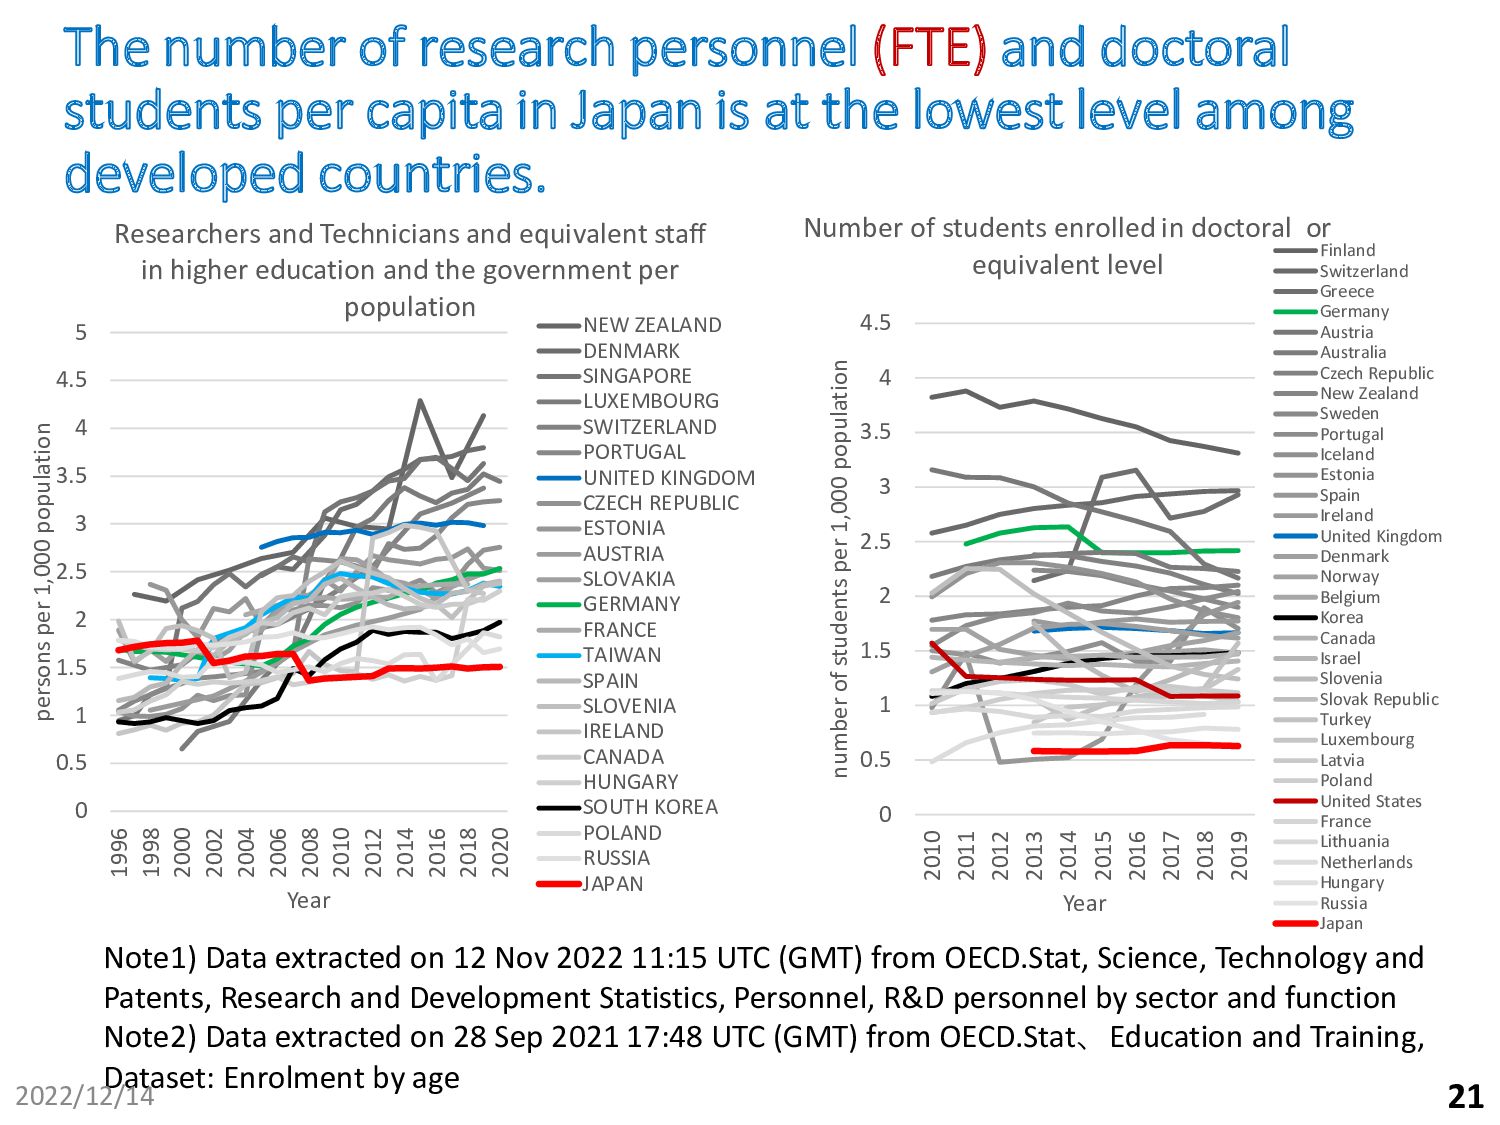
A cause-based policy is needed to solve this problem. Without expanding the scale of good research environments (that is, without increasing the number of FTE research personnel per population), Japan's research competitiveness will continue to decline regardless of any policies or efforts.

Nagayasu Toyoda

December 30, 2022
Tweet

Other Decks in Science

Transcript

  1. Nagayasu Toyoda, MD, PhD. Suzuka University of Medical Science [email protected]

    2022/12/14 1 Causes of Japan‘s Decline in Research Competitiveness ーNecessity of Policies Based on Causality ー
  2. • Bibliographic database: Web of Science Core Collection by Clarivate

    A tool for analysis: InCitesBenchmarking & Analytics (hereinafter abbreviated as “InCites”) • Some data from Scopus by Elsevier on the website of National Science Foundation (NSF), USA • OECD.Stat The number of personnel involved in research is based on full-time equivalent (FTE) data. FTE reflects the number of research personnel considering research time. “Research personnel” in this presentation means “Researchers” plus “Technicians and equivalent staff” in OECD.Stat. 2 Data source No conflicts of interest to disclose 2022/12/14
  3. Surrogate variables that reflect the quantity and quality of research

    Quantity indicators • Number of papers by • Fractional count (or a proxy of fractional count) • Corresponding author or First author count Quality indicators • Category-normalized citation impact (CNCI), [Field-weighted citation impact (FWCI) by Elsevier] • % Documents in Top 10%, % Documents in Top 1% • % Documents in Q1 Journals Quantity with quality indicators • Documents in Top 10%, Documents in Top 1% • Documents in Q1 Journals Note1) Q1 means the top quartile by journal impact factor. Note2) As a proxy for the fractional count, the number of papers minus one-half of the internationally co-authored papers was used. 2022/12/14 3
  4. 0 20,000 40,000 60,000 80,000 100,000 120,000 140,000 160,000 1996

    1999 2002 2005 2008 2011 2014 2017 2020 Number of papers Publication year ◆Scientific and engineering papers by selected countries (fractional count, Scopus) (Japan ranked 6th) 0 100,000 200,000 300,000 400,000 500,000 600,000 700,000 800,000 1996 1999 2002 2005 2008 2011 2014 2017 2020 Number of papers Publication year United States Germany United Kingdom China India Japan Note: The data was downloaded from the National Science Foundation (NSF) website. Article counts refer to publications from a selection of conference proceedings and peer- reviewed journals in S&E fields from Scopus. 2022/12/14 4
  5. 0 500 1,000 1,500 2,000 2,500 1996 1998 2000 2002

    2004 2006 2008 2010 2012 2014 2016 2018 2020 Number of papers Publication year SWITZERLAND DENMARK NORWAY SWEDEN AUSTRALIA FINLAND NETHERLANDS SINGAPORE SLOVENIA NEW ZEALAND ISRAEL CANADA IRELAND AUSTRIA BELGIUM UNITED KINGDOM PORTUGAL SOUTH KOREA SPAIN TAIWAN GERMANY CZECH REPUBLIC USA ITALY GREECE CROATIA FRANCE POLAND HUNGARY SLOVAKIA JAPAN ◆Number of papers per population (a proxy of fractional count) (Japan ranked 33rd) Note: Dataset: InCites Dataset, Schema: Essential Science Indicators, Include Early Access documents from 2019, Document Type: [Article], Exported date Apr 16, 2022. A proxy of fractional count: article counts - international collaborations/2 2022/12/14 5
  6. 0.4 0.6 0.8 1 1.2 1.4 1.6 1.8 CNCI Publication

    year SINGAPORE SWITZERLAND NETHERLANDS DENMARK BELGIUM SWEDEN UNITED KINGDOM NORWAY AUSTRALIA FINLAND IRELAND AUSTRIA NEW ZEALAND USA CANADA ISRAEL GERMANY ITALY FRANCE GREECE HUNGARY SLOVENIA PORTUGAL SPAIN UNITED ARAB EMIRATES SOUTH AFRICA SAUDI ARABIA VIETNAM CHILE CHINA MAINLAND BANGLADESH CZECH REPUBLIC SOUTH KOREA TAIWAN MALAYSIA SLOVAKIA SERBIA EGYPT CROATIA PAKISTAN BULGARIA ARGENTINA IRAN POLAND JAPAN THAILAND ◆CNCI by countries with more than 5,000 papers in 2021 (Japan ranked 45th out of 60 countries, still declining) Dataset: InCites Dataset + ESCI, Schema: Web of Science, Include Early Access documents from 2019, Document Type: [Review, Article, Proceedings Paper], 5-Year Trend Graph, Exported date Dec 2, 2022. 2022/12/14 6
  7. ◆Competitiveness against G6 countries in terms of quantity with quality

    indicators sensitively reflects changes in research capability. (G6 :USA, UK, Germany, France, Italy and Canada.) 0 2 4 6 8 10 12 14 Q1 ratio to the average for G6 countries x 100 Publication year Number of papers in Q1 journals relative to the average for G6 countries CHINA MAINLAND USA UNITED KINGDOM GERMANY SOUTH KOREA ITALY SPAIN INDIA AUSTRALIA CANADA FRANCE JAPAN BRAZIL NETHERLANDS IRAN TAIWAN Dataset: InCites Dataset, Schema: Essential Science Indicators, Include Early Access documents, Document Type: [Article], Exported date Aug 2, 2022. Author Position: 1996- 2007; proxy of corresponding, 2008-2022; Corresponding, USA is outside the graph. 2022/12/14 7
  8. ◆Positive correlation between the number of research personnel (FTE) per

    population and the number of papers per population y = 0.6859x - 76.418 R² = 0.7532 0 500 1,000 1,500 2,000 2,500 3,000 3,500 0 1,000 2,000 3,000 4,000 5,000 number of papers per million population research personnel per million population In descending order of the number of papers per population SWITZERLAND DENMARK SINGAPORE NEW ZEALAND LUXEMBOURG CANADA SLOVENIA ◆UNITED KINGDOM IRELAND PORTUGAL AUSTRIA CZECH REPUBLIC ESTONIA SPAIN ◆GERMANY ▲SOUTH KOREA ▲TAIWAN SLOVAKIA FRANCE POLAND ROMANIA HUNGARY •JAPAN TURKEY RUSSIA CHILE SOUTH AFRICA ARGENTINA MEXICO Note 1) Research personnel include Researchers and Technicians and equivalent staff, in Higher education and Government (Full time equivalent) In 29 countries with complete data. Data extracted on 12 Nov 2022 from OECD.Stat, Science, Technology and Patents. There is a large margin of error in the number of researchers because the definition differs from country to country. Note 2) Dataset: InCites Dataset + ESCI, Schema: Web of Science, Time Period: 2019, Include Early Access documents, Author Position: [Corresponding, First], Document Type: [Article, Review, Proceedings Paper], Exported date Dec 2, 2022. 2022/12/14 8
  9. ◆A positive correlation was observed between the number of papers

    per population, the % International Collaboration and the % Documents in Top 10% y = 0.0041x + 3.3576 R² = 0.7104 0 5 10 15 20 25 0 1,000 2,000 3,000 % Documents in Top 10% number of papers per million population Correlation between the number of papers per population and the % Documents in Top 10% In descending order of % Documents in Top 10% SINGAPORE SWITZERLAND ◆UNITED KINGDOM DENMARK LUXEMBOURG AUSTRIA ◆GERMANY CANADA IRELAND NEW ZEALAND ESTONIA FRANCE SPAIN ▲SOUTH KOREA PORTUGAL ▲TAIWAN SLOVENIA SOUTH AFRICA HUNGARY CHILE •JAPAN TURKEY CZECH REPUBLIC POLAND SLOVAKIA ROMANIA MEXICO ARGENTINA RUSSIA Note) Dataset: InCites Dataset + ESCI, Schema: Web of Science, Time Period: 2019, Include Early Access documents, Author Position: [Corresponding, First], Document Type: [Article, Review, Proceedings Paper], Exported date Dec 2, 2022. y = 0.2712x - 0.1936 R² = 0.6552 0 5 10 15 20 25 0 20 40 60 % Documents in Top 10% % International Collaborations Correlation between the % International Collaborations and the % Documents in Top 10% high low middle 2022/12/14 9 Here, we stratify the international co-authorship rate into three layers, high, middle, low.
  10. Note) Dataset: InCites Dataset + ESCI, Schema: Web of Science,

    Time Period: 2019, Include Early Access documents, Author Position: [Corresponding, First], Document Type: [Article, Review, Proceedings Paper], Exported date Dec 2, 2022. y = 0.0028x + 6.2154 R² = 0.7249 y = 0.0022x + 3.7336 R² = 0.5152 0 2 4 6 8 10 12 14 16 18 20 0 1000 2000 3000 % Documents in Top 10% number of papers per million population Correlation between the number of papers per population and % Documents in Top 10% under stratifying % International Collaboration y = 2.2096x + 9.1376 R² = 0.0272 y = 2.7655x + 4.2419 R² = 0.1382 0 2 4 6 8 10 12 14 16 18 20 0 0.2 0.4 0.6 0.8 1 % Documents in Top 10% number of papers per research personnel Correlation between the number of papers per research personnel and % Documents in Top 10% under stratifying % International Collaboration ◆A positive correlation was observed between the number of papers per population, not per research personnel, and the % Documents in Top 10% under stratifying the % International Collaboration 2022/12/14 10 high middle low
  11. ◆◆The number of research personnel (FTE) per population positively correlates

    with the % Documents in Top 10% or the Documents in Top 10%, under stratifying % International Collaboration Note) Dataset: InCites Dataset + ESCI, Schema: Web of Science, Time Period: 2019, Include Early Access documents, Author Position: [Corresponding, First], Document Type: [Article, Review, Proceedings Paper], Exported date Dec 2, 2022. y = 0.0016x + 6.7706 R² = 0.4556 y = 0.0011x + 4.1709 R² = 0.2173 0 2 4 6 8 10 12 14 16 18 20 0 1000 2000 3000 4000 5000 % Documents in Top 10% Research personnel per million population Correlation between the research personnel per population and % Documents in Top 10% under stratifying % International Collaboration y = 0.0863x - 24.879 R² = 0.5958 y = 0.0438x - 8.5439 R² = 0.4812 0 100 200 300 400 500 600 0 1000 2000 3000 4000 5000 Documents in Top 10% per million population Research personnel per population Correlation between the research personnel per population and Documents in Top 10% per population under stratifying % International Collaboration 2022/12/14 11 high middle low
  12. ◆◆A kind of social experiment was observed in Taiwan that

    suggests the number of research personnel (FTE) has a causal relationship with both quantity and quality of research. 100 150 200 250 300 350 research personnel per million population Year research personnel (FTE) per population UNITED KINGDOM GERMANY (FED REP GER) TAIWAN SOUTH KOREA JAPAN 0 500 1,000 1,500 2,000 2,500 Number of papers per capita Publication year Number of papers per capita UNITED KINGDOM SOUTH KOREA GERMANY (FED REP GER) TAIWAN JAPAN Note1) Research personnel include Researchers and Technicians and equivalent staff, in Higher education and Government. Full time equivalent. Data extracted on 12 Nov 2022 from OECD.Stat, 29 countries with complete data. Note2)Dataset: InCites Dataset + ESCI, Schema: Web of Science, Include Early Access documents from 2019, Author Position: [Corresponding, First], Document Type: [Article, Review, Proceedings Paper], Exported date Dec 2, 2022. 2022/12/14 12
  13. 0.6 0.7 0.8 0.9 1 1.1 1.2 1.3 1.4 2008

    2009 2010 2011 2012 2013 2014 2015 2016 2017 2018 2019 2020 2021 CNCI Publication year CNCI 0 5 10 15 20 25 30 35 40 45 50 2008 2009 2010 2011 2012 2013 2014 2015 2016 2017 2018 2019 2020 2021 % International Collaboration Year % International Collaboration UNITED KINGDOM GERMANY TAIWAN SOUTH KOREA JAPAN Quoted from Nature Index, 4 SEP 2017 “Taiwan losing ground in the index” “According to the Taiwanese Ministry of Education (MoE), doctorate student enrolment at Taiwan institutions has declined from 33,686 in 2011 to 28,821 in 2016, corresponding with a decrease in the number of full-time faculty from 50,332 to 48,096. Hsu adds that the MoE has even cut back some under-recruiting doctoral programmes in national universities. “ By the way, although Japan is increasing its international co-authorship rate, its CNCI is declining. Why? 2022/12/14 13
  14. ◆The CNCI for internationally co-authored papers in Japan is maintained,

    while the CNCI for domestic co-authored papers is declining. 0.6 0.8 1 1.2 1.4 1.6 1.8 2008 2009 2010 2011 2012 2013 2014 2015 2016 2017 2018 2019 2020 2021 CNCI Publication year CNCI in International Collaboration UNITED KINGDOM GERMANY TAIWAN SOUTH KOREA JAPAN Baseline for All Items 0.6 0.8 1 1.2 1.4 1.6 1.8 2008 2009 2010 2011 2012 2013 2014 2015 2016 2017 2018 2019 2020 2021 CNCI Publication year CNCI in Domestic Collaboration 2022/12/14 14 Japan appears to be increasing its international co-authorship rate at the expense of the quality of its domestic papers.
  15. ◆A negative correlation was observed between the annual growth rates

    (2011-20) of papers and CNCI in Japanese universities, whereas a positive correlation was observed in Korean universities. y = -0.3397x - 0.7104 R² = 0.22 n=35, P=0.0045 -5 -3 -1 1 3 5 7 -6 -4 -2 0 2 4 6 Annual growth rate of CNCI (%) Annual growth rate of papers (%) Correlation between yearly growth rates of papers and CNCI at Japanese universities y = 0.3529x - 0.7034 R² = 0.192 n=35, P=0.0085 -5 -3 -1 1 3 5 7 -2 0 2 4 6 8 10 12 Annual growth rate of papers (%) Annual growth rate of papers (%) Correlation between yearly growth rate of papers and CNCI at Korean universities Note 1) Dataset: InCites Dataset, Schema: Essential Science Indicators, Author Position [First], Include Early Access documents from 2019, Document Type: [Article], Exported date Dec 6, 2022. The top 35 universities by the number of papers published in 2011. Note 2) The annual growth rate (%) is the value obtained by dividing the slope of the value by the average value between 2011 and 2020, multiplied by 100. 2022/12/14 15 It's a seesaw game in Japan!!
  16. Causal Inference • “Research personnel (FTE) per population” is considered

    to be a surrogate variable that reflects the scale of good research environment in which researchers can concentrate on their research. • Expanding the scale of good research environment has a causal effect on both quantity and quality of research • Increasing the number of papers per researcher does not improve the quality of papers • Increasing the international co-authorship rate without improving the research environment does not improve the quality of research as much as expected as a whole. Scale of good research environment Quality Quantity International collaboration Papers per research personnel limitation 2022/12/14 16
  17. In Japan at least three structural reforms have led to

    a deterioration of the research competitiveness. ① The incorporation of national universities (2004~) Budget cuts for basic expenses ➡ Decrease in faculty and research time Selection and concentration policy under budget limitation ② Introduction of new doctor clinical training system (2004~) A two-year blank for recruiting medical doctor resources at the University Graduate School of Medicine ③ Introduction of 6-year pharmacy course(2006~) Decrease in research time due to educational burden Decrease in the number of graduate students due to the abolition of the master's course and the establishment of a four-year doctoral course 2022/12/14 17 All three have led to a decrease in the number of research personnel and/or research time, leading to a deterioration of the research environment.
  18. ◆From around 2004, the number of papers published by National

    universities stagnated or declined, but Private universities increased. Small and medium-sized national universities saw the largest decline 0 5,000 10,000 15,000 20,000 25,000 30,000 1997-1999 1999-2001 2001-2003 2003-2005 2005-2007 2007-2009 2009-2011 2011-2013 2013-2015 2015-2017 2017-2019 2019-2021 Number of papers year of publication Changes in the number of papers by university group Private (n=52) Tokyo & Kyoto Next Top National (n=13) Other National (n=45) 0.4 0.6 0.8 1 1.2 1.4 1.6 1997-1999 1999-2001 2001-2003 2003-2005 2005-2007 2007-2009 2009-2011 2011-2013 2013-2015 2015-2017 2017-2019 2019-2021 ratio to the 2001 value year of publication Changes in the number of papers by university group, ratio to the 2001 value Note1) Analysis of universities with more than 100 papers in 2004 Note2) Dataset: InCites Dataset, Schema: Essential Science Indicators, Include Early Access documents from 2019, Document Type: [Article], Exported date Aug 8, 2022. proxy of fractional count: article counts - international collaborations/2, 3-year moving average 2022/12/14 18
  19. ◆Although private university medical schools temporarily lost their research competitiveness

    against G6 countries, they quickly recovered, but national university medical schools have not yet recovered, especially at small and medium-sized national universities 0.5 0.6 0.7 0.8 0.9 1 1.1 1.2 1997-1999 1999-2001 2001-2003 2003-2005 2005-2007 2007-2009 2009-2011 2011-2013 2013-2015 2015-2017 2017-2019 2019-2021 ratio to the 2001 value Publication year Changes in the ratio of the number of clinical medicine papers in Q1 journals to the average of G6 countries (ratio to the 2001 value) Private (n=29) Tokyo & Kyoto Next Top National (n=12) Other National (n=28) Note1) Analysis of 42 national medical schools and 29 private medical schools Note2) Dataset: InCites Dataset + ESCI, Schema: KAKEN-L3 (Bunka3-H20) (66), Include Early Access documents from 2019, Document Type: [Article], Research Area: [04-16 Clinical Internal Medicine, 04-17 Clinical Surgery], Exported date Aug 8, 2022. proxy of fractional count: article counts - international collaborations/2 2022/12/14 19
  20. ◆Private universities with pharmacy departments have significantly reduced their competitiveness

    against G6 countries , but those without medical and pharmacy schools maintained their competitiveness. 0.5 0.6 0.7 0.8 0.9 1 1.1 1.2 1.3 ratio to the 2001 value Publication year Changes in the ratio of the number of papers in Q1 journals in private universities in Japan to the average of G6 countries (ratio to the 2001 value) medical(-), pharmacy(-) (n=16) medical(+), pharmacy(-) (n=22) medical(+), pharmacy(+) (n=7) medical(-), pharmacy(+) (n=18) Note1) Analysis of 47 universities with medical or pharmacy schools at 2004 enrolled in Incites Dataset, and 16 universities without both with more than 100 papers in 2004 Note2) Dataset: InCites Dataset + ESCI, Schema: Essential Science Indicators, Include Early Access documents from2019, Document Type: [Article], Exported date Aug 8, 2022. proxy of fractional count: article counts - international collaborations/2 M(-)P(-) M(-)P(+) M(+)P(+) M(+)P(-) 2022/12/14 20
  21. The number of research personnel (FTE) and doctoral students per

    capita in Japan is at the lowest level among developed countries. 0 0.5 1 1.5 2 2.5 3 3.5 4 4.5 5 1996 1998 2000 2002 2004 2006 2008 2010 2012 2014 2016 2018 2020 persons per 1,000 population Year Researchers and Technicians and equivalent staff in higher education and the government per population NEW ZEALAND DENMARK SINGAPORE LUXEMBOURG SWITZERLAND PORTUGAL UNITED KINGDOM CZECH REPUBLIC ESTONIA AUSTRIA SLOVAKIA GERMANY FRANCE TAIWAN SPAIN SLOVENIA IRELAND CANADA HUNGARY SOUTH KOREA POLAND RUSSIA JAPAN 0 0.5 1 1.5 2 2.5 3 3.5 4 4.5 2010 2011 2012 2013 2014 2015 2016 2017 2018 2019 number of students per 1,000 population Year Number of students enrolled in doctoral or equivalent level Finland Switzerland Greece Germany Austria Australia Czech Republic New Zealand Sweden Portugal Iceland Estonia Spain Ireland United Kingdom Denmark Norway Belgium Korea Canada Israel Slovenia Slovak Republic Turkey Luxembourg Latvia Poland United States France Lithuania Netherlands Hungary Russia Japan Note1) Data extracted on 12 Nov 2022 11:15 UTC (GMT) from OECD.Stat, Science, Technology and Patents, Research and Development Statistics, Personnel, R&D personnel by sector and function Note2) Data extracted on 28 Sep 2021 17:48 UTC (GMT) from OECD.Stat、Education and Training, Dataset: Enrolment by age 2022/12/14 21
  22. University research expenses per capita paid by the Japanese government

    are among the lowest in the developed countries. 0 100 200 300 400 500 600 1996 1997 1998 1999 2000 2001 2002 2003 2004 2005 2006 2007 2008 2009 2010 2011 2012 2013 2014 2015 2016 2017 2018 2019 2020 Amount per capita(2015 Dollars - Constant prices and PPPs ) University research expenses per capita paid by the government SWITZERLAND SINGAPORE NORWAY DENMARK SWEDEN AUSTRIA ICELAND AUSTRALIA LUXEMBOURG FINLAND NETHERLANDS GERMANY CANADA IRELAND BELGIUM PORTUGAL FRANCE ESTONIA ISRAEL SOUTH KOREA USA POLAND TAIWAN CZECH REPUBLIC UNITED KINGDOM ITALY SPAIN NEW ZEALAND LITHUANIA GREECE JAPAN Data extracted on 13 Nov 2022 06:07 UTC (GMT) from OECD.Stat 2022/12/14 22
  23. ◆In terms of research capability, the gradient among Japanese universities

    is the steepest among developed countries 0 5,000 10,000 15,000 20,000 25,000 30,000 0 10 20 30 number of Documents in Top 1% population-adjusted percentile gradient among universities in selected countries in terms of Documents in Top 1% AUSTRALIA CANADA NETHERLANDS UK SOUTH KOREA GERMANY USA SPAIN TAIWAN FRANCE ITALY JAPAN Dataset: InCites Dataset, Schema: Essential Science Indicators, Time Period: [2016, 2020], Author Position: [Corresponding], Document Type: [Article] Exported date Jul 18, 2021. The population- adjusted percentile is obtained by converting the number of universities in each country registered with InCites Dataset into a country with a population of 100 million, for example. 2022/12/14 23 Japan cannot catch up with other countries under the policy of “selection and concentration”.
  24. The per capita university research expenditure provided by the government

    in South Korea is 1.8 times that in Japan. The amount difference between Japan and South Korea is about 850 billion yen (7 billion dollars at the 2015 exchange rate) 0 20 40 60 80 100 120 140 160 1998 2000 2002 2004 2006 2008 2010 2012 2014 2016 2018 2020 Dollars per capita (2015 Dollars - Constant prices and PPPs) Year Trends in university research expenses per capita paid by Japanese and Korean Governments JAPAN SOUTH KOREA 0 0.05 0.1 0.15 0.2 0.25 0.3 0.35 0.4 1998 2000 2002 2004 2006 2008 2010 2012 2014 2016 2018 2020 % of GDP (2015 Dollars - Constant prices and PPPs) Year Trends in university research expenses per GDP paid by Japanese and Korean Governments Data extracted on 08 May 2022 12:33 UTC (GMT) from OECD.Stat 2022/12/14 24 The Japanese government does not provide research funds according to its economic strength.
  25. The problem will not be solved without cause-based policies!! •

    Without expanding the scale of good research environments (that is, without increasing the number of FTE research personnel per population), Japan's research competitiveness will continue to decline regardless of any policies or efforts. Nagayasu Toyoda [email protected] 2022/12/14 25