Upgrade to Pro — share decks privately, control downloads, hide ads and more …

Get real-time insights from your application with Packetbeat & Elasticsearch

Tudor Golubenco
September 14, 2015
200

Get real-time insights from your application with Packetbeat & Elasticsearch

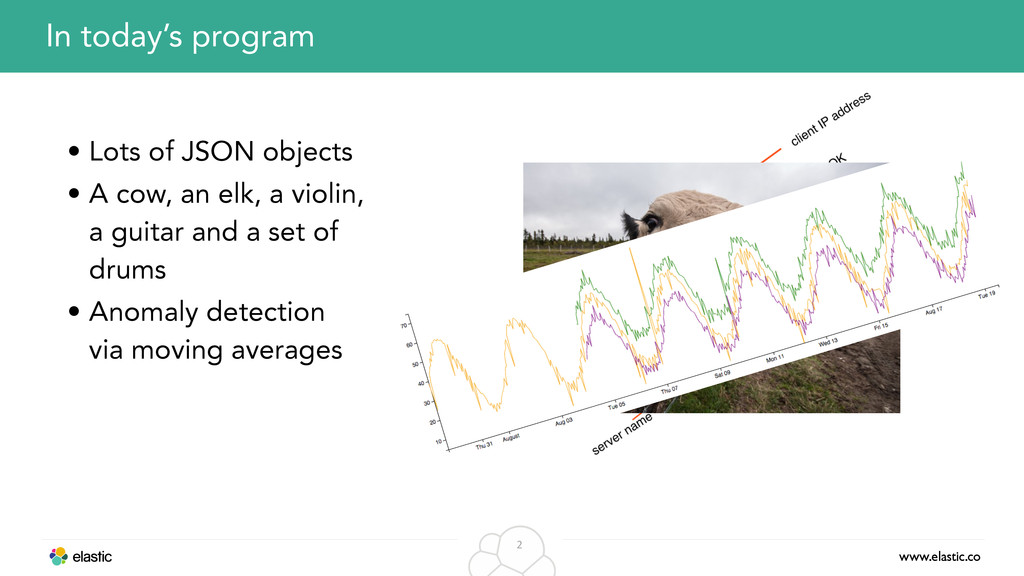
This presentation explains how Packetbeat extracts data from packets and how you can use Elasticsearch to get insights from these data. It takes you from the raw bytes up to doing anomaly detection via moving averages.

Tudor Golubenco

September 14, 2015
Tweet

Transcript

  1. www.elastic.co 2 In today’s program • Lots of JSON objects

    • A cow, an elk, a violin, a guitar and a set of drums • Anomaly detection via moving averages
  2. www.elastic.co 6 also known as the ELK stack Photo  credit:

     https://www.flickr.com/photos/lsmith2010/8215026548
  3. www.elastic.co 7 Open source culture Image  credit:  https://www.flickr.com/photos/tappnel/5798812875 • We

    live in GitHub • We talk Pull Requests • Conferences • Community • Blog posts
  4. www.elastic.co 11 Capture network packets • Visibility into the infrastructure

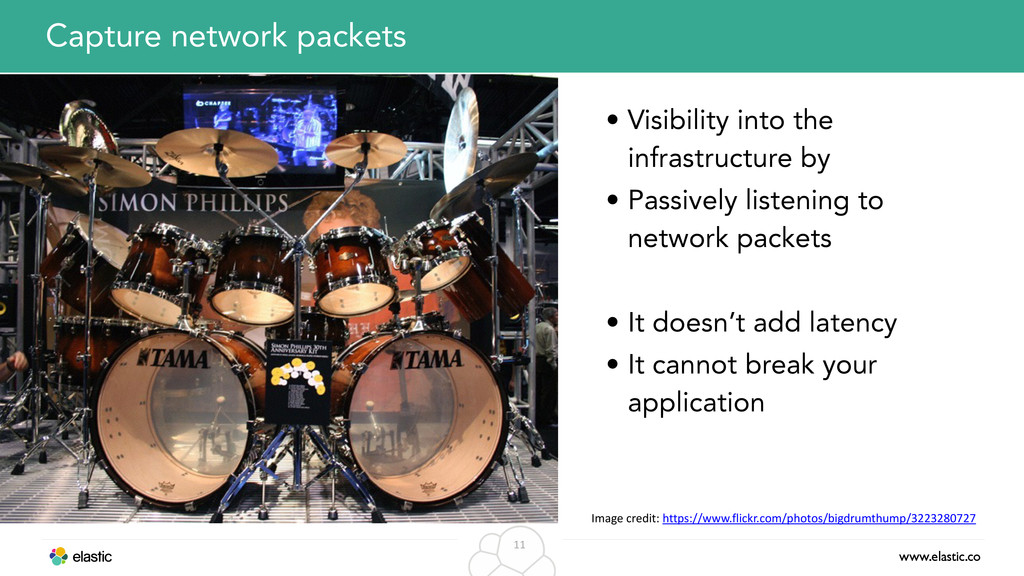
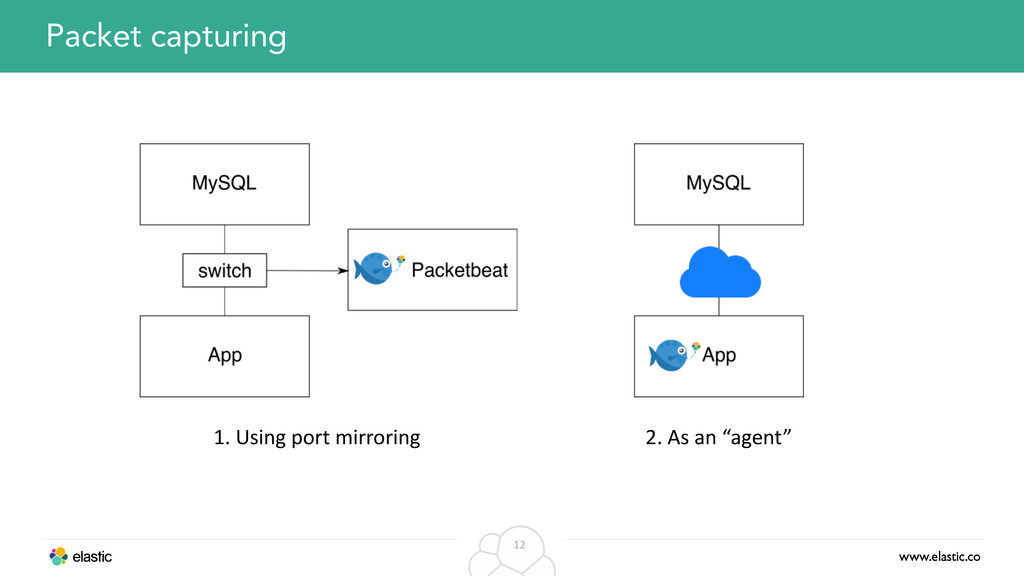
    by • Passively listening to network packets • It doesn’t add latency • It cannot break your application Image  credit:  https://www.flickr.com/photos/bigdrumthump/3223280727
  5. www.elastic.co 13 Sniffing from a technical PoV • libpcap (tcpdump),

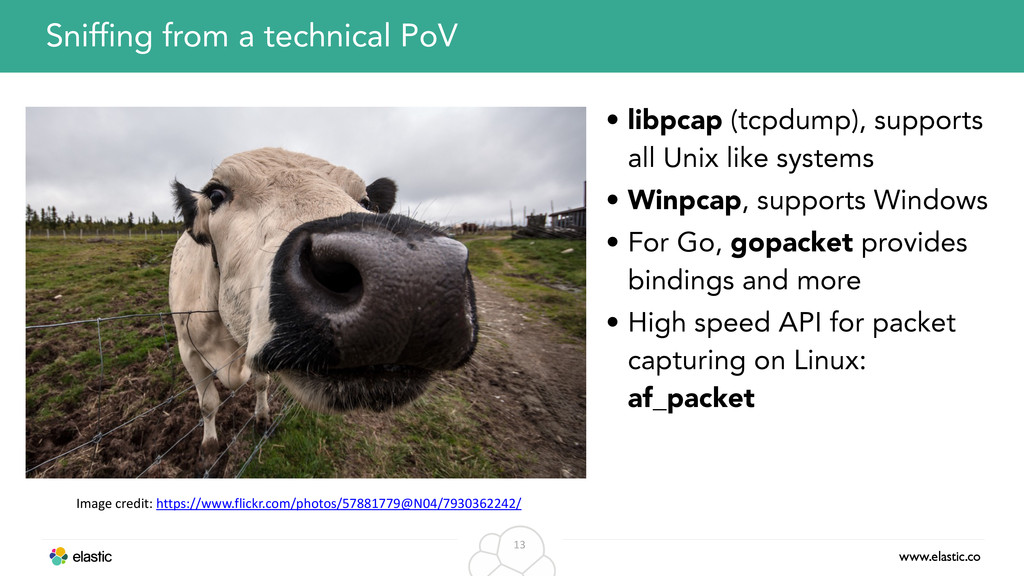
    supports all Unix like systems • Winpcap, supports Windows • For Go, gopacket provides bindings and more • High speed API for packet capturing on Linux: af_packet Image  credit:  https://www.flickr.com/photos/57881779@N04/7930362242/
  6. www.elastic.co 16 Create a JSON object for each request-response pair

    HTTP  transaction GET  method Response  code Response  time
  7. www.elastic.co 20 There’s more to apps than packets Packetbeat  

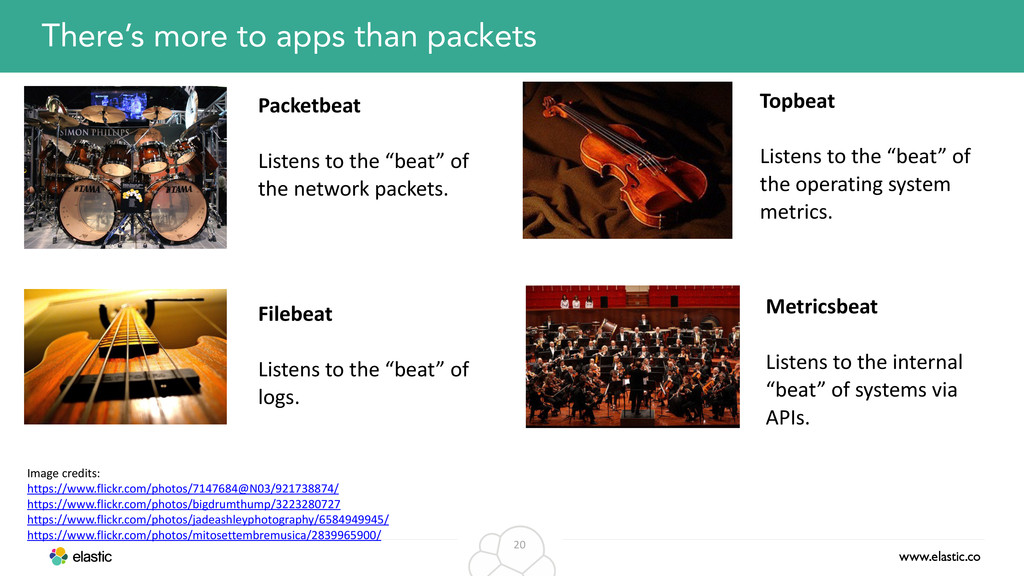
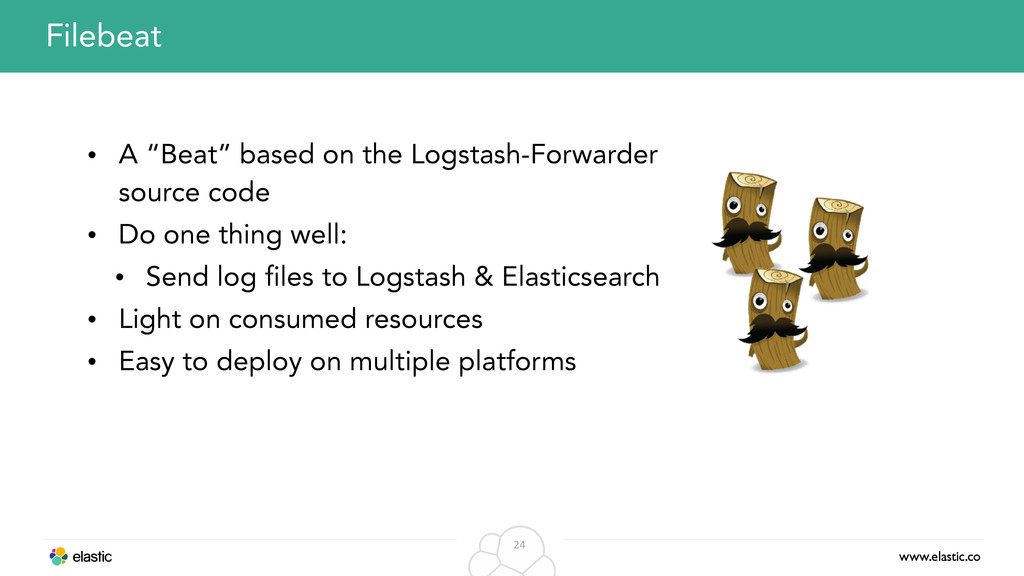
    Listens  to  the  “beat”  of   the  network  packets. Topbeat   Listens  to  the  “beat”  of   the  operating  system   metrics. Image  credits:   https://www.flickr.com/photos/7147684@N03/921738874/   https://www.flickr.com/photos/bigdrumthump/3223280727   https://www.flickr.com/photos/jadeashleyphotography/6584949945/   https://www.flickr.com/photos/mitosettembremusica/2839965900/   Filebeat   Listens  to  the  “beat”  of   logs. Metricsbeat   Listens  to  the  internal   “beat”  of  systems  via   APIs.
  8. www.elastic.co 21 Topbeat • Like the Unix top command but

    sending the data periodically to Elasticsearch • Works also on Windows
  9. www.elastic.co 22 Topbeat system wide and per process stats CPU

     “steal”  time Total  /  used  /  free   memory CPU  stats Per  process  stats CPU  time     consumed Process  pid,  name,   parent  pid,  etc. Memory  used
  10. www.elastic.co 23 Topbeat output objects File  system  stats Mount  point

    Device  name Total,  used,  free   disk  space
  11. www.elastic.co 24 Filebeat • A “Beat” based on the Logstash-Forwarder

    source code • Do one thing well: • Send log files to Logstash & Elasticsearch • Light on consumed resources • Easy to deploy on multiple platforms
  12. www.elastic.co 26 Beats have libbeat in common • Go library

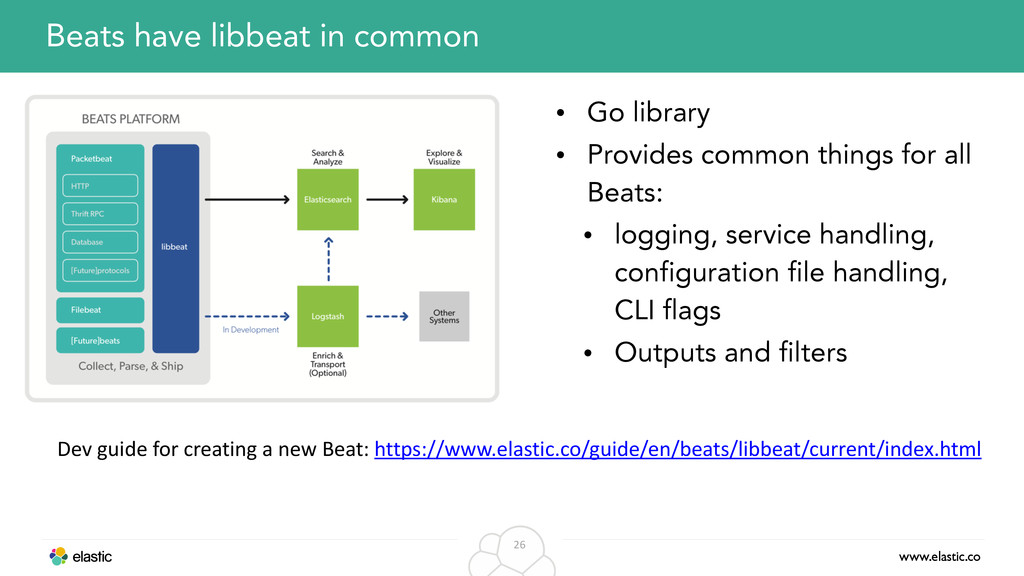
    • Provides common things for all Beats: • logging, service handling, configuration file handling, CLI flags • Outputs and filters Dev  guide  for  creating  a  new  Beat:  https://www.elastic.co/guide/en/beats/libbeat/current/index.html
  13. www.elastic.co 27 Deployment: directly to ES • Option 1: Insert

    directly into Elasticsearch via the bulk API • Security can be provided via Shield and HTTPs
  14. www.elastic.co 28 Deployment: Send to Logstash • Option 2: Insert

    via Logstash • Uses the Lumberjack protocol which offers security • Gives the opportunity of enriching or modifying the data
  15. www.elastic.co 29 Getting insights from the data • Elasticsearch aggregations

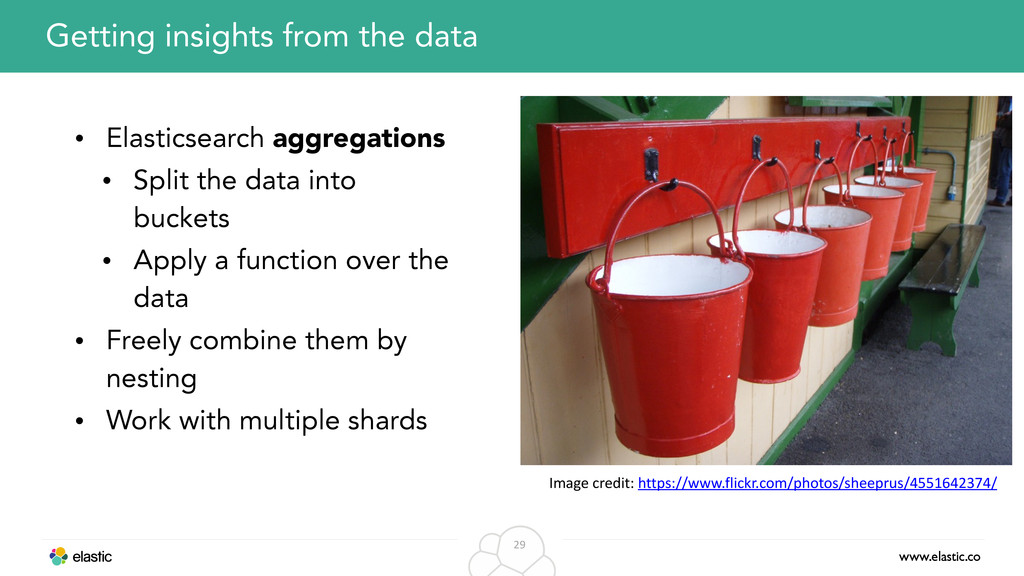
    • Split the data into buckets • Apply a function over the data • Freely combine them by nesting • Work with multiple shards Image  credit:  https://www.flickr.com/photos/sheeprus/4551642374/
  16. www.elastic.co 34 Percentile aggregation •Approximate values •T-digests algorithm by Ted

    Dunning •Accurate for small sets of values •More accurate for extreme percentiles
  17. www.elastic.co 38 Histogram by response time • Splits data in

    buckets by response time • [0-10ms), [10ms-20ms), …
  18. www.elastic.co 44 Terms aggregation • Buckets are dynamically built: one

    per unique value • By default: top 10 by document count • Approximate because each shard can have a different
  19. www.elastic.co 46 • New in Elasticsearch 2.0 (currently in beta)

    • Work on the results of other aggregations Pipeline aggregations
  20. www.elastic.co 48 Simple moving average • [1, 2, 3, 4,

    5, 6, 7, 8, 9, 10] • with a window size of 5: • (1 + 2 + 3 + 4 + 5) / 5 = 3 • (2 + 3 + 4 + 5 + 6) / 5 = 4 • (3 + 4 + 5 + 6 + 7) / 5 = 5 • etc.
  21. www.elastic.co 50 Moving average - dynamic thresholds • yellow -

    measured values • purple - moving average (ewma) • green - threshold, mean + (3 * standard deviation)
  22. www.elastic.co 51 Request Extended  stats  agg  for   mean  and

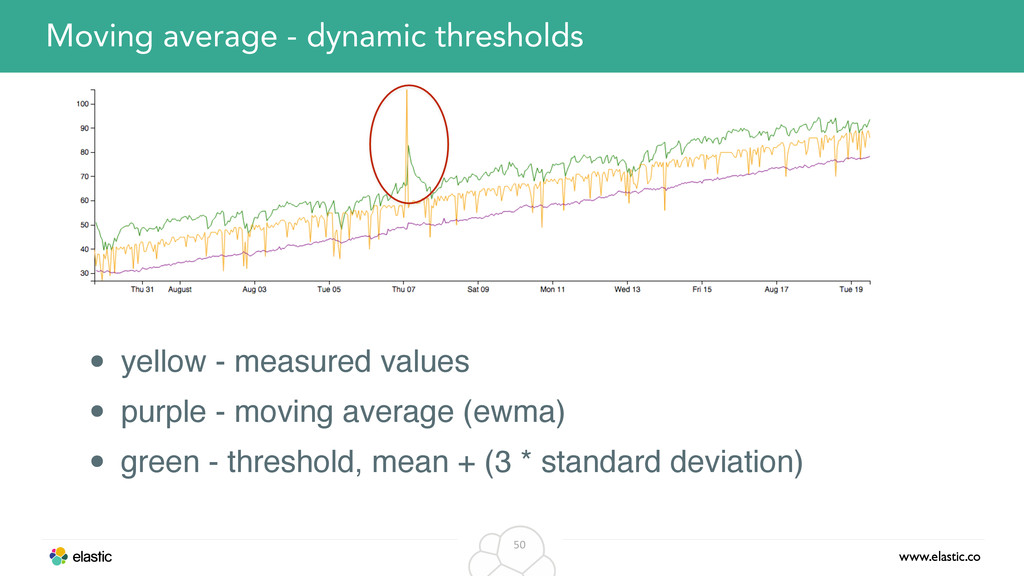
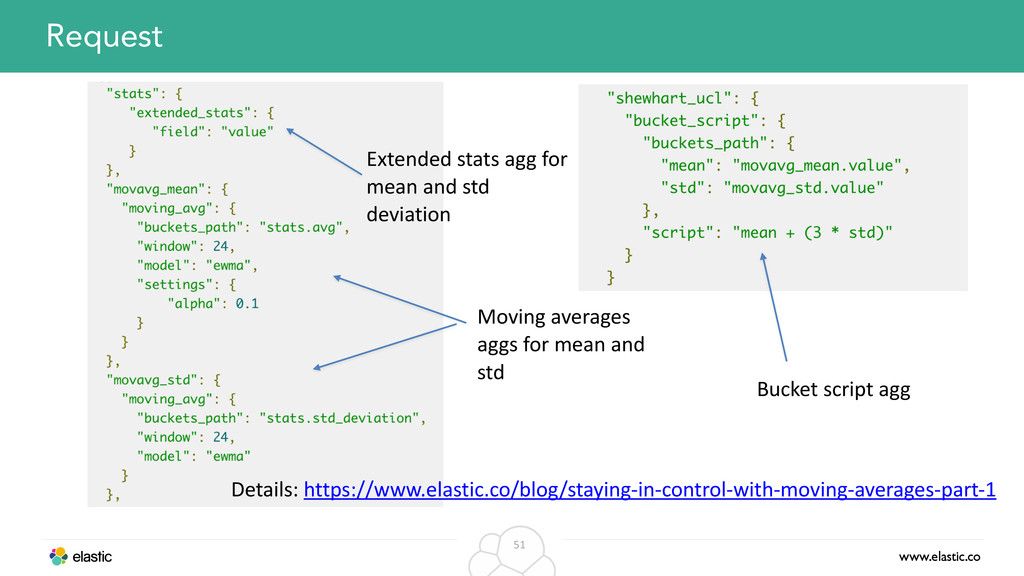
     std   deviation Moving  averages   aggs  for  mean  and   std Bucket  script  agg Details:  https://www.elastic.co/blog/staying-­‐in-­‐control-­‐with-­‐moving-­‐averages-­‐part-­‐1
  23. www.elastic.co 52 Cyclic trends - anomalies • EWMA lags behind

    too much • The values constantly hit the threshold
  24. www.elastic.co 53 Cyclic trends - anomalies • Holt-Winters (triple exponential)

    model works better for seasonal data • Requires two periods to bootstrap the algorithm