Upgrade to Pro — share decks privately, control downloads, hide ads and more …

Application performance management with open source tools

Application performance management with open source tools

Slides from our presentation at Berlin Buzzwords 2015.

Tudor Golubenco

June 01, 2015
Tweet

More Decks by Tudor Golubenco

Other Decks in Technology

Transcript

  1. Intro • Software devs • Worked at a startup doing

    a VoIP monitoring product • Startup acquired by Acme Packet, acquired by Oracle • Working on @packetbeat
  2. Scaling • Infrastructure: • scale to 100s, 1.000s, 10.000s of

    servers • Organization: • scale to 100s, 1.000s, 10.000s of employees
  3. Conway’s law • “Organizations which design systems ... are constrained

    to produce designs which are copies of the communication structures of these organizations"
  4. Evolution • Applications evolve over time • Adapt to new

    requirements • Mutations are kind of random • You need to select the good mutations
  5. Operational monitoring • Critical • It’s how you filter out

    the bad mutations and keep the good ones • Difficult • Highly heterogenous infrastructures • Show the global state of a distributed system
  6. Requirements • Scalable and reliable • Extract data from different

    sources • Low overhead • Low configuration • Simple, easy to understand
  7. Start from the communication • The communication between components gets

    you the big picture • Protocols are standard • Packet data is objective • No latency overhead
  8. Packetbeat shipper • Running on your application servers • Follows

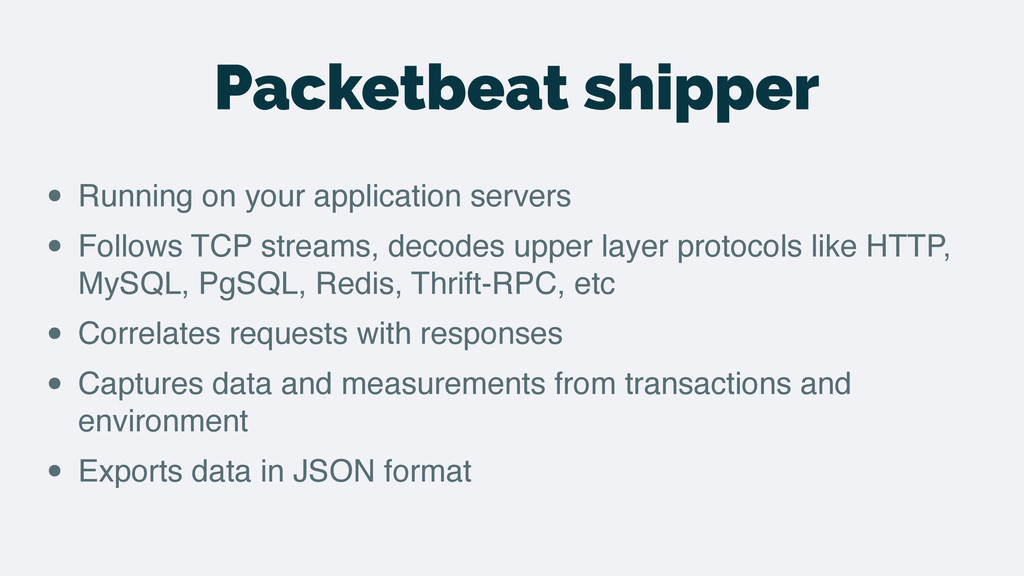
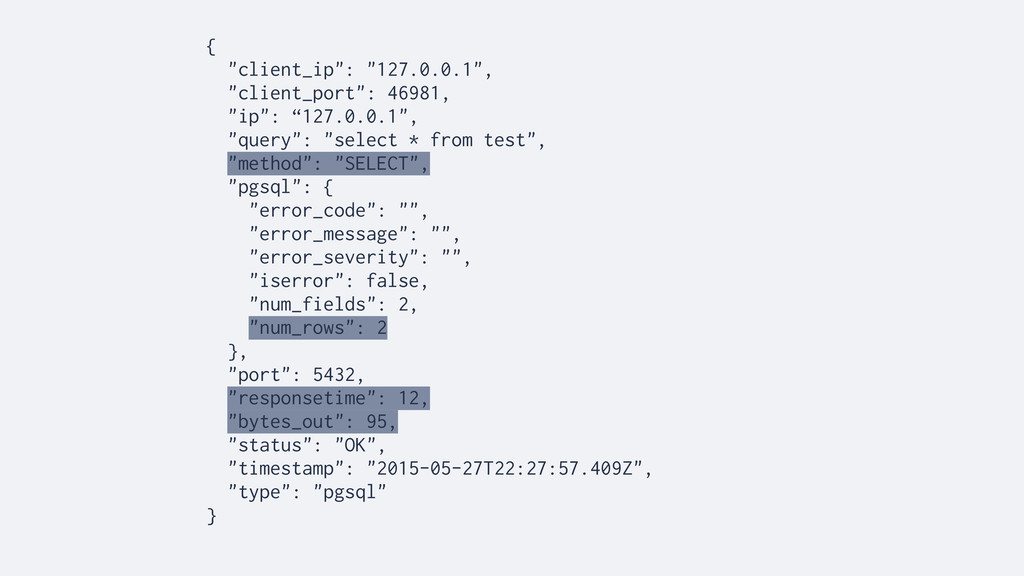
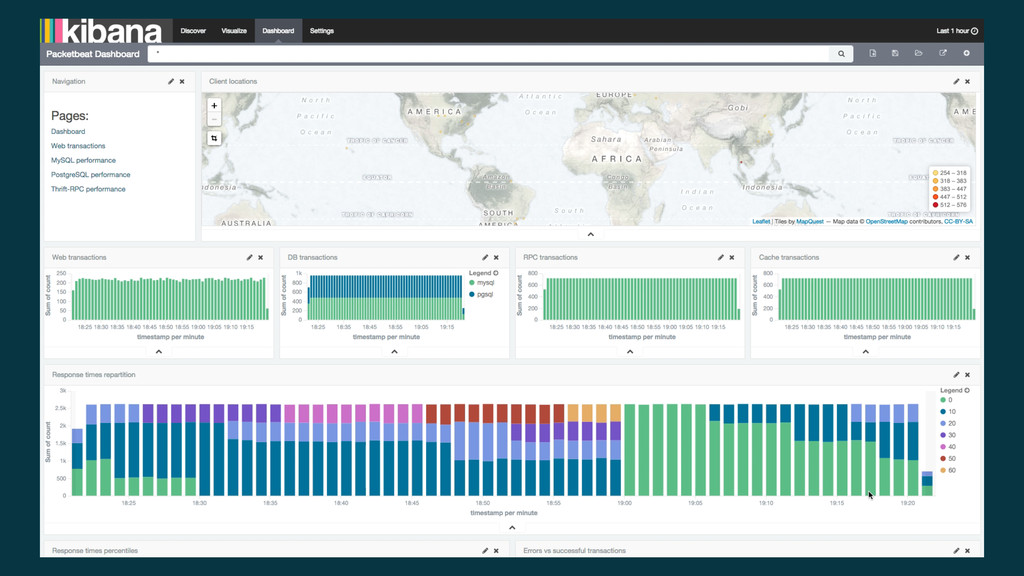
    TCP streams, decodes upper layer protocols like HTTP, MySQL, PgSQL, Redis, Thrift-RPC, etc • Correlates requests with responses • Captures data and measurements from transactions and environment • Exports data in JSON format
  9. { "client_ip": "127.0.0.1", "client_port": 46981, "ip": “127.0.0.1", "query": "select *

    from test", "method": "SELECT", "pgsql": { "error_code": "", "error_message": "", "error_severity": "", "iserror": false, "num_fields": 2, "num_rows": 2 }, "port": 5432, "responsetime": 12, "bytes_out": 95, "status": "OK", "timestamp": "2015-05-27T22:27:57.409Z", "type": "pgsql" }
  10. The traditional way • Decide what metrics you need (requests

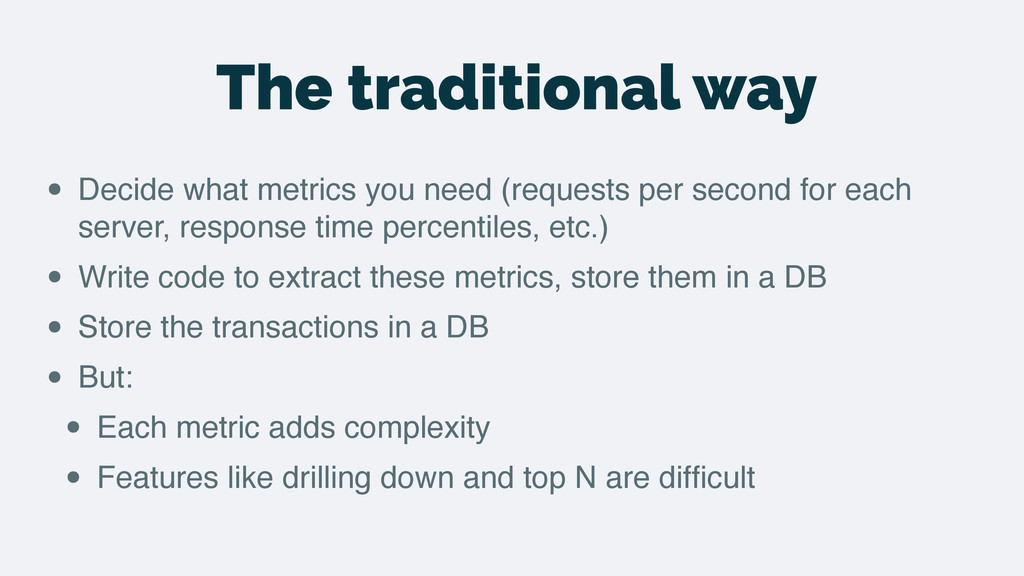
    per second for each server, response time percentiles, etc.) • Write code to extract these metrics, store them in a DB • Store the transactions in a DB • But: • Each metric adds complexity • Features like drilling down and top N are difficult
  11. Why ELK? • Already proven to scale and perform for

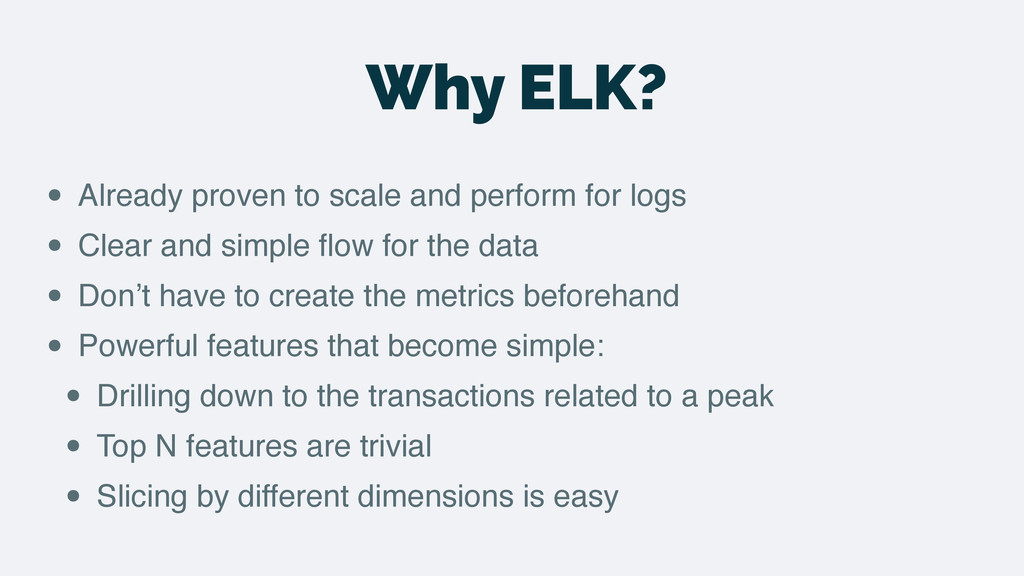
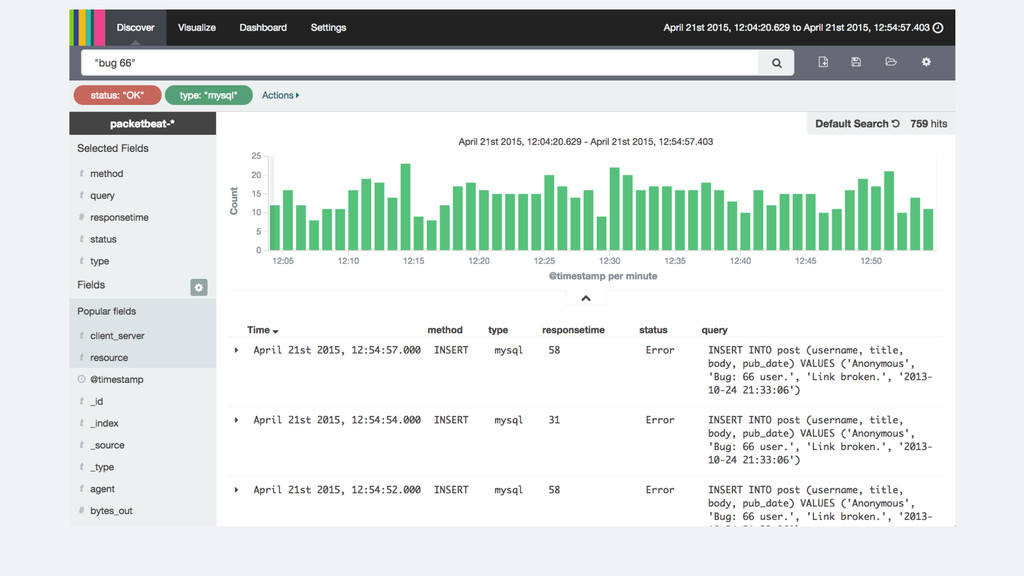
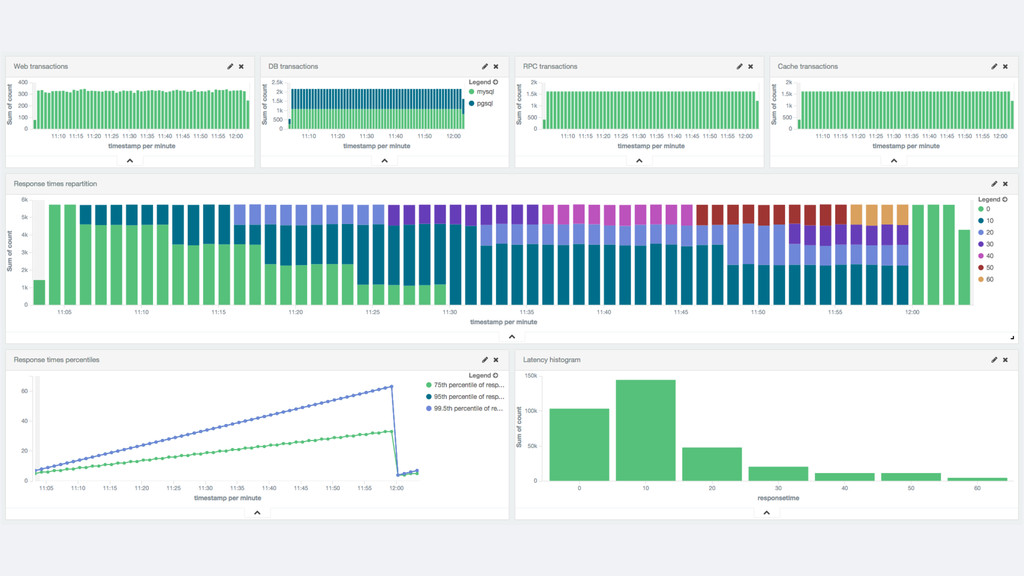
    logs • Clear and simple flow for the data • Don’t have to create the metrics beforehand • Powerful features that become simple: • Drilling down to the transactions related to a peak • Top N features are trivial • Slicing by different dimensions is easy
  12. Percentiles aggregation • Approximate values • T-digests algorithm by Ted

    Dunning • Accurate for small sets of values • More accurate for extreme percentiles
  13. Histogram by response time • Splits data in buckets by

    response time • [0-10ms), [10ms-20ms), …
  14. Terms aggregation • Buckets are dynamically built: one per unique

    value • By default: top 10 by document count • Approximate because each shard can have a different top 10
  15. Future plans • Packet data is just the beginning •

    Other sources of operational data: • OS readings: CPU, memory, IO stats • Code instrumentation, tracing • API gateways • Common servers internal stats (Nginx, Elasticsearch)
  16. The Beats • Packetbeat - data from the wire •

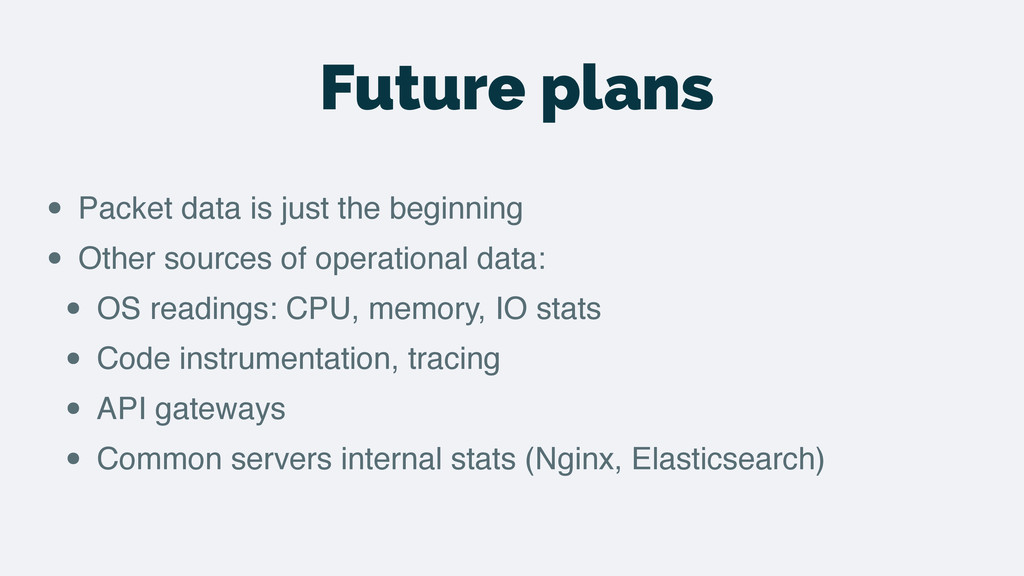
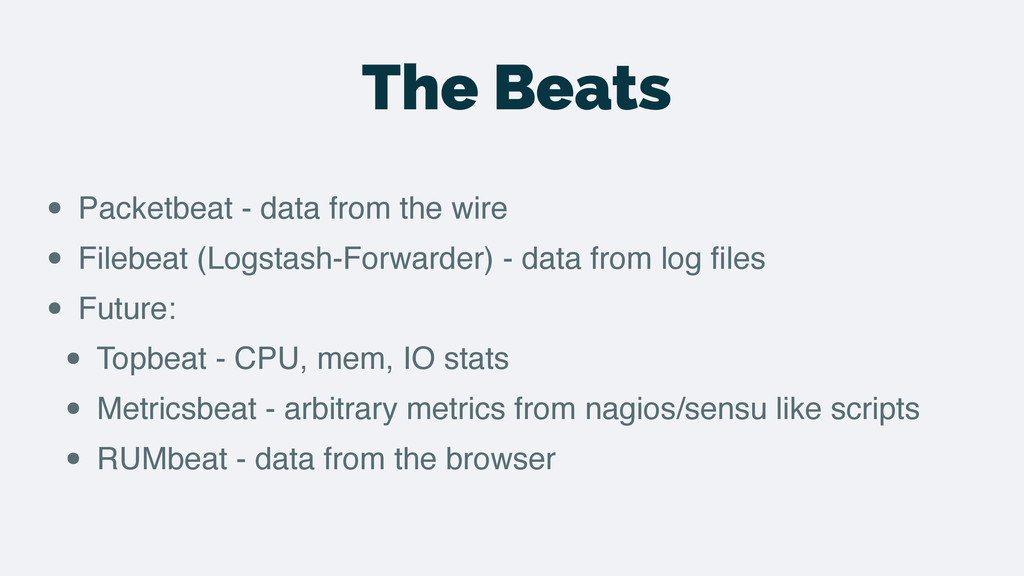
    Filebeat (Logstash-Forwarder) - data from log files • Future: • Topbeat - CPU, mem, IO stats • Metricsbeat - arbitrary metrics from nagios/sensu like scripts • RUMbeat - data from the browser
  17. Stay in touch • @packetbeat • https://discuss.elastic.co/c/beats • Sign up

    for the webinar: • https://www.elastic.co/webinars/beats-platform-for-leveraging- operational-data