Upgrade to Pro — share decks privately, control downloads, hide ads and more …

From ELK to Elastic: Modern logging and monitoring

From ELK to Elastic: Modern logging and monitoring

My presentation from Velocity Amsterdam 2016.

Tudor Golubenco

November 07, 2016
Tweet

More Decks by Tudor Golubenco

Other Decks in Technology

Transcript

  1. • Core and main plugins re- written in Java •

    performance improvements • Persistent Queue (WIP) • no drops when killed • Monitoring APIs • no more a black box 6 Logstash new features
  2. 9 Jun 9, 2015 1.6 Jul 16, 2015 1.7 Feb

    19, 2015 4.0 Jun 10, 2015 4.1 May 14th, 2015 1.5 May 27th, 2015 1.0 Beta 1 July 13th, 2015 1.0 Beta 2 Sept 4 th, 2015 1.0 Beta 3 May 23, 2015 1.5 Nov 5, 2014 1.4 It’s complicated es kibana ls beats
  3. Reading cgroup data from /proc/ • Doesn’t require access to

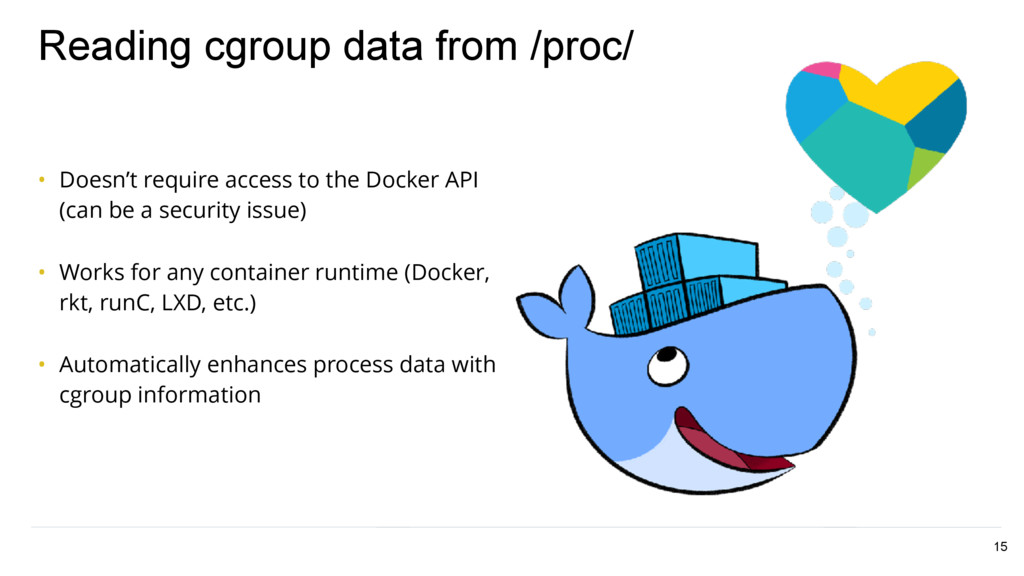
    the Docker API (can be a security issue) • Works for any container runtime (Docker, rkt, runC, LXD, etc.) • Automatically enhances process data with cgroup information 15
  4. Querying the Docker API • Dedicated Docker module • Has

    access to container names and labels • It’s somehow easier to setup 16
  5. #velo Elasticsearch BKD trees 19 • Added for Geo-points •

    faster to index • faster to query • more disk-efficient • more memory efficient
  6. 0 10000 20000 30000 40000 50000 60000 70000 80000 float

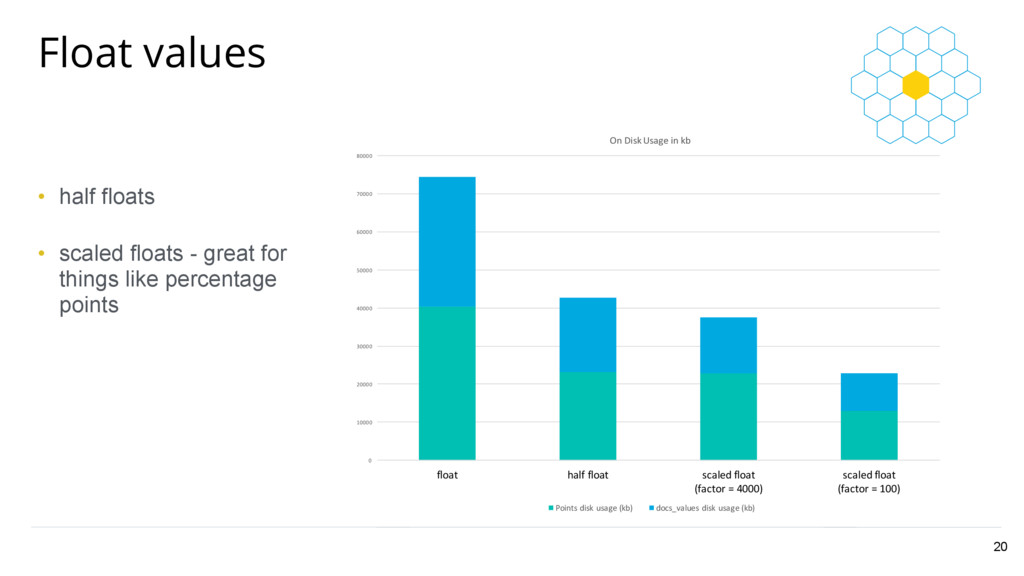
    half float scaled float (factor = 4000) scaled float (factor = 100) On Disk Usage in kb Points disk usage (kb) docs_values disk usage (kb) Float values 20 • half floats • scaled floats - great for things like percentage points
  7. #velo Why Elasticsearch for time series • Horizontal scalability. Mature

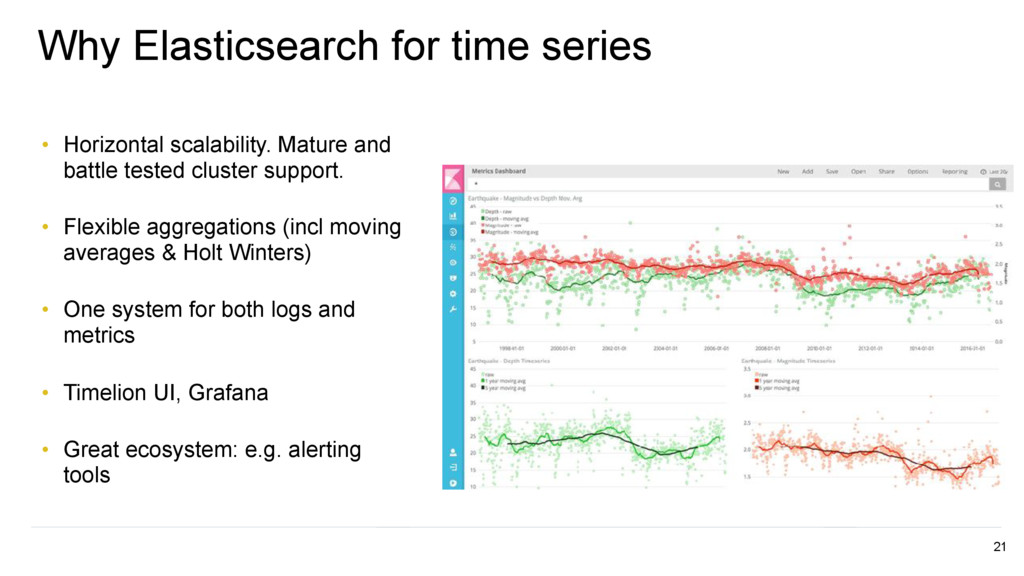
    and battle tested cluster support. • Flexible aggregations (incl moving averages & Holt Winters) • One system for both logs and metrics • Timelion UI, Grafana • Great ecosystem: e.g. alerting tools 21
  8. • Supports multiple file rotation strategies • “At least once”

    guarantees, handles backpressure • Extra powers: • Multiline • Filtering • JSON decoding 23 Filebeat
  9. #velo 26 batch of messages ack Synchronous sending stream of

    log lines read read acked registry file
  10. #velo 27 batch of messages When things go wrong ack

    0 (still alive) ack 50% ack 100% read acked
  11. • Filebeat adapts it’s speed automatically to as much as

    the next stage can ingest • Simliar to the “pull” model • But: beaware when benchmarking 28 This means..
  12. • Filebeat patiently waits • Log lines are not lost

    • It doesn’t allocate memory, it doesn’t buffer things on disk 29 When the next stage is down..
  13. #velo 33 batch of messages ack batch of messages same

    batch of messages ack duplicates!
  14. #velo Potential strategy to reduce dupes • Filebeat generates an

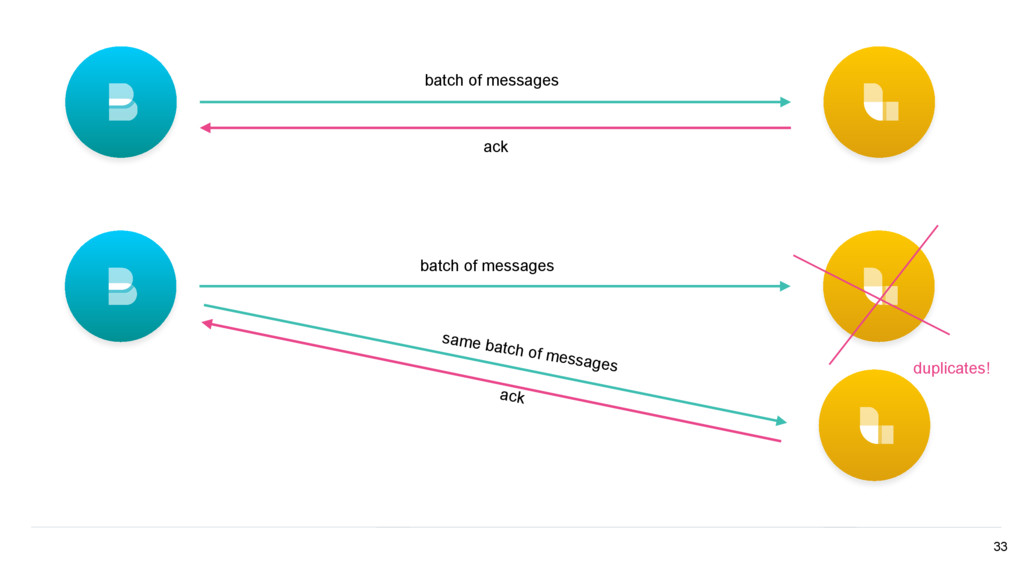
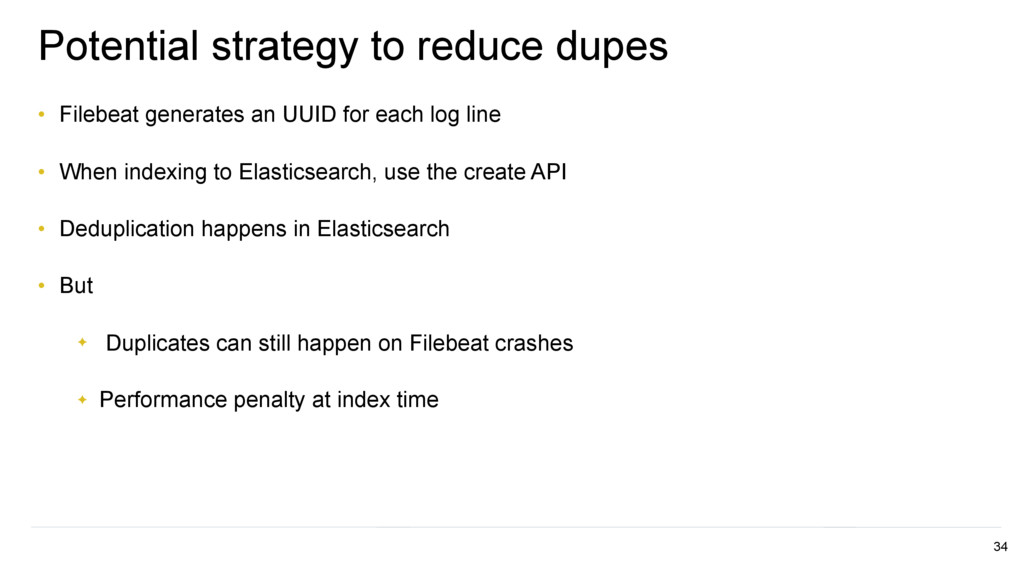
    UUID for each log line • When indexing to Elasticsearch, use the create API • Deduplication happens in Elasticsearch • But ✦ Duplicates can still happen on Filebeat crashes ✦ Performance penalty at index time 34
  15. Classic logging logging.debug("User '{}' (id: {}) successfully logged in. Session

    id: {}” .format(user["name"], user["id"], session_id)) which results in: DEBUG:root:User 'arthur' (id: 42) successfully logged in. Session id: 91e5b9d 36
  16. Structured logging • Use a logging library that allows code

    like: log = log.bind(user='arthur', id=42, verified=False) log.msg(‘logged_in’) • Which creates log lines like: {"verified": false, "user": "arthur", "session_id": "91e5b9d", "id": 42, "event": “logged_in"} 37