Upgrade to Pro — share decks privately, control downloads, hide ads and more …

Predictive Buffering for Streaming Video in 3G Networks

Predictive Buffering for Streaming Video in 3G Networks

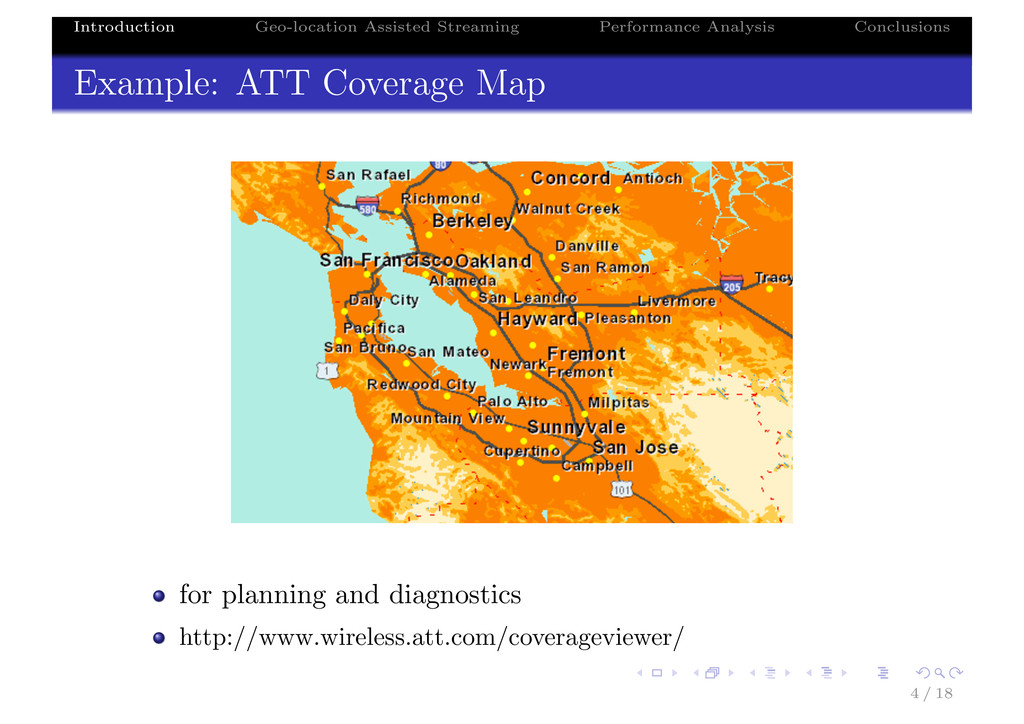
Also called: Geo-Location Assisted Streaming Service
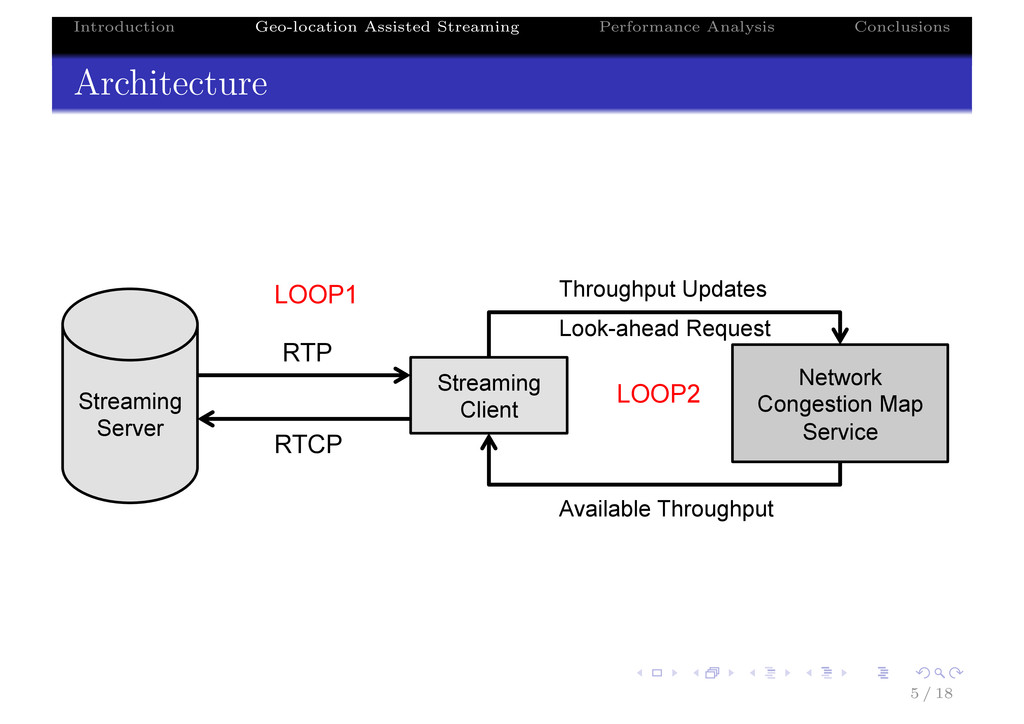
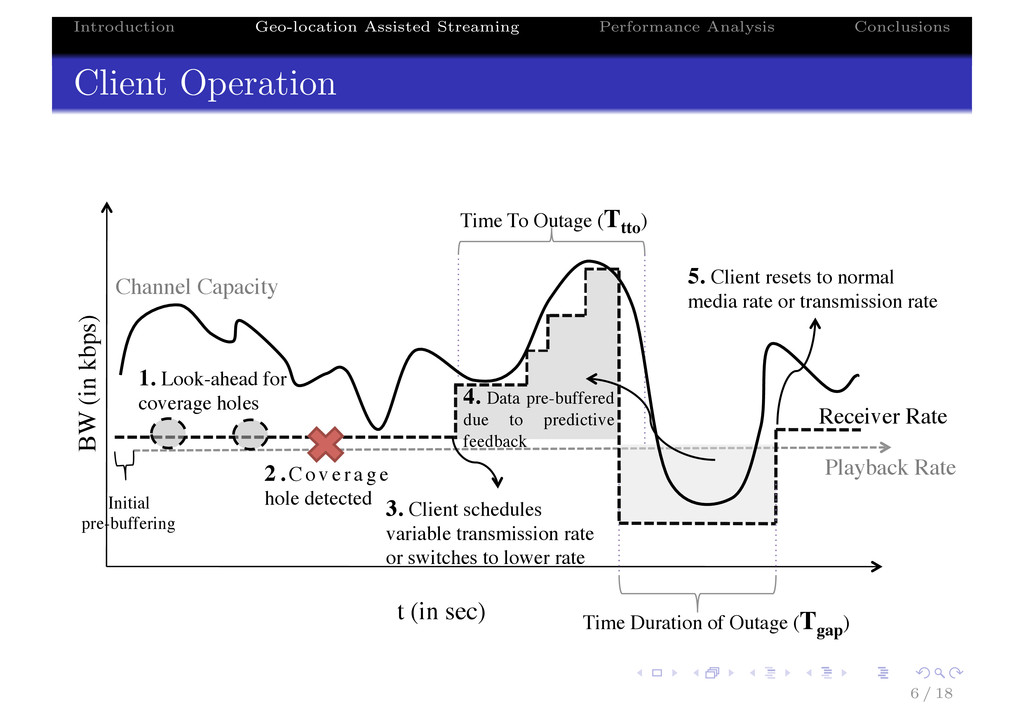
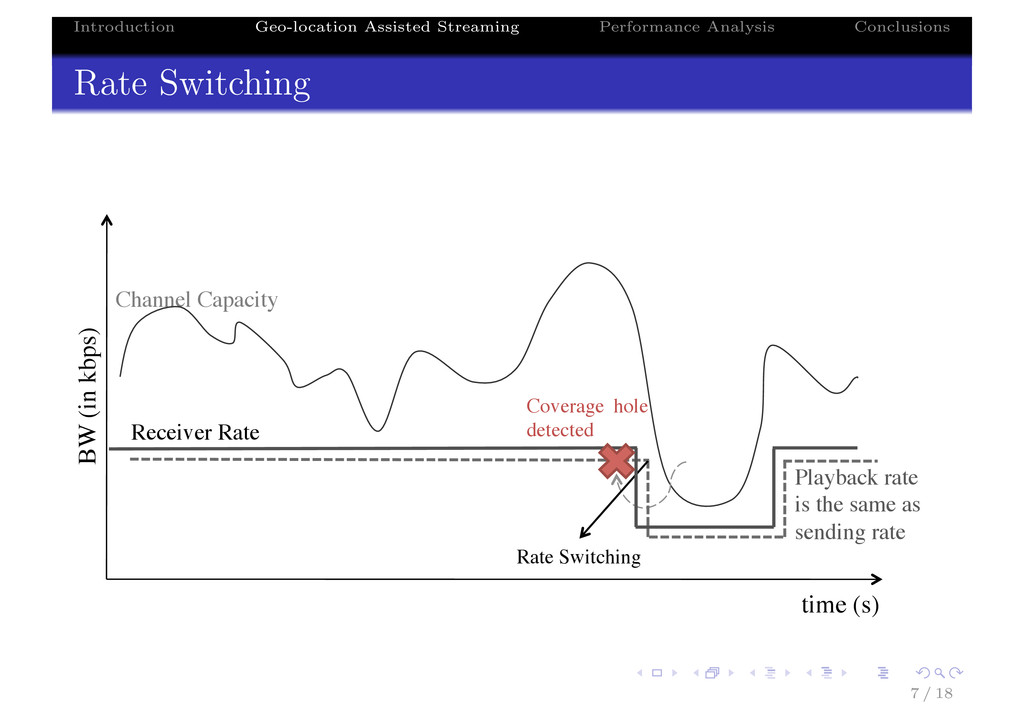
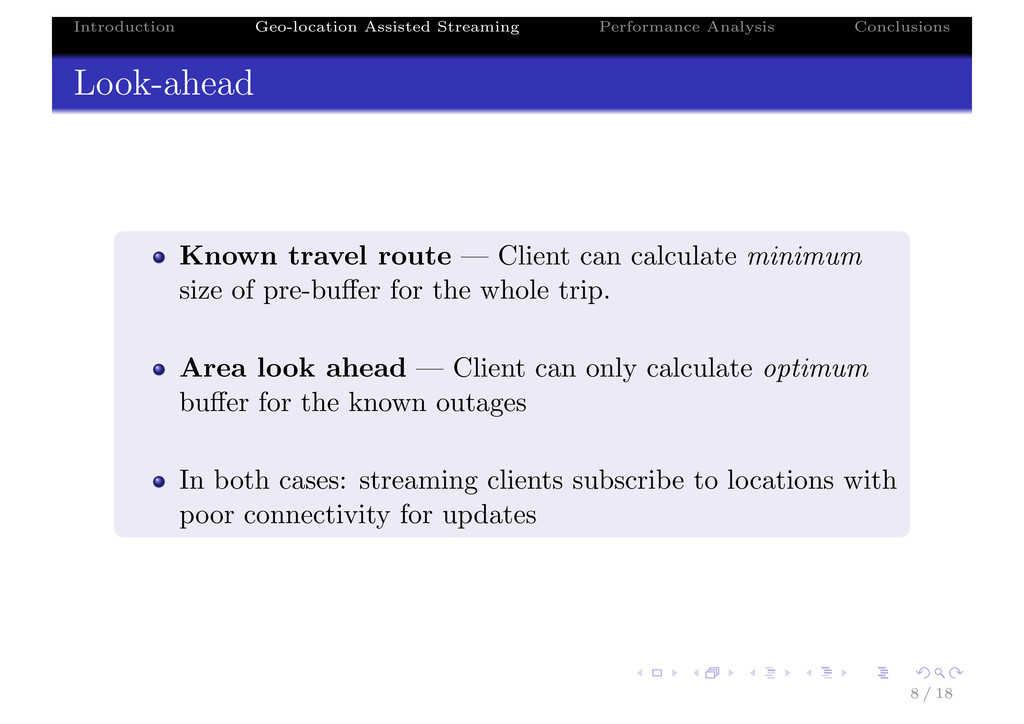
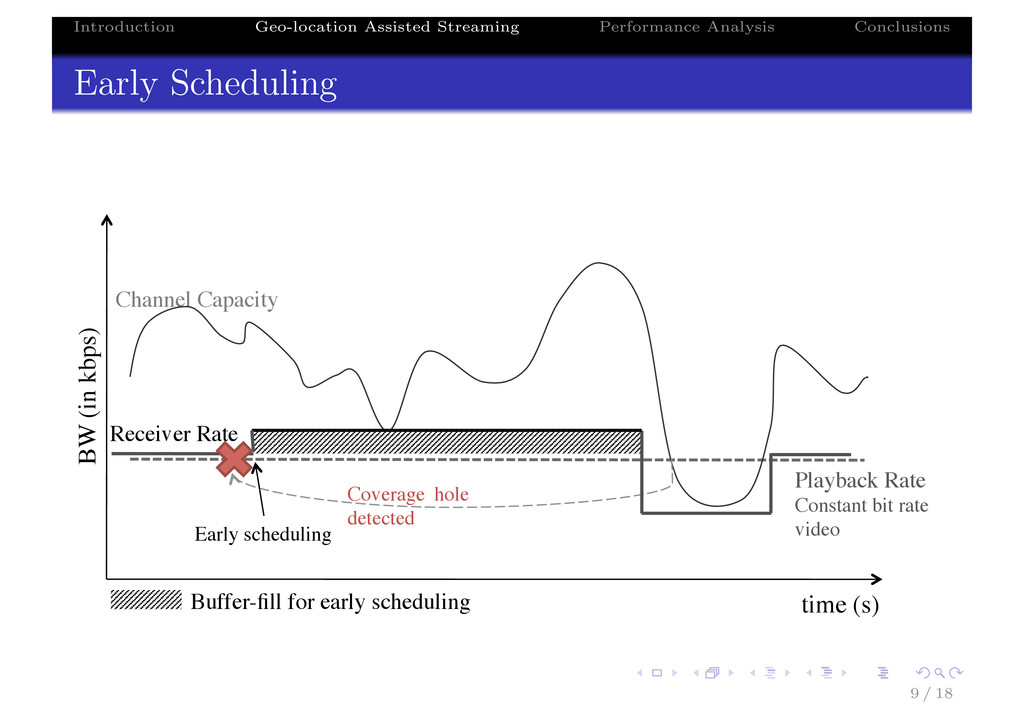
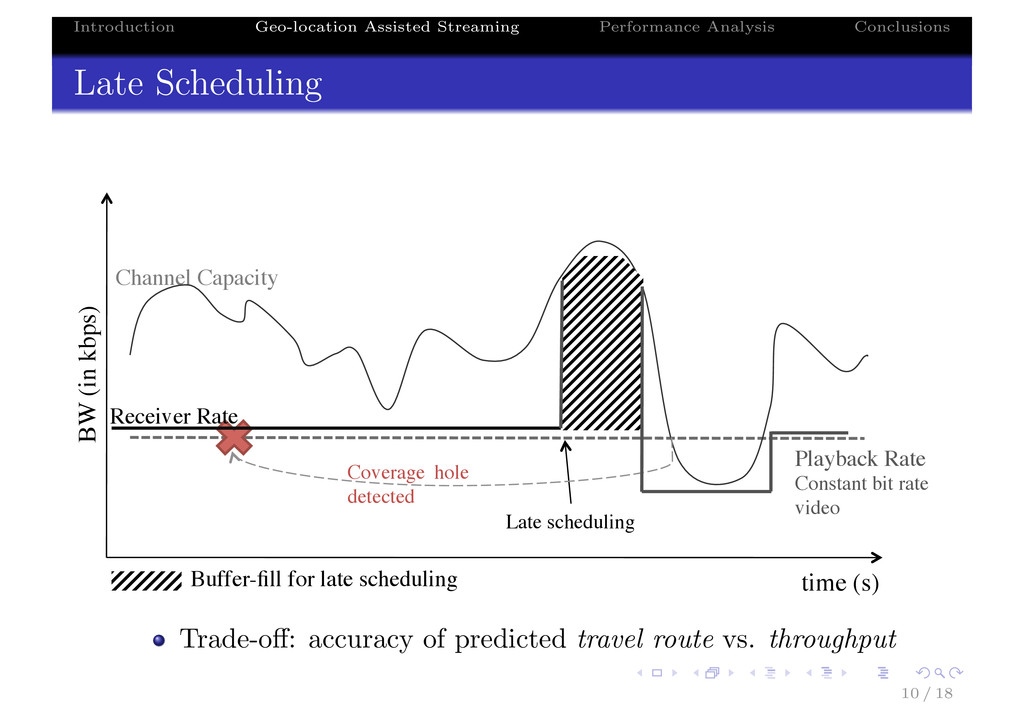
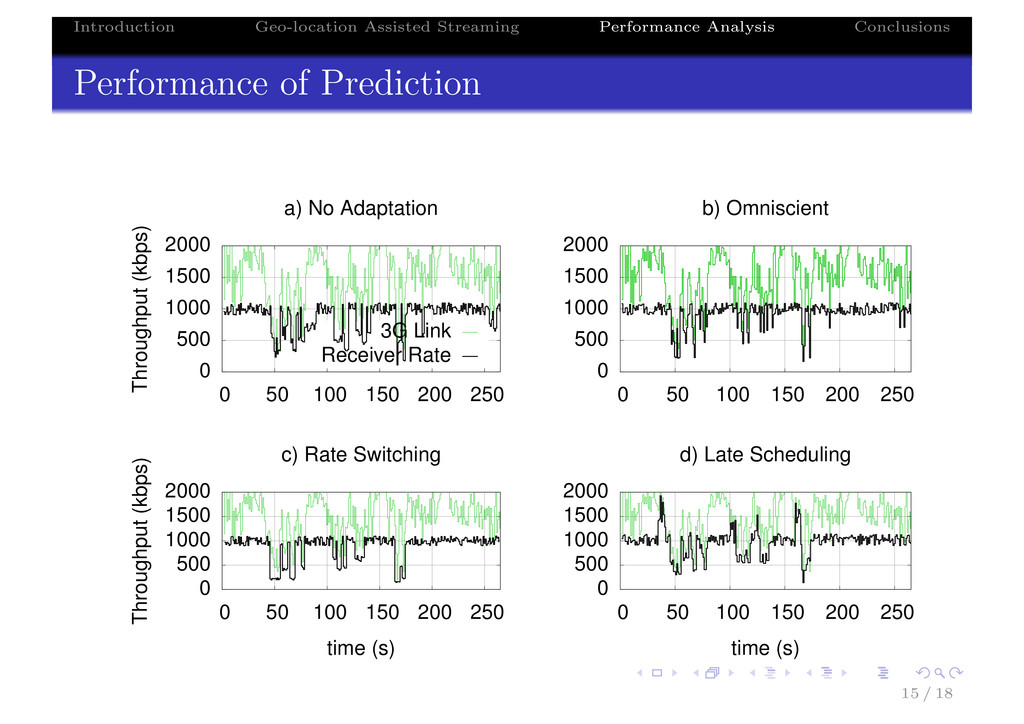
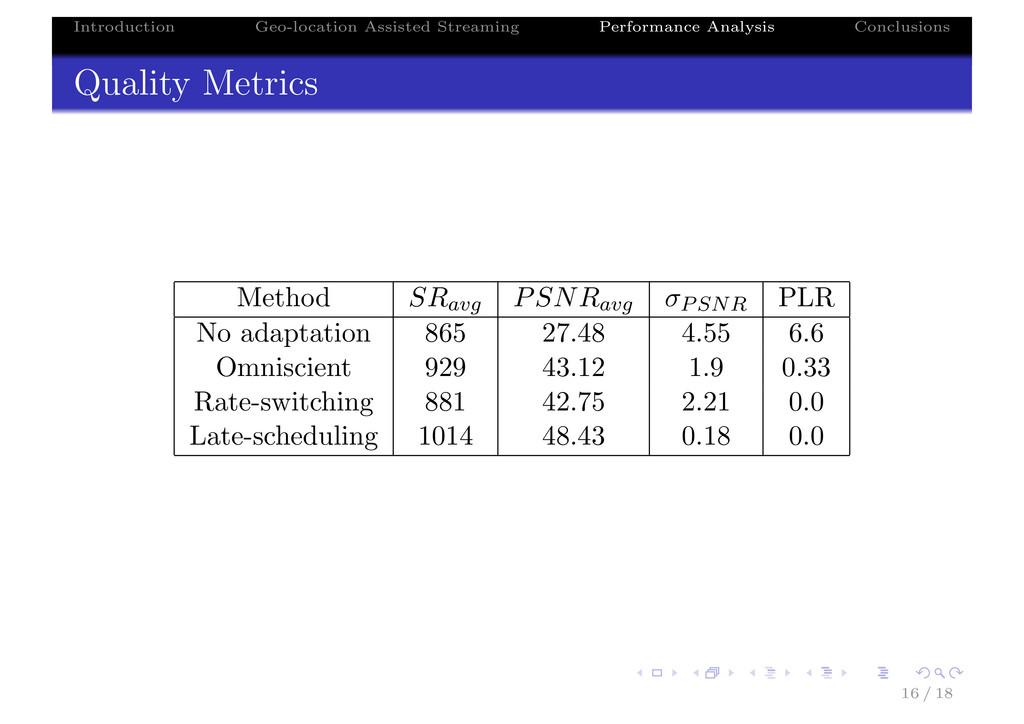
We present a multimedia streaming service in a mobile (3G) environment that, in addition to in-band congestion signals such as packet losses and delay variations, receives congestion cues from a Network Coverage Map Service (NCMS) to make rate-control decisions. The streaming client routinely queries the NCMS to assess the network conditions at future locations along its expected path. The streaming client may ask the streaming server for short-term transmission bursts to increase pre-buffering when it is approaching areas with bad network performance to maintain media quality. If needed, the client may also switch to a different encoding rate (rate-switching) depending on the severity of expected congestion. These notifications are scheduled as late as possible, so that any changes in network conditions and/or changes in user's movements can be taken into account (late scheduling). Using this type of geo-predictive media streaming service we show that the streaming client can provide pause-less playback and better quality of experience to the user.

Varun Singh

June 26, 2012
Tweet

More Decks by Varun Singh

Other Decks in Research

Transcript

  1. Introduction Geo-location Assisted Streaming Performance Analysis Conclusions Predictive Buffering for

    Streaming Video in 3G Networks (WoWMoM 2012) Varun Singh, J¨ org Ott, Igor Curcio Comnet, Aalto University, {varun,jo}@comnet.tkk.fi Nokia Research Center, [email protected] June 26, 2012 1 / 18
  2. Introduction Geo-location Assisted Streaming Performance Analysis Conclusions Observed Trends 22%

    of mobile broadband in the US is YouTube [MobileTrends, 2011]. http://m.youtube.com uses RTSP instead of HTTP based progressive download. Re-buffering is the main cause of bad user experience. Due to Mobility (fading, interference, cell loading, handovers) affects available throughput 2 / 18
  3. Introduction Geo-location Assisted Streaming Performance Analysis Conclusions Quick introduction to

    the Real-time Transport Protocol Is widely used for telephony, video conferencing, and telepresence applications Often used over best-effort UDP/IP networks RTP provides playout timing and packet sequencing Reception quality feedback every few seconds (RTCP) RTCP provides higher-level summary feedback instead of per-packet feedback 3 / 18
  4. Introduction Geo-location Assisted Streaming Performance Analysis Conclusions Quick introduction to

    the Real-time Transport Protocol Is widely used for telephony, video conferencing, and telepresence applications Often used over best-effort UDP/IP networks RTP provides playout timing and packet sequencing Reception quality feedback every few seconds (RTCP) RTCP provides higher-level summary feedback instead of per-packet feedback Response to Congestion Typical pre-buffer is of 5 to 10s In mobile networks outages can be longer than the pre-buffer size Rate-switching usually happens after disruption is detected 3 / 18
  5. Introduction Geo-location Assisted Streaming Performance Analysis Conclusions Example: ATT Coverage

    Map for planning and diagnostics http://www.wireless.att.com/coverageviewer/ 4 / 18
  6. Introduction Geo-location Assisted Streaming Performance Analysis Conclusions Architecture Streaming Server

    Network Congestion Map Service RTP Throughput Updates Look-ahead Request Available Throughput RTCP Streaming Client LOOP1 LOOP2 5 / 18
  7. Introduction Geo-location Assisted Streaming Performance Analysis Conclusions Client Operation t

    (in sec) BW (in kbps) Playback Rate Time To Outage (Ttto) Channel Capacity Receiver Rate 4. Data pre-buffered due to predictive feedback Initial pre-buffering Time Duration of Outage (Tgap) 2 .C o v e r a g e hole detected 3. Client schedules variable transmission rate or switches to lower rate 1. Look-ahead for coverage holes 5. Client resets to normal media rate or transmission rate 6 / 18
  8. Introduction Geo-location Assisted Streaming Performance Analysis Conclusions Rate Switching BW

    (in kbps) Playback rate is the same as sending rate Channel Capacity Coverage hole detected time (s) Rate Switching Receiver Rate 7 / 18
  9. Introduction Geo-location Assisted Streaming Performance Analysis Conclusions Look-ahead Known travel

    route — Client can calculate minimum size of pre-buffer for the whole trip. Area look ahead — Client can only calculate optimum buffer for the known outages In both cases: streaming clients subscribe to locations with poor connectivity for updates 8 / 18
  10. Introduction Geo-location Assisted Streaming Performance Analysis Conclusions Early Scheduling BW

    (in kbps) Playback Rate Constant bit rate video Channel Capacity Coverage hole detected Early scheduling time (s) Buffer-fill for early scheduling Receiver Rate 9 / 18
  11. Introduction Geo-location Assisted Streaming Performance Analysis Conclusions Late Scheduling BW

    (in kbps) Playback Rate Constant bit rate video Channel Capacity Coverage hole detected Late scheduling time (s) Buffer-fill for late scheduling Receiver Rate Trade-off: accuracy of predicted travel route vs. throughput 10 / 18
  12. Introduction Geo-location Assisted Streaming Performance Analysis Conclusions Implementation HTTP between

    Coverage Map Server and client REpresentational State Transfer (REST) APIs JSON encoded responses PostgreSQL, C++ Google Maps API How to throttle the rate? Dictionary of {time, throughput} RTSP Speed parameter Or just switch media rates using Temporal Maximum Media Bitrate Request (TMMBR) Gstreamer using x264 and JRTPLib Media Rates: 64, 128, 256, 512, 768 and 1000 kbps 12 / 18
  13. Introduction Geo-location Assisted Streaming Performance Analysis Conclusions Helsinki Traces 400K

    updates 40–50 bus trips and walking around the city & campus 13 / 18
  14. Introduction Geo-location Assisted Streaming Performance Analysis Conclusions Bandwidth along a

    Travel Route 0 500 1000 1500 2000 2500 3000 60.187902,24.828374 60.186355,24.826504 60.174801,24.800772 60.175371,24.70583 60.175371,24.70583 60.163694,24.79771 60.161182,24.760993 60.161997,24.748103 60.165134,24.732384 60.162382,24.801506 60.185611,24.825956 60.162604,24.774443 60.159163,24.785112 60.1827,24.795065 60.186201,24.823197 throughput (kbps) locations (lat,lon) Intermediate Quartile Range 14 / 18
  15. Introduction Geo-location Assisted Streaming Performance Analysis Conclusions Performance of Prediction

    0 500 1000 1500 2000 0 50 100 150 200 250 Throughput (kbps) a) No Adaptation 3G Link Receiver Rate 0 500 1000 1500 2000 0 50 100 150 200 250 Throughput (kbps) time (s) c) Rate Switching 0 500 1000 1500 2000 0 50 100 150 200 250 b) Omniscient 0 500 1000 1500 2000 0 50 100 150 200 250 time (s) d) Late Scheduling 15 / 18
  16. Introduction Geo-location Assisted Streaming Performance Analysis Conclusions Quality Metrics Method

    SRavg PSNRavg σPSNR PLR No adaptation 865 27.48 4.55 6.6 Omniscient 929 43.12 1.9 0.33 Rate-switching 881 42.75 2.21 0.0 Late-scheduling 1014 48.43 0.18 0.0 16 / 18
  17. Introduction Geo-location Assisted Streaming Performance Analysis Conclusions Performance of Map

    Server1: NCMSratio = Reported Actual 0 0.2 0.4 0.6 0.8 1 0 0.2 0.4 0.6 0.8 1 CCDF Average over short history (at 1hr) Omniscient Late Scheduling Early Scheduling 0 0.2 0.4 0.6 0.8 1 0 0.2 0.4 0.6 0.8 1 (at 8hr) 0 0.2 0.4 0.6 0.8 1 0 0.2 0.4 0.6 0.8 1 CCDF Average over long history (at 1hr) Omniscient Late Scheduling Early Scheduling 0 0.2 0.4 0.6 0.8 1 0 0.2 0.4 0.6 0.8 1 (at 8hr) 1 More details in M.Sc Thesis: S. Chatterjee, “Crowd-sourcing mobile internet access statistics to improve video streaming” 17 / 18
  18. Introduction Geo-location Assisted Streaming Performance Analysis Conclusions Conclusions Applying predictions

    improves quality Complements in-band congestion control mechanisms Could use any other existing measurement system Future Work: Integrate with a DASH system, scalability of Coverage Map Server NCMS details in “Crowd-sourcing mobile internet access statistics to improve video streaming”, S. Chatterjee. Download 3G measurement tool (UDP/TCP throughput, RTT) at http://www.nettitutka.fi/ 18 / 18