live-blog and tweet this presentation given that you attribute it to its author and respect the rights and licences of its parts. based on slides by @SMEasterbrook und @ethanwhite
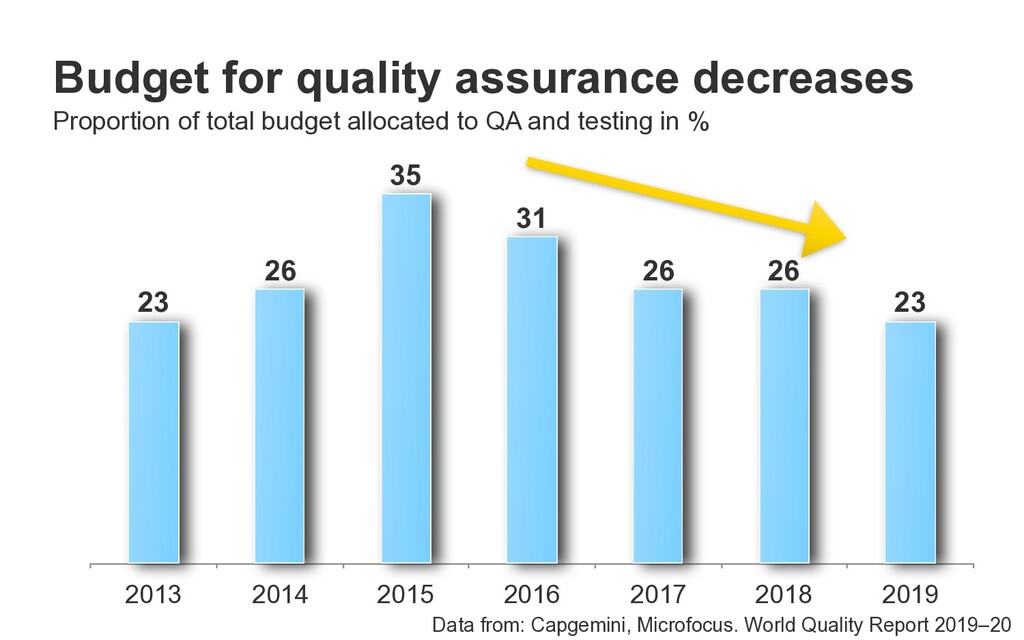
31 35 26 23 Budget for quality assurance decreases Proportion of total budget allocated to QA and testing in % Data from: Capgemini, Microfocus. World Quality Report 2019–20
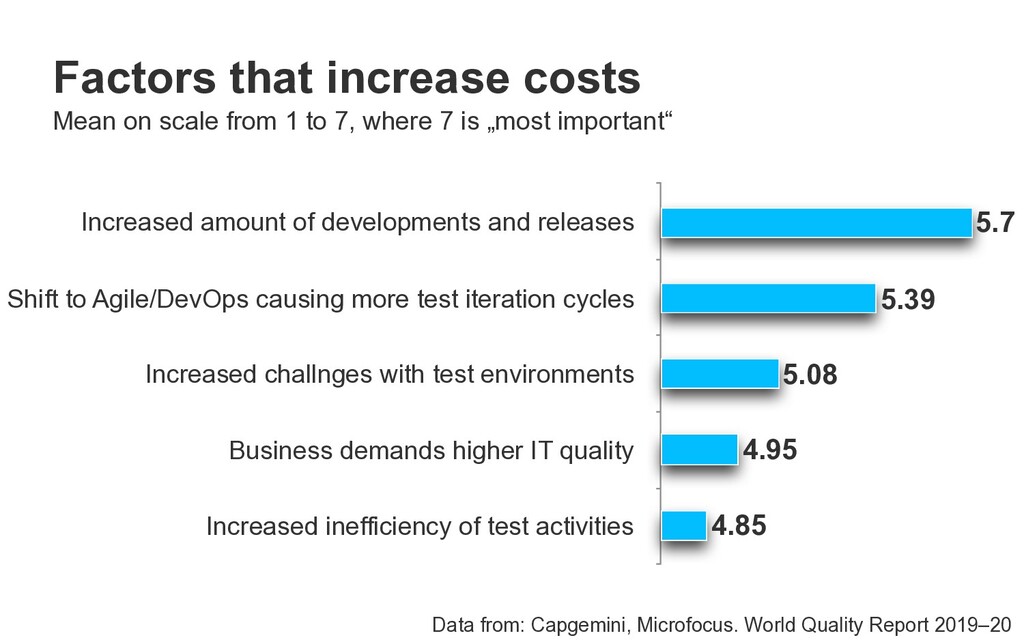
more test iteration cycles Increased challnges with test environments Business demands higher IT quality Increased inefficiency of test activities 4.85 4.95 5.08 5.39 5.7 Factors that increase costs Mean on scale from 1 to 7, where 7 is „most important“ Data from: Capgemini, Microfocus. World Quality Report 2019–20
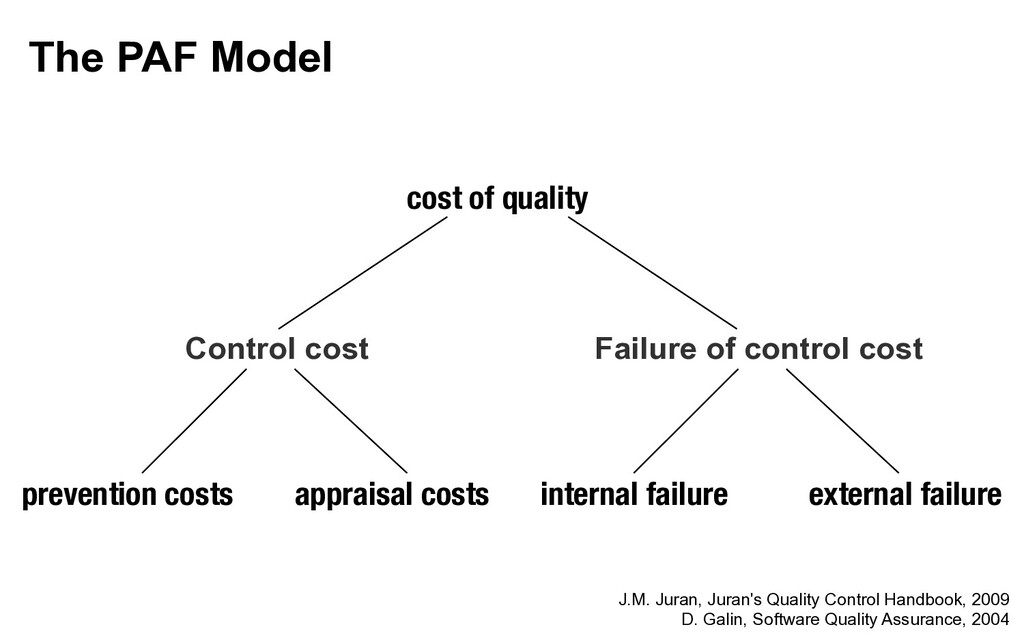
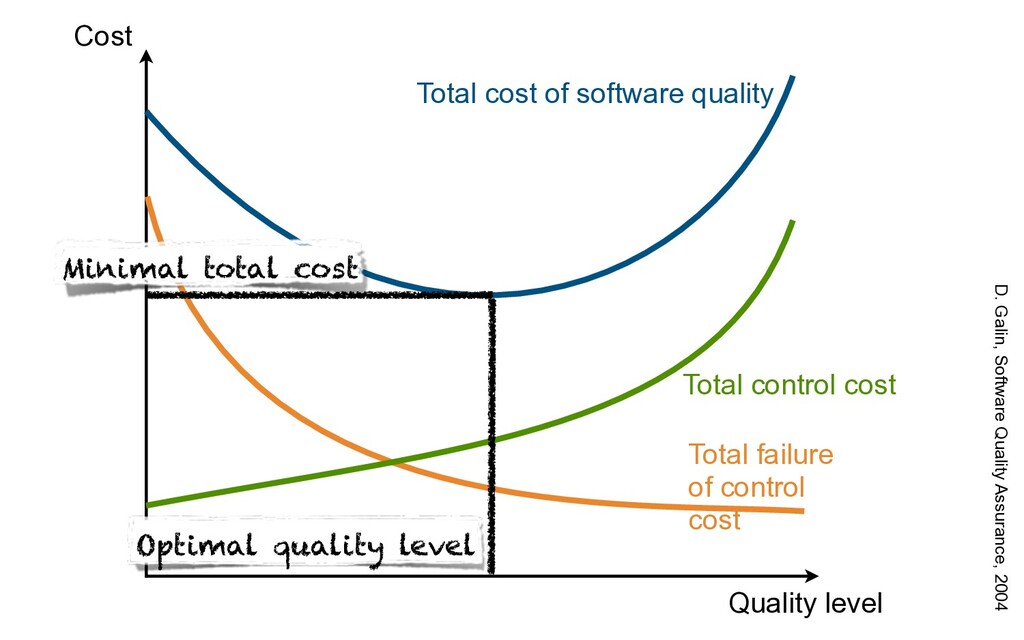
failure nonconformance conformance The PAF Model J.M. Juran, Juran's Quality Control Handbook, 2009 D. Galin, Software Quality Assurance, 2004 Control cost Failure of control cost
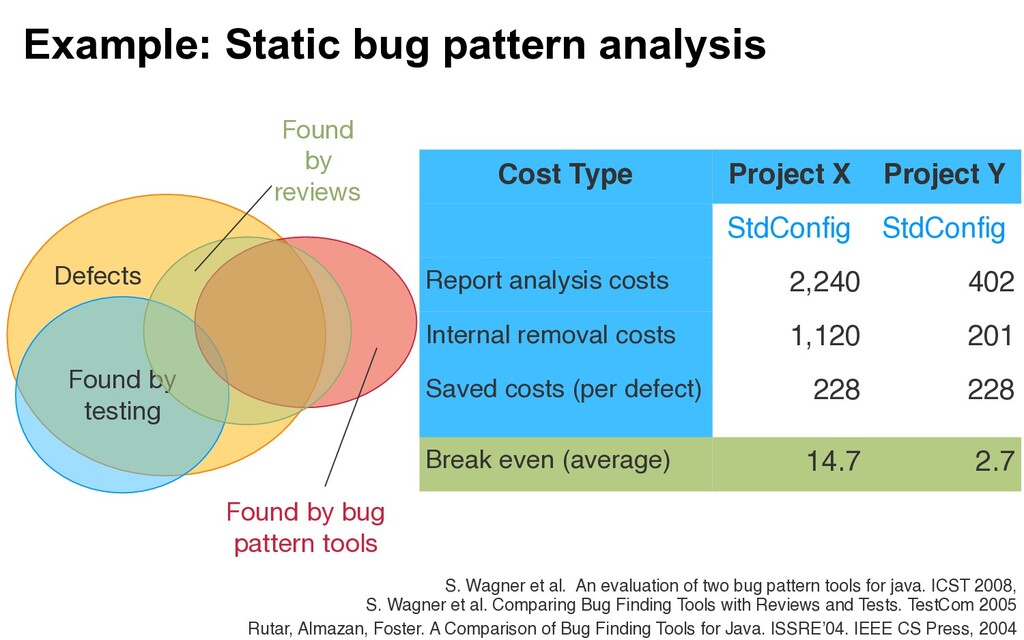
by reviews Found by bug pattern tools S. Wagner et al. An evaluation of two bug pattern tools for java. ICST 2008, S. Wagner et al. Comparing Bug Finding Tools with Reviews and Tests. TestCom 2005 Rutar, Almazan, Foster. A Comparison of Bug Finding Tools for Java. ISSRE’04. IEEE CS Press, 2004 Cost Type Project X Project Y StdConfig StdConfig Report analysis costs 2,240 402 Internal removal costs 1,120 201 Saved costs (per defect) 228 228 Break even (average) 14.7 2.7
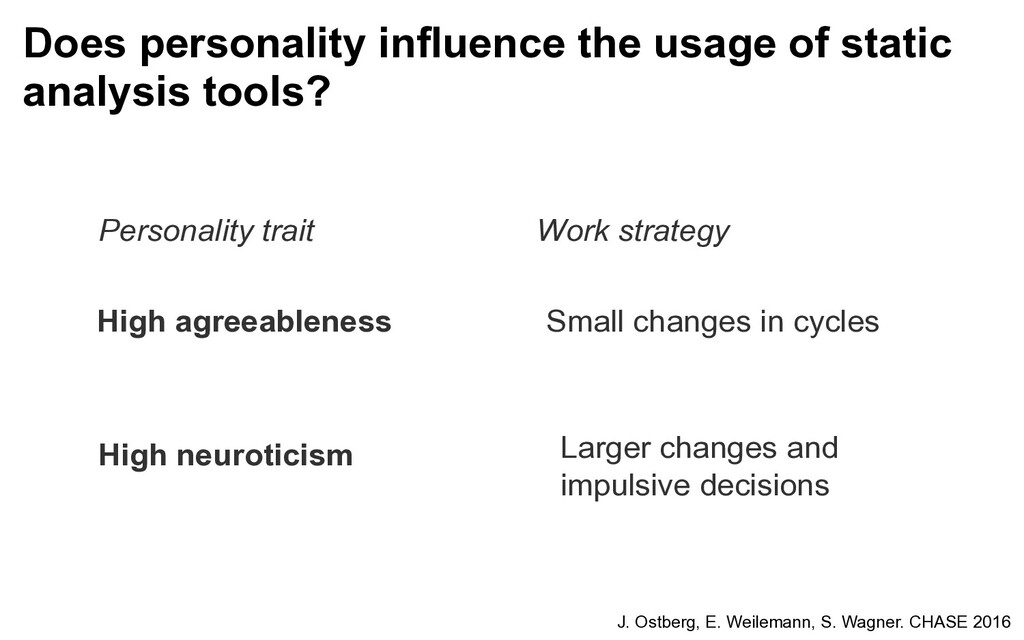
Ostberg, E. Weilemann, S. Wagner. CHASE 2016 High agreeableness High neuroticism Small changes in cycles Larger changes and impulsive decisions Personality trait Work strategy
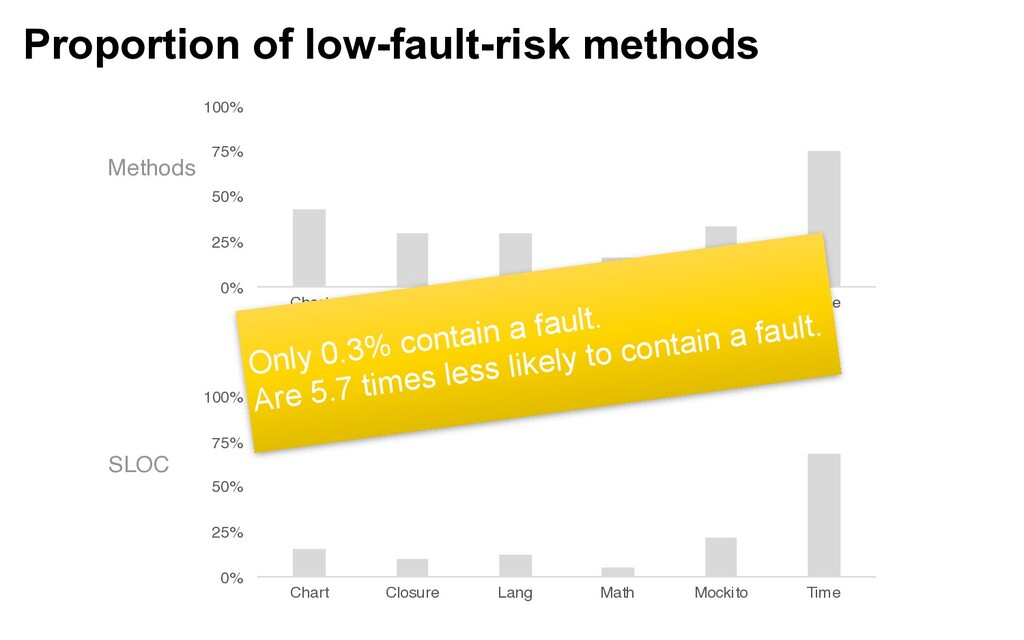
Closure Lang Math Mockito Time 0% 25% 50% 75% 100% Chart Closure Lang Math Mockito Time Methods SLOC Only 0.3% contain a fault. Are 5.7 times less likely to contain a fault.
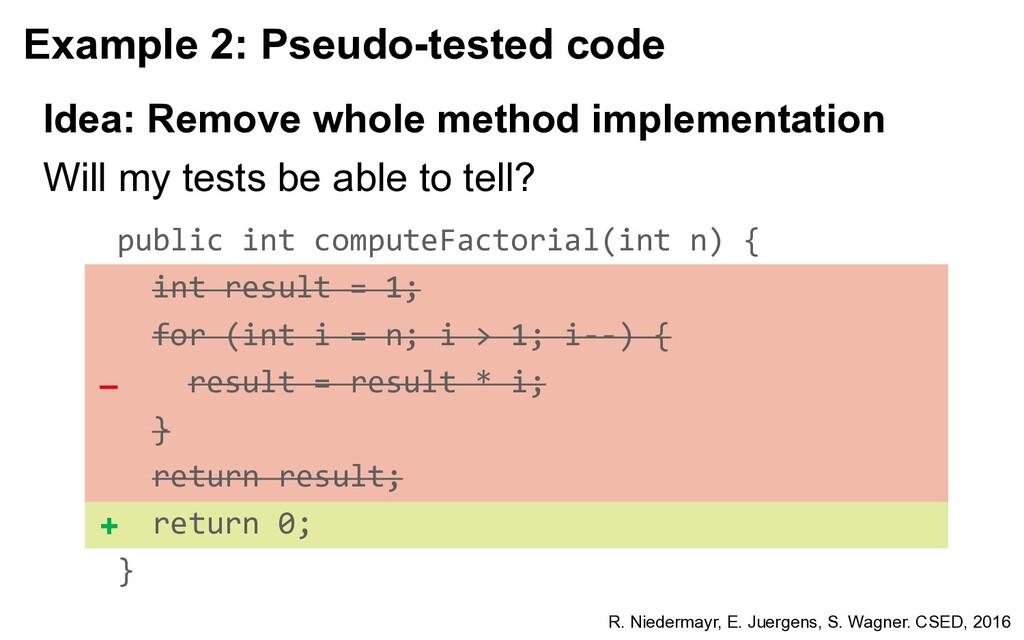
tell? Idea: Remove whole method implementation R. Niedermayr, E. Juergens, S. Wagner. CSED, 2016 + – public int computeFactorial(int n) { int result = 1; for (int i = n; i > 1; i--) { result = result * i; } return result; return 0; }
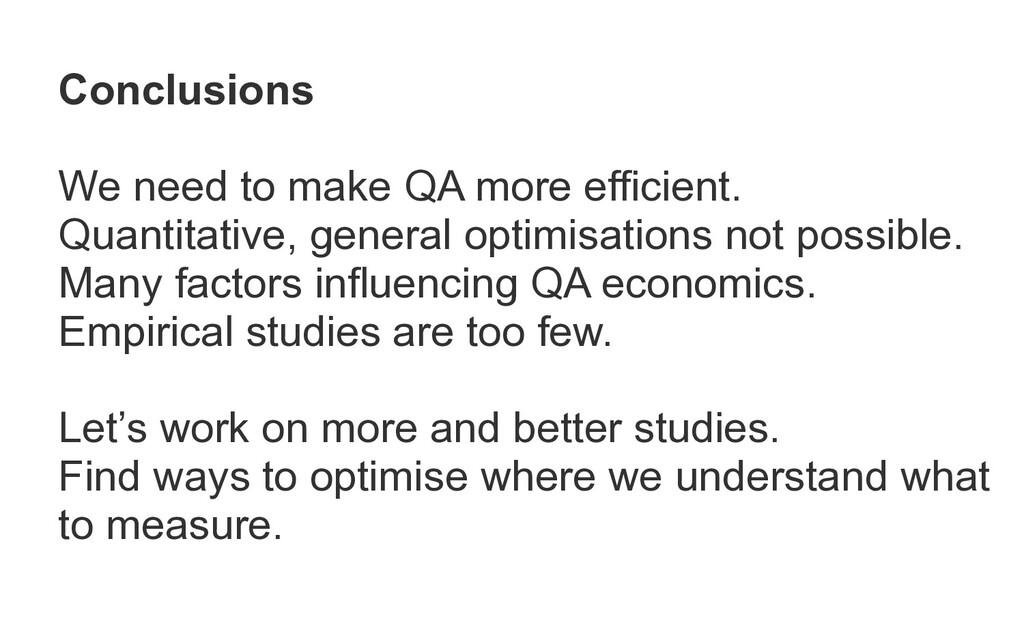
optimisations not possible. Many factors influencing QA economics. Empirical studies are too few. Let’s work on more and better studies. Find ways to optimise where we understand what to measure.
685-88455 WWW www.iste.uni-stuttgart.de/se Twitter prof_wagnerst ORCID 0000-0002-5256-8429 Institute of Software Technology Slides are available at www.stefan-wagner.biz.
![E[d(t)] = u + e(t) + X i (1 (i,](https://files.speakerdeck.com/presentations/2ae2a1c0fd5d41d7b00586cff40f720b/slide_6.jpg)
![Prof. Dr. Stefan Wagner e-mail [email protected] phone +49 (0) 711](https://files.speakerdeck.com/presentations/2ae2a1c0fd5d41d7b00586cff40f720b/slide_23.jpg)