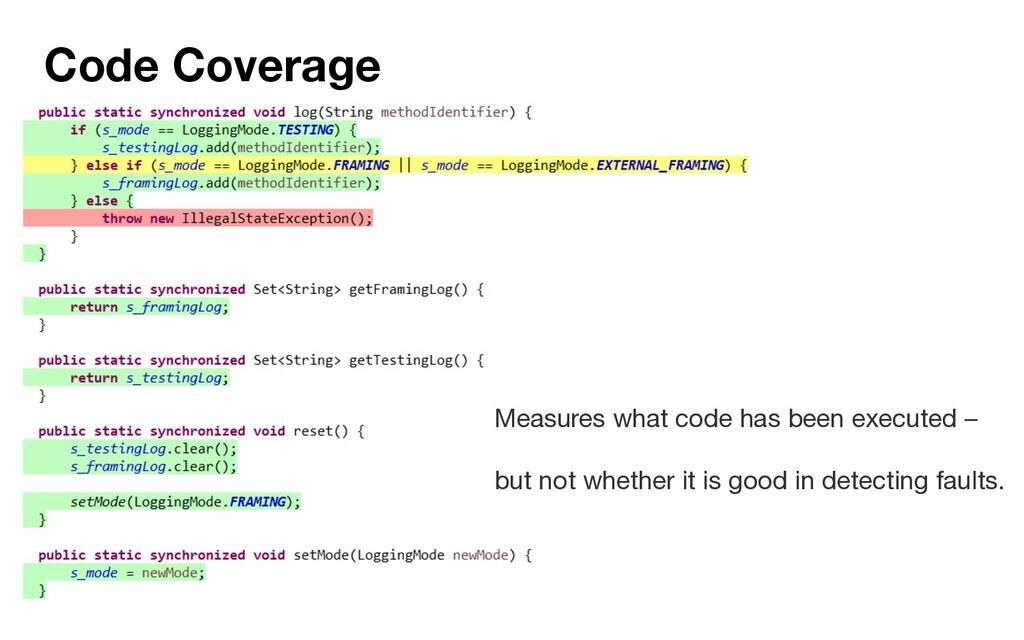
This talk reports on four research contribution we worked on in my group in the last years that relate to improving and evaluating test suites. Two contributions require access to the source code; the two others are black-box methods.
live-blog and tweet this presentation given that you attribute it to its author and respect the rights and licences of its parts. based on slides by @SMEasterbrook und @ethanwhite
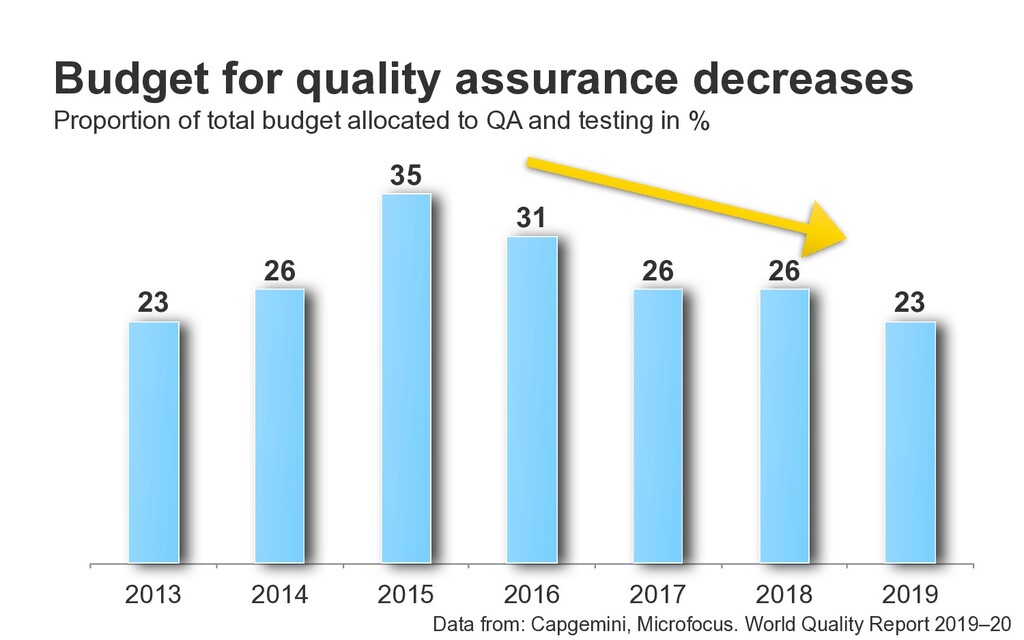
31 35 26 23 Budget for quality assurance decreases Proportion of total budget allocated to QA and testing in % Data from: Capgemini, Microfocus. World Quality Report 2019–20
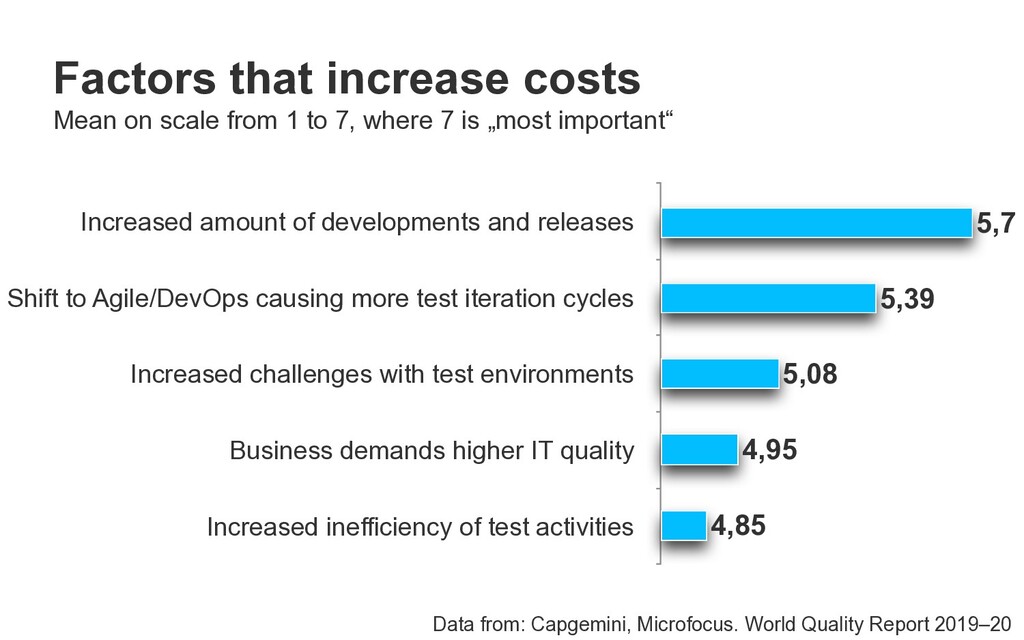
more test iteration cycles Increased challenges with test environments Business demands higher IT quality Increased inefficiency of test activities 4,85 4,95 5,08 5,39 5,7 Factors that increase costs Mean on scale from 1 to 7, where 7 is „most important“ Data from: Capgemini, Microfocus. World Quality Report 2019–20
detecting faults? Test Input 1 Software Under Test Test Input 2 Test Input 3 Test Output 1 Test Output 2 Test Output 3 Test Suite Executing code to detect faults
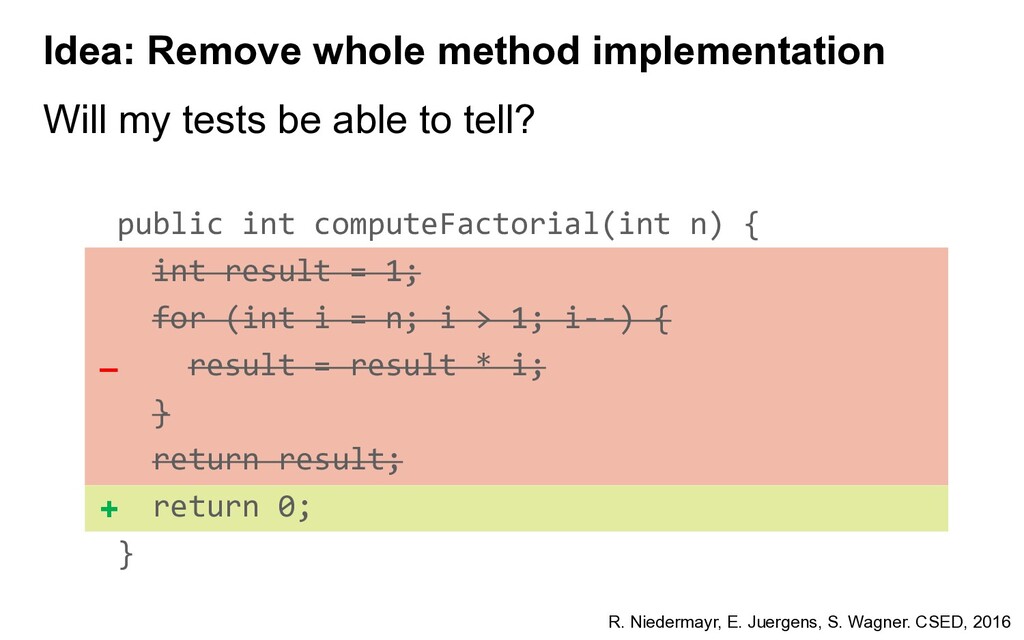
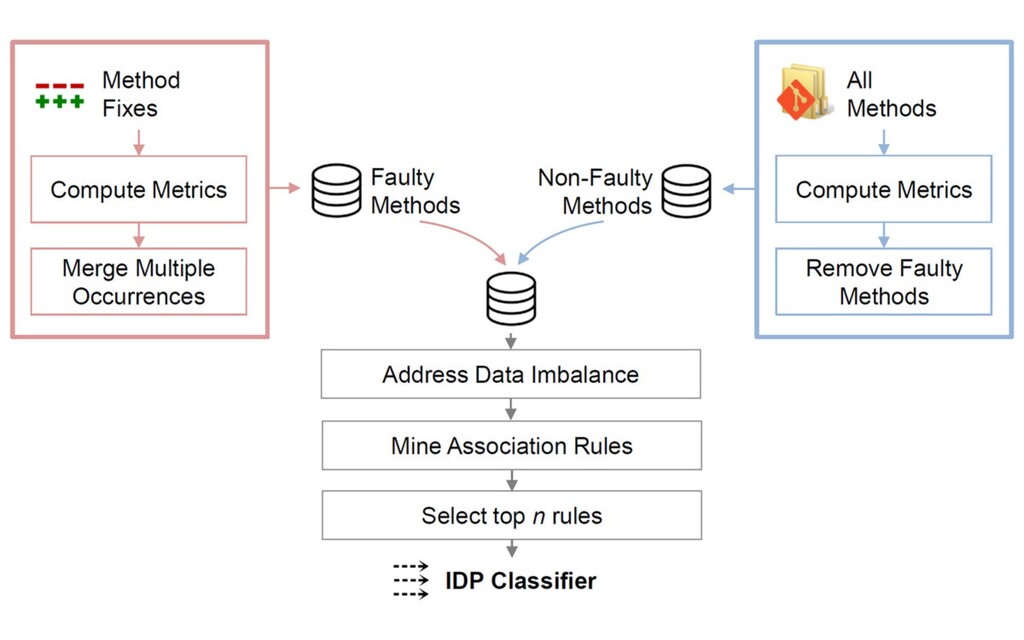
method implementation R. Niedermayr, E. Juergens, S. Wagner. CSED, 2016 + – public int computeFactorial(int n) { int result = 1; for (int i = n; i > 1; i--) { result = result * i; } return result; return 0; }
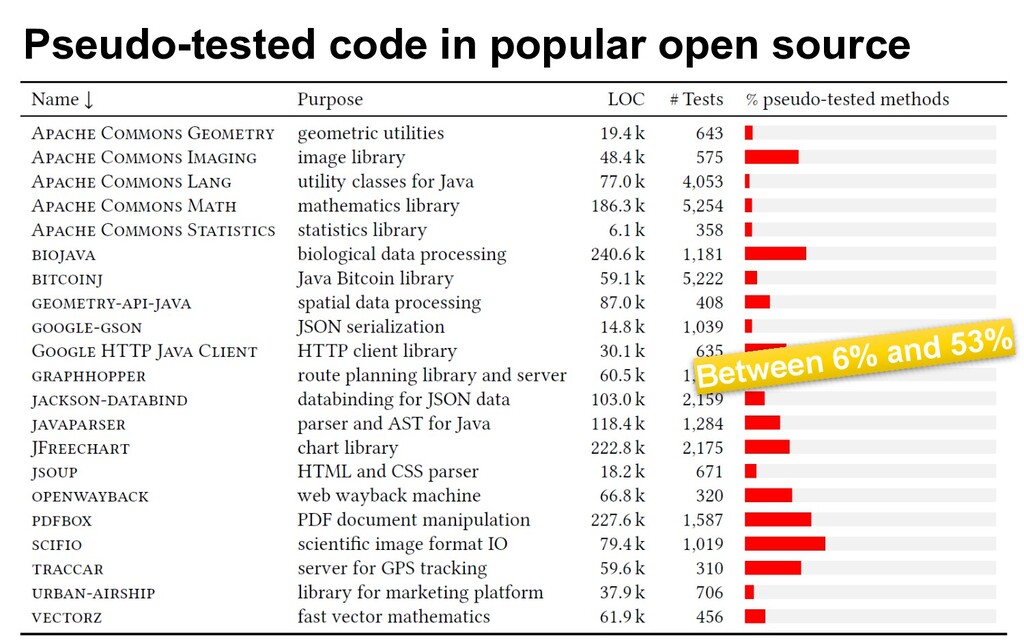
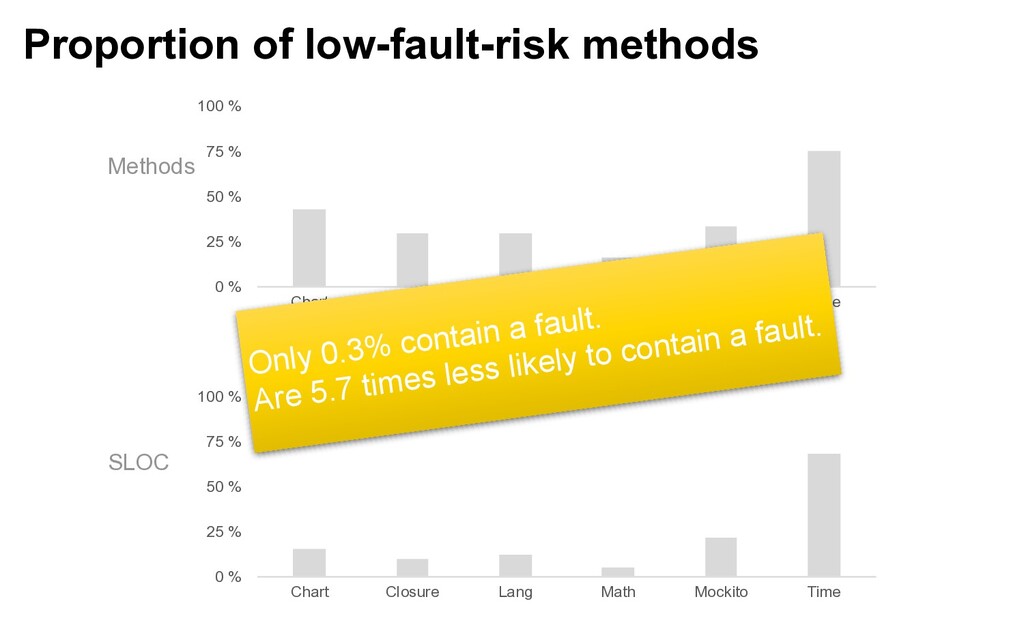
75 % 100 % Chart Closure Lang Math Mockito Time 0 % 25 % 50 % 75 % 100 % Chart Closure Lang Math Mockito Time Methods SLOC Only 0.3% contain a fault. Are 5.7 times less likely to contain a fault.
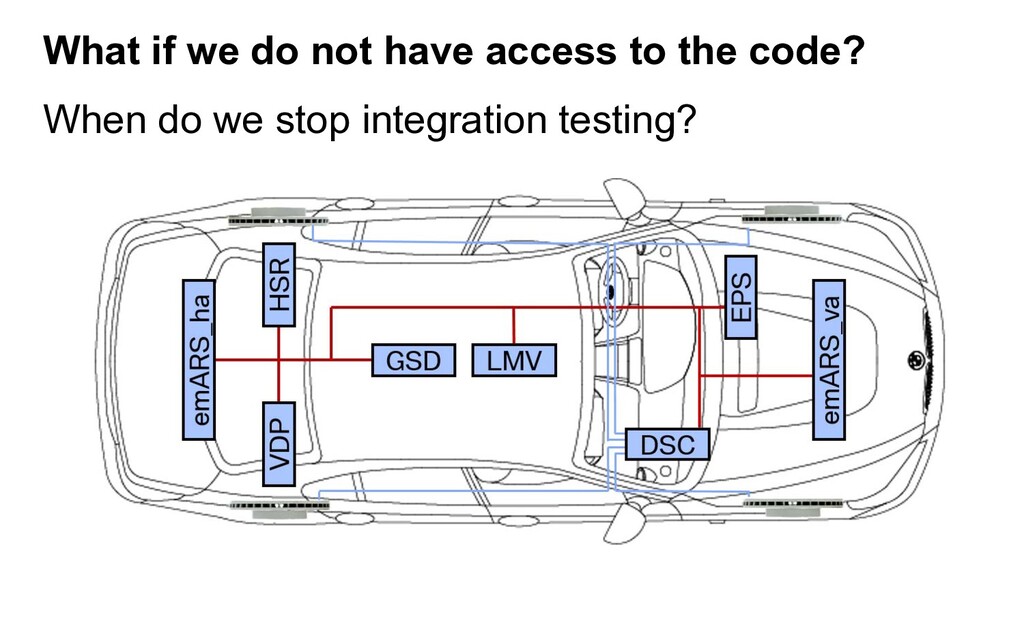
verification-use references represents those shared data on which the failure behavior of the system can be observed. Figure 1. Illustration of ECUs used in Chassis Control Subsystem. What to test in continuous integration? What if we do not have access to the code?
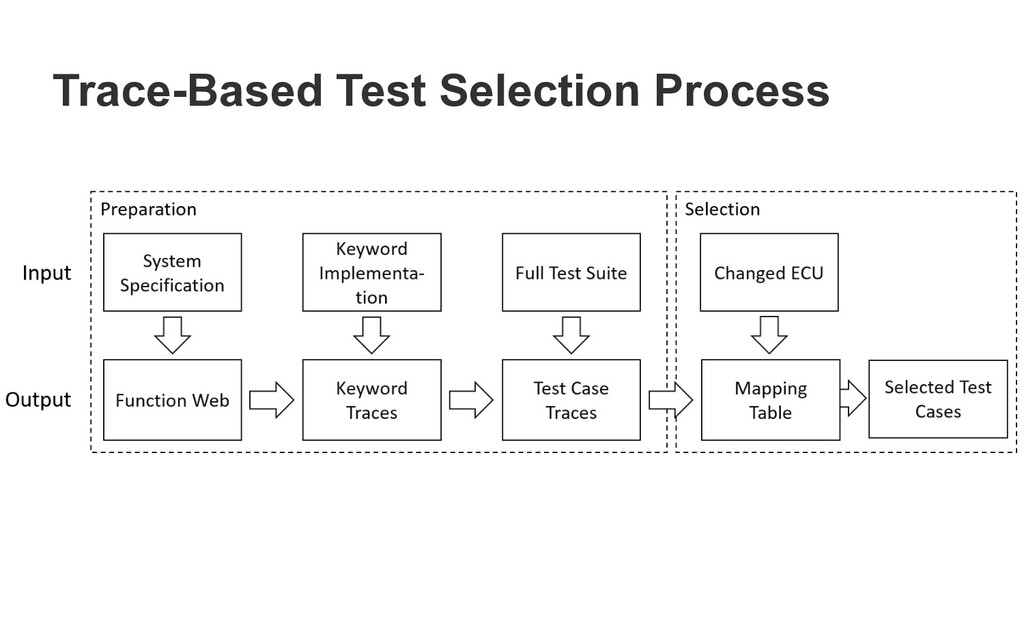
dentify these ECUs by tracing the input signals sent during a test run through the Function Web. The whole process is depicted in Figure 1. We divide it nto two parts: Preparation and Selection. Step 2. We generate the Traces for each Keyword. They are common to the entire test suite and represent a certain user interaction with the system, such as Activate ACC. Each of these Keywords is linked to a concrete imple- mentation, which consists of the signals and the respective
verification-use references represents those shared data on which the failure behavior of the system can be observed. Figure 1. Illustration of ECUs used in Chassis Control Subsystem. When do we stop integration testing? What if we do not have access to the code?
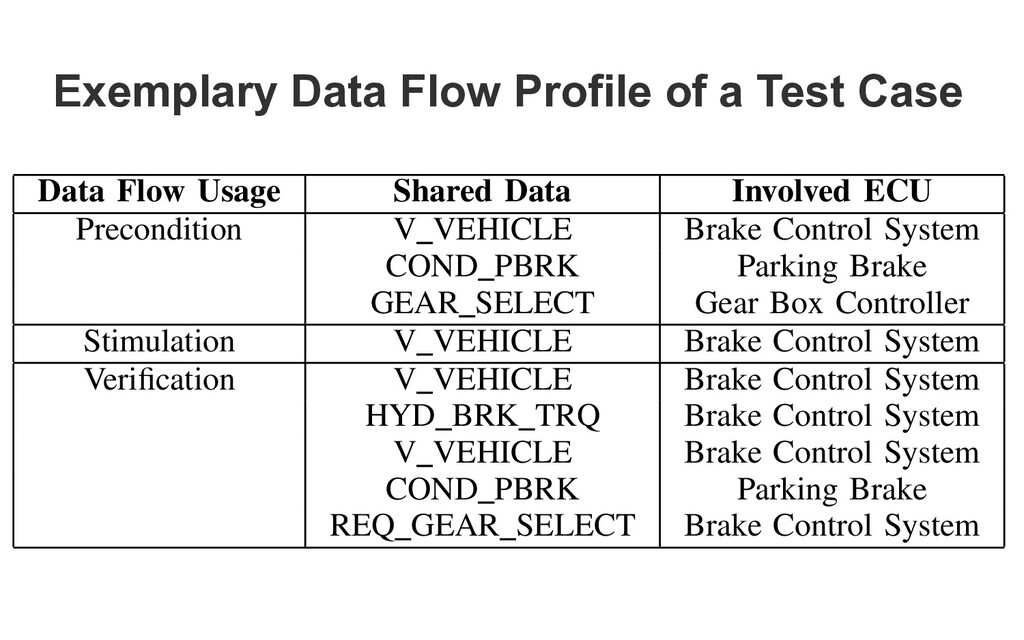
EXEMPLARY DATA-FLOW PROFILE OF A FUNCTIONAL TEST CASE Data Flow Usage Shared Data Involved ECU Precondition V VEHICLE Brake Control System COND PBRK Parking Brake GEAR SELECT Gear Box Controller Stimulation V VEHICLE Brake Control System Verification V VEHICLE Brake Control System HYD BRK TRQ Brake Control System V VEHICLE Brake Control System COND PBRK Parking Brake REQ GEAR SELECT Brake Control System
i cation-Data-Use use occurs if, for a shared data d, at least one test case exists which contains a reference to d for the purpose of behavior veri f i cation. Using this criterion, untested data f l ow can be revealed.
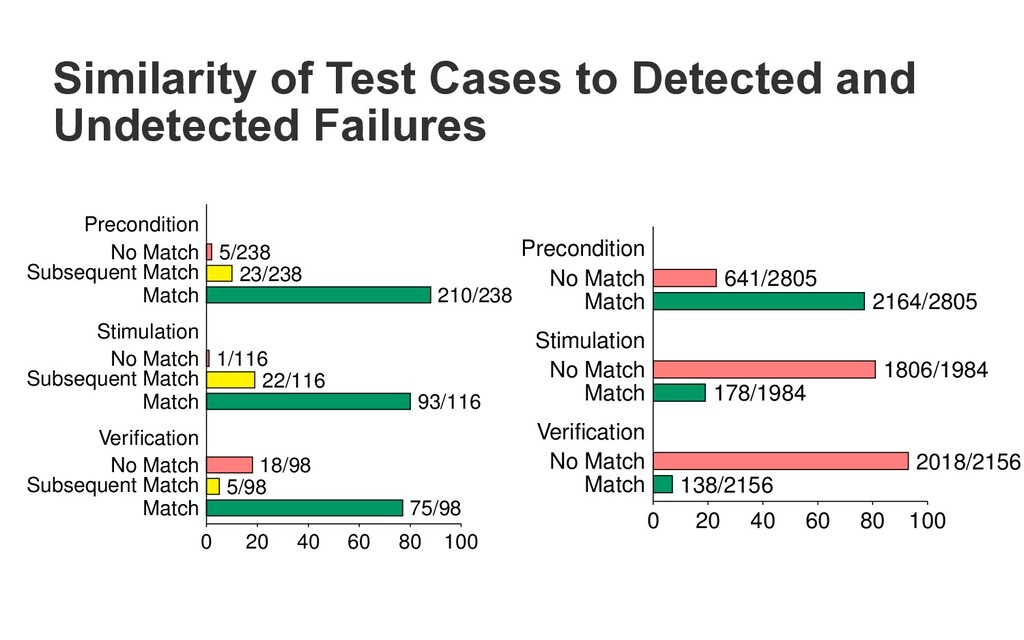
641/2805 No Match 2164/2805 Match Stimulation 1806/1984 No Match 178/1984 Match Verification 2018/2156 No Match 138/2156 Match 0 20 40 60 80 100 Figure 4. Similarity of test-case to undetected failures focusing the u of data flow for verification purpose amount of matching, subsequent matching or non-matching references to shared data are shown in table 2. It can be seen that the highest amount of non-matching data-flow references occur for the verification usage of the data- flow. Further, data flow referenced for the precondition and stimulation usage are subject to subsequent effects. Over all purposes of shared data usage, a relative high amount of matches could be identified. Precondition 5/238 No Match 23/238 Subsequent Match 210/238 Match Stimulation 1/116 No Match 22/116 Subsequent Match 93/116 Match Verification 18/98 No Match 5/98 Subsequent Match 75/98 Match 0 20 40 60 80 100 Figure 2. Similarity of test cases to detected failures
685-88455 WWW www.iste.uni-stuttgart.de/ese Twitter prof_wagnerst ORCID 0000-0002-5256-8429 Institute of Software Engineering Slides are available at www.stefan-wagner.biz.
![Prof. Dr. Stefan Wagner e-mail [email protected] phone +49 (0) 711](https://files.speakerdeck.com/presentations/d5282a0229fe449594ad3eaee26d4bc5/slide_32.jpg)