Upgrade to Pro — share decks privately, control downloads, hide ads and more …

Geoff Gerrietts - Performance by the Numbers: analyzing the performance of web applications

Geoff Gerrietts - Performance by the Numbers: analyzing the performance of web applications

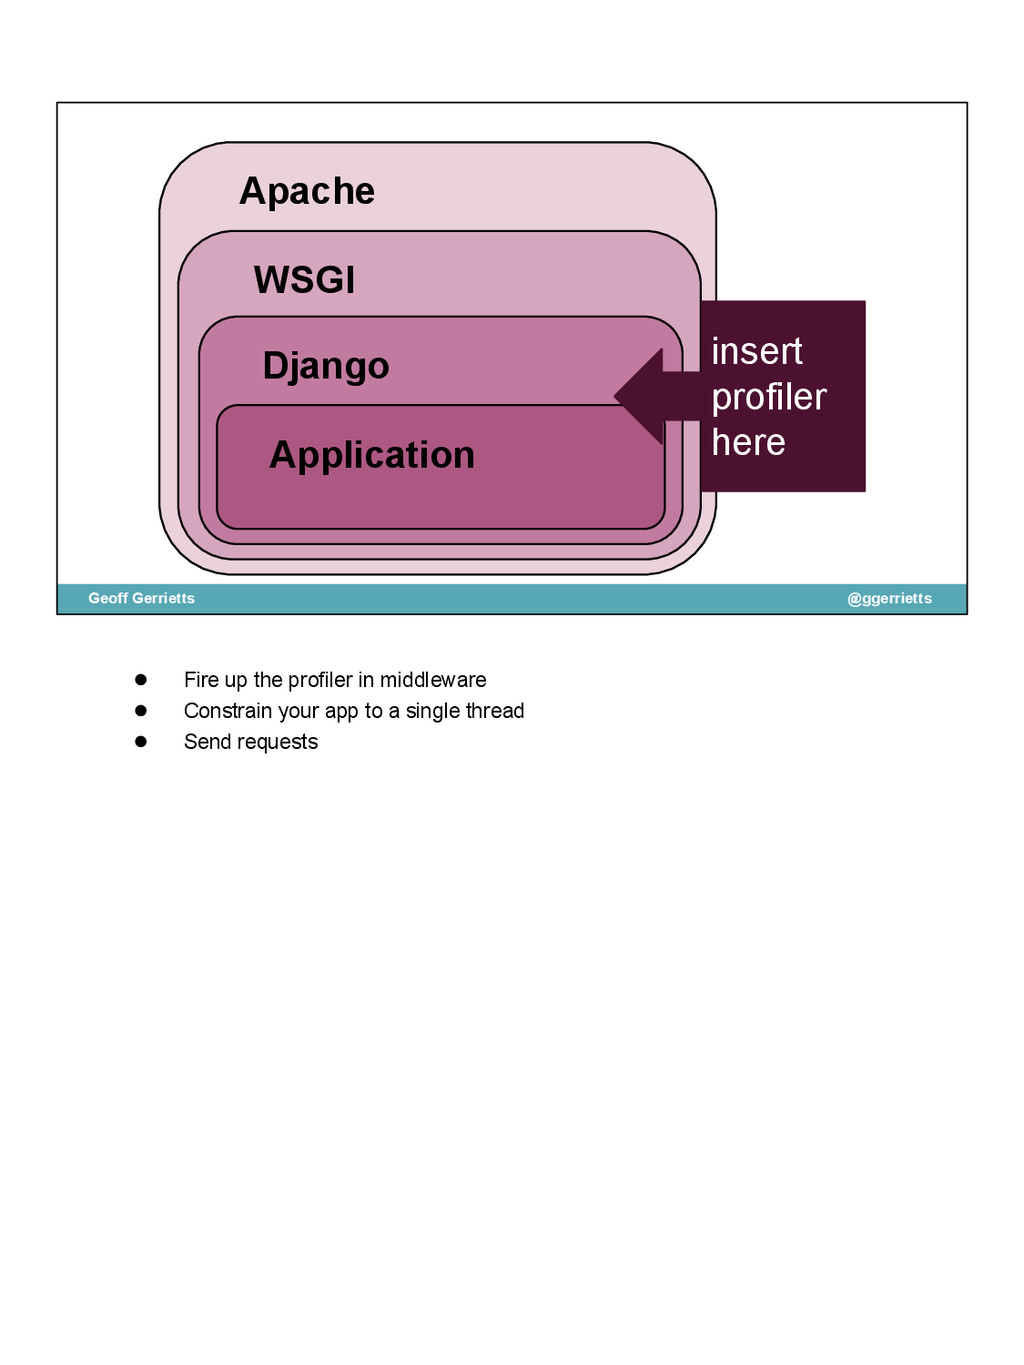
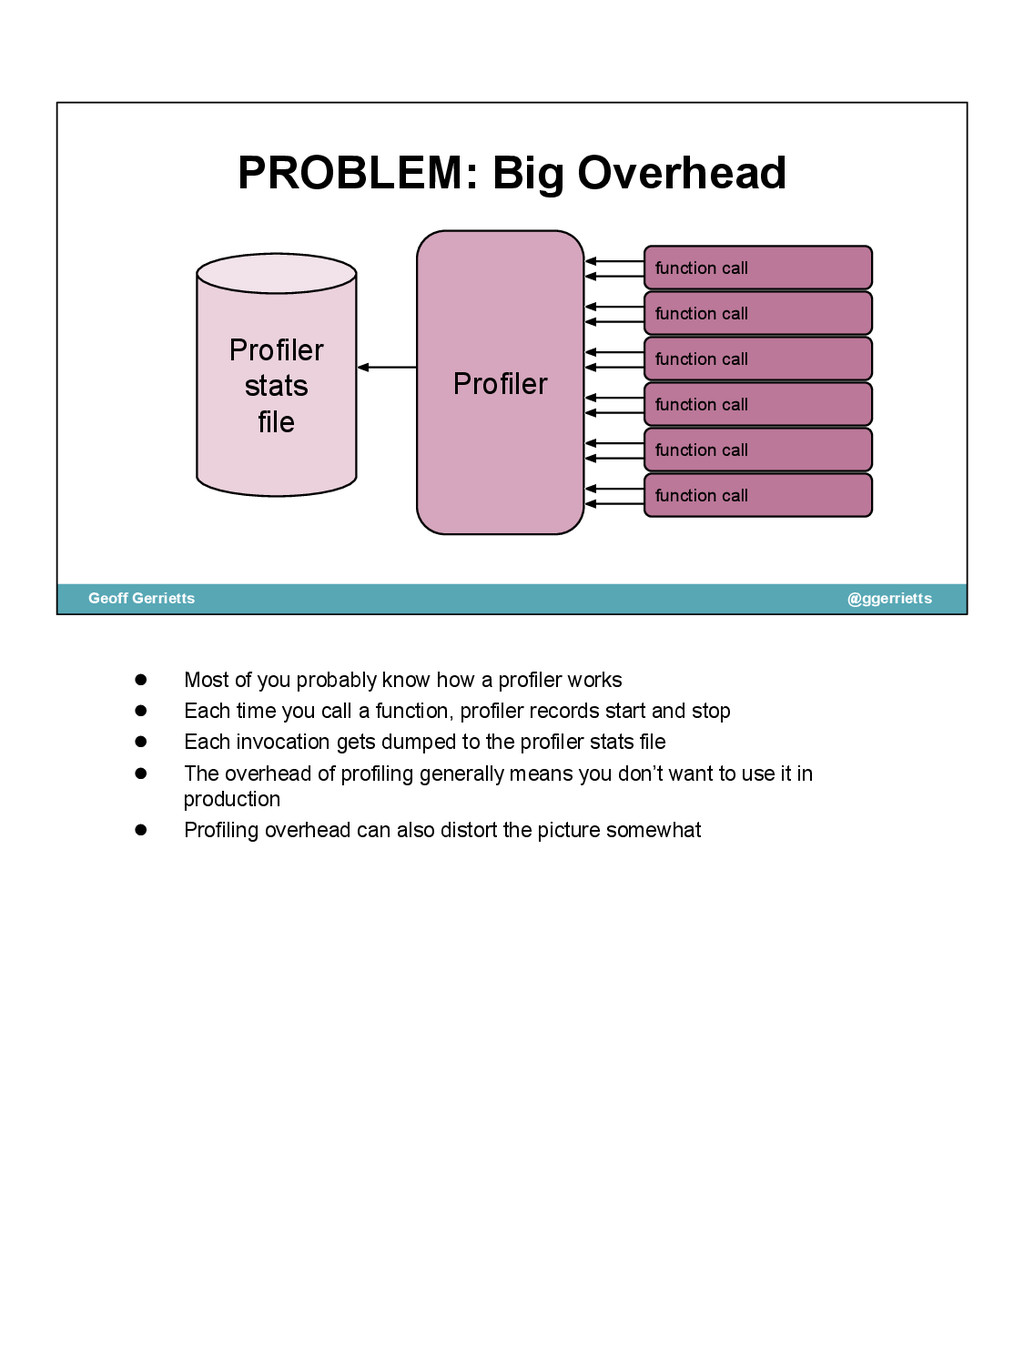
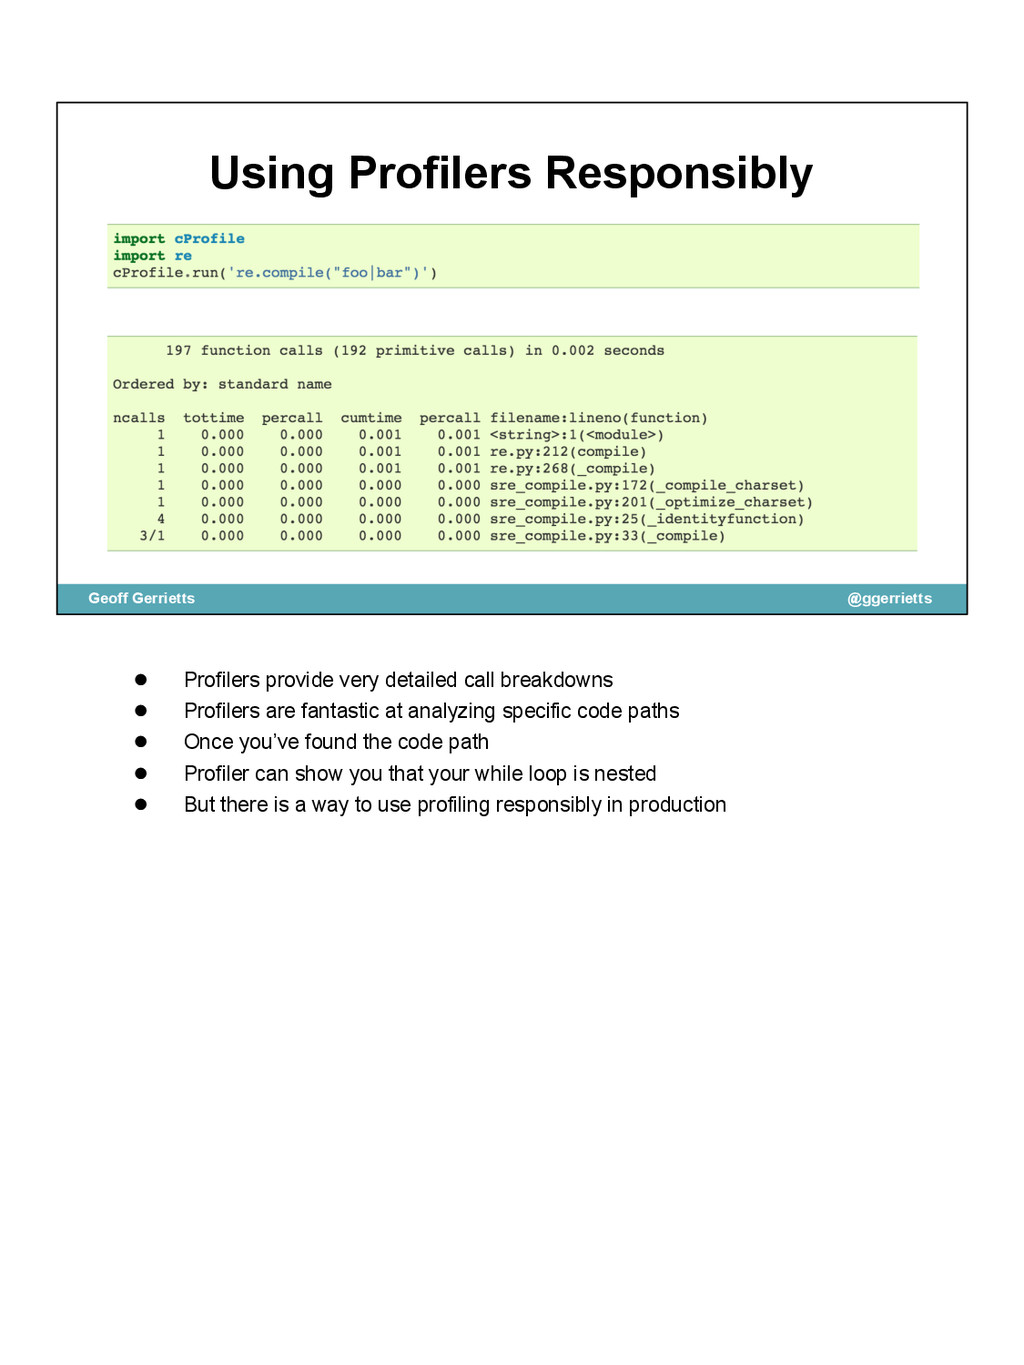
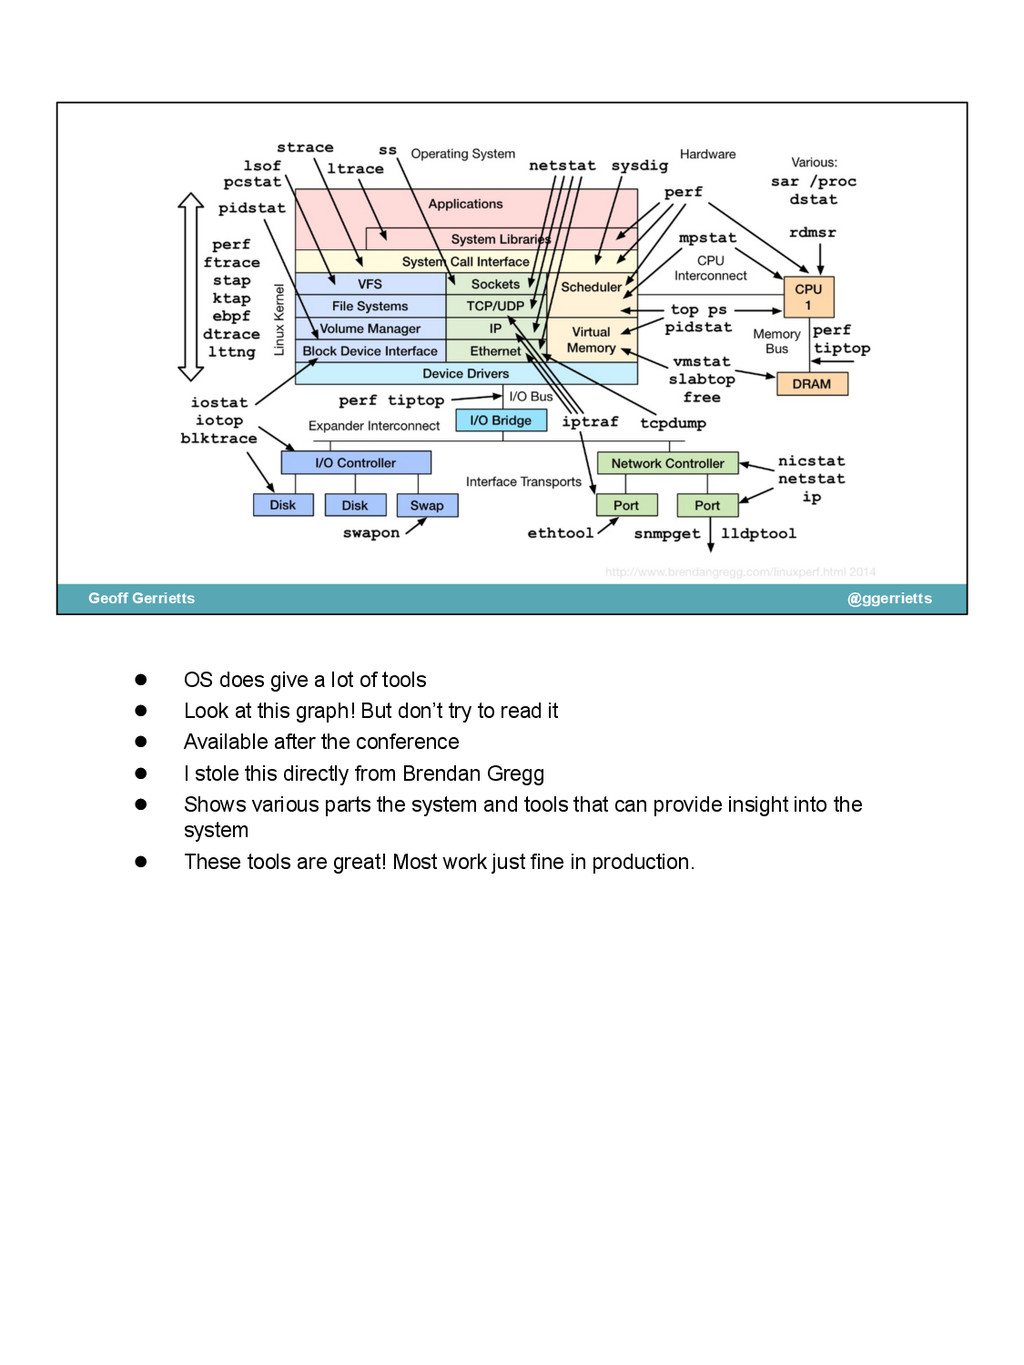
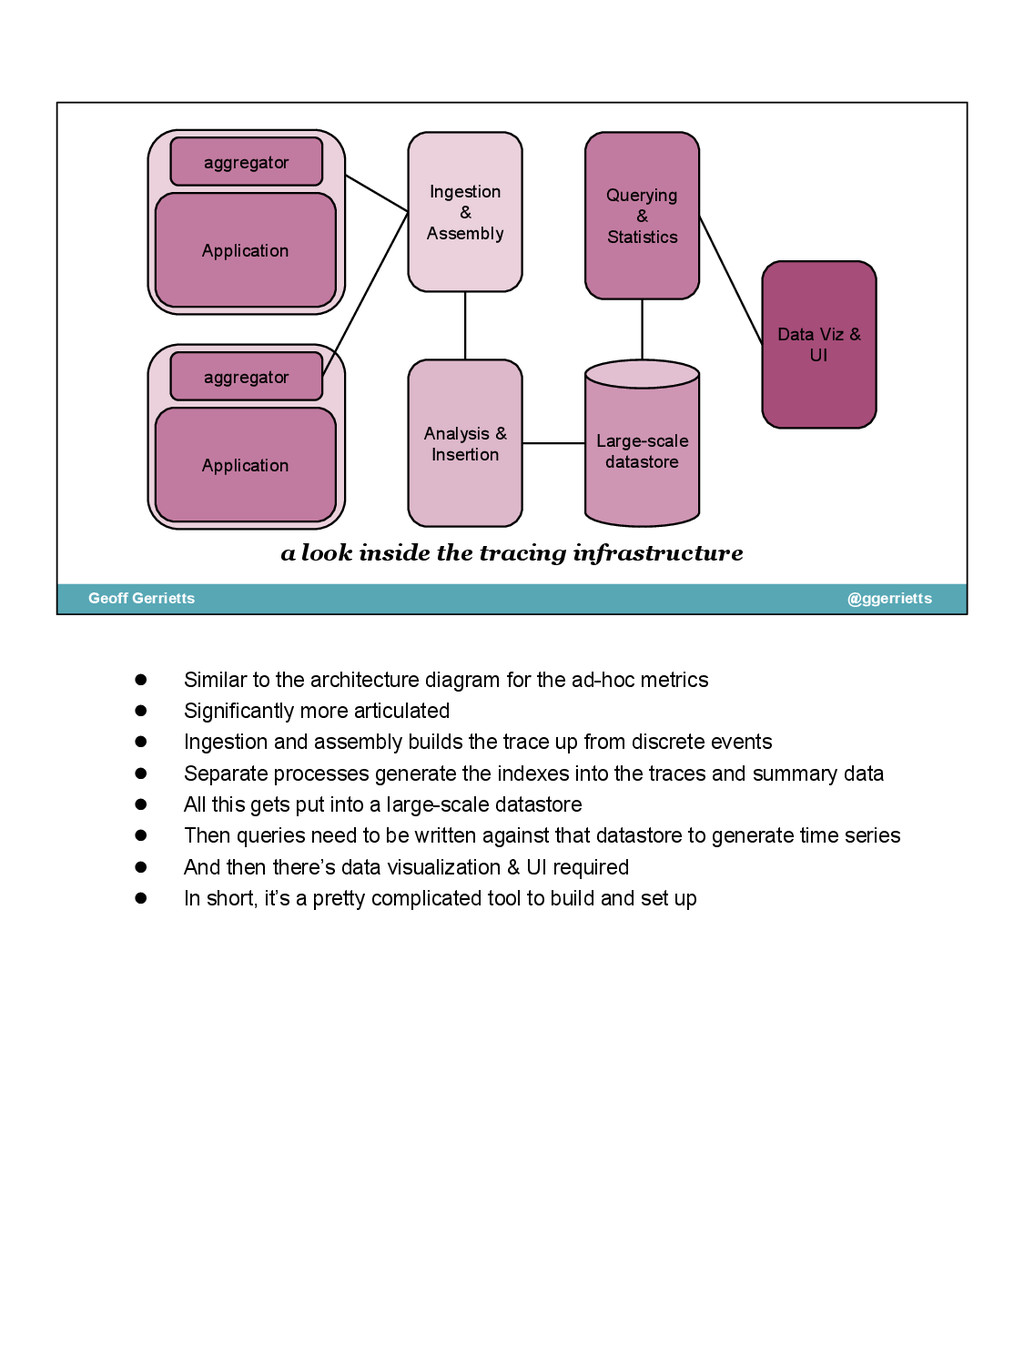
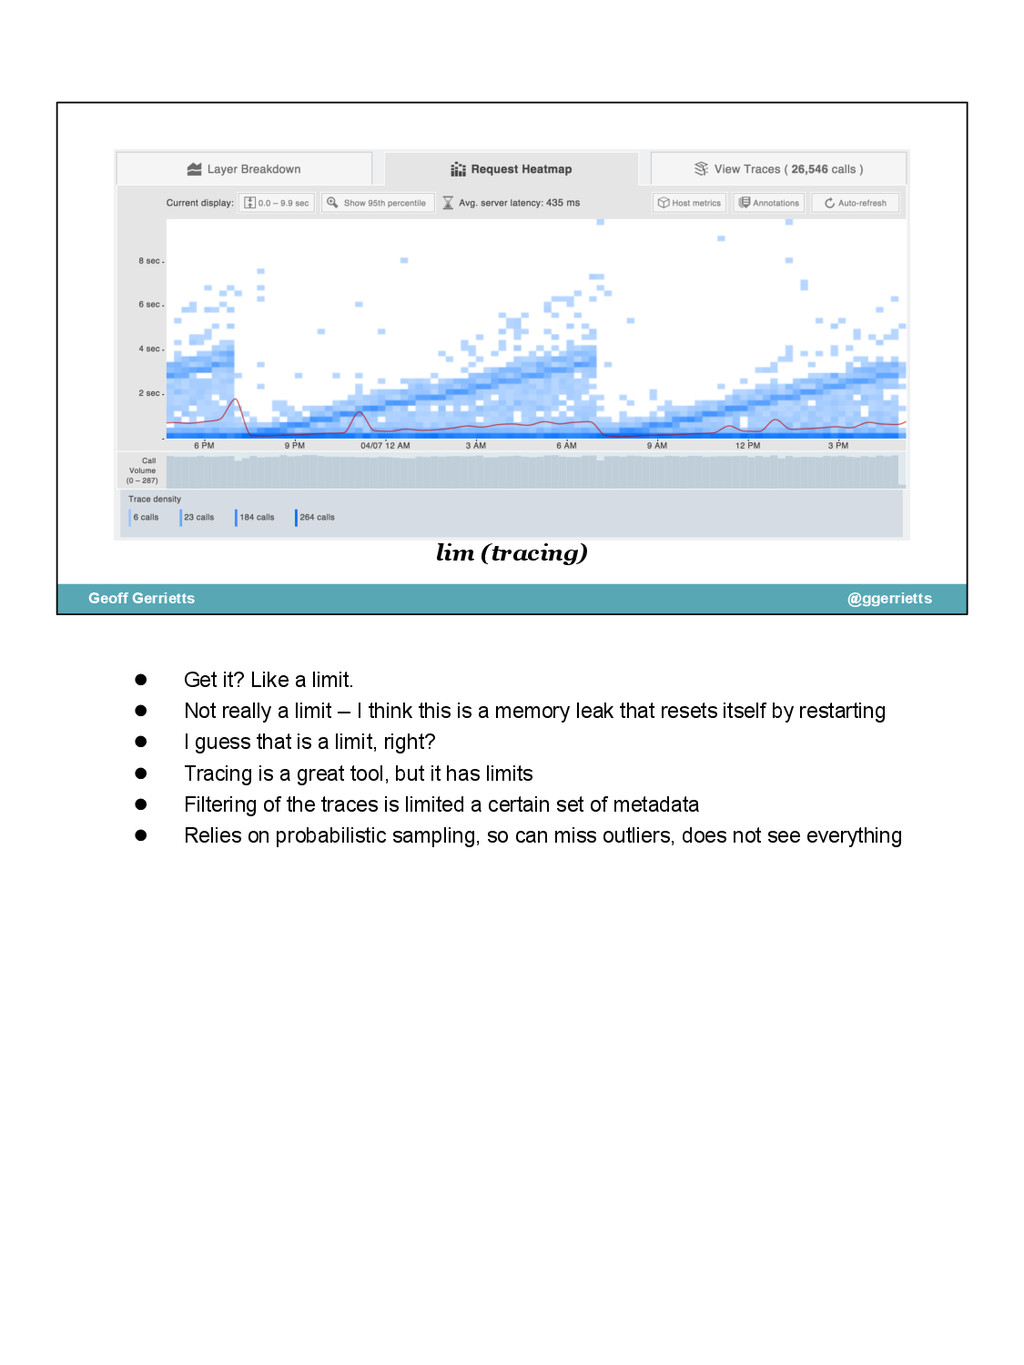
Everyone knows poor performance when they see it, and performance concerns affect every application -- web applications more than most. But finding performance problems can be extraordinarily difficult, and requires an analytical approach coupled with good instrumentation. This talk explores approaches to instrumentation and what that instrumentation can tell you.

https://us.pycon.org/2015/schedule/presentation/349/

wolever-test

April 18, 2015
Tweet

More Decks by wolever-test

Other Decks in Programming

Transcript

  1. Development Manager @AppNeta 15 years of Python Really big nerd

    Geoff Gerrietts @ggerrietts Geoff Gerrietts @ggerrietts • Geoff Gerrietts • Development Manager at AppNeta • Pythonista for 15 years • Team at AppNeta • Boston Python
  2. Performance Matters. But It’s Hard to Do Right. Lots of

    Tools Exist to Help. You Should Use Them All. • Caveat: Server-Side Performance. • User experience has different tools and techniques. • Also very important, but a separate talk.
  3. Performance Matters @ggerrietts Geoff Gerrietts • Performance matters, of course

    • But how much? • Features have obvious value • Software processes call out performance constraints • Product management can’t specify, though • Or understand what can go wrong • Don’t know the value
  4. @ggerrietts Geoff Gerrietts • Big retail has brought focus on

    performance • Amazon and Walmart correlate low latency with increased conversion and revenue • Google, Yahoo, and Mozilla produce similar results
  5. “Premature optimization is the root of all evil.” - Donald

    Knuth • Short-changing performance isn’t just for product managers • Engineers wisely choose readable, maintainable constructs over optimal code • But also you usually only get one chance to do it right
  6. • (Pause!) • But performance does matter • because slow

    websites erode your sanity • and they cost you money
  7. ignoring latency does not make it better • Most common

    mistake: ignoring • Or maybe better, not recognizing performance on bottom line
  8. Passing the Buck @ggerrietts Geoff Gerrietts • Bureaucracy is the

    art of organizing an enterprise such that the buck never lands on your desk. • Most organizations do some • The developer points at the database, the DBA points at the hardware, the sysadmin points at the code. It’s the circle of blame! • I’ve been that guy. • Expecting DBA to fix everything with indexes isn’t realistic • Better queries, better caches • Ask not what your database can do for your app. Ask what your app can do for your database
  9. The Drunken Man @ggerrietts Geoff Gerrietts • Come up with

    a plausible idea to improve performance • Do it • Maybe measure the results if you can figure out how • Brendan Gregg’s “drunken man” (Netflix, Screaming at the hard drives) • Even when it works, it might not be addressing the most important thing • Two months building a build pipeline to consolidate and uglify JS & CSS. Theory: too many downloads slows page load. No measurable improvement. • If you design a project before you know which parts of the app need attention, you are the drunken man • Put down the bottle … flask … pyramid and step away from the backlog!
  10. @ggerrietts Geoff Gerrietts The Hammer • So passing the buck

    is bad, shooting in the dark is bad • Looking for some insight is a good first step, but • When the only tool you have is a hammer…. • This problem occurs when you lean too heavily on one or two tools, and can’t see into their blind spots • Sysadmin with Oracle writing tables to network attached storage using NFS. • According to top and ifconfig, this setup was performing just fine. • Performance on the website was visibly impacted • Overall query latency was up
  11. Root Cause Analysis • Common flaw: stop short of discovering

    root cause • Just like fixing bugs, if you don’t find root cause, you don’t understand the problem • If you don’t know where the latency arises, you can’t meaningfully address it
  12. Hard Numbers: Profilers @ggerrietts Geoff Gerrietts • Measuring latency, profilers

    come up quick • Very powerful, go-to tool for performance analysis for decades • Careful, because profiler can become a hammer • Profiler best used to analyze a specific code path
  13. Apache WSGI Django Application insert profiler here @ggerrietts Geoff Gerrietts

    • Fire up the profiler in middleware • Constrain your app to a single thread • Send requests
  14. PROBLEM: Big Overhead function call function call function call function

    call function call function call Profiler Profiler stats file @ggerrietts Geoff Gerrietts • Most of you probably know how a profiler works • Each time you call a function, profiler records start and stop • Each invocation gets dumped to the profiler stats file • The overhead of profiling generally means you don’t want to use it in production • Profiling overhead can also distort the picture somewhat
  15. Storytime! @ggerrietts Geoff Gerrietts • According to customers, Django app

    was slow • One route of investigation was to use profiling • Couldn’t profile in production • Used Apache logs to simulate traffic distribution • GET and query, but no cookies, no POST data • Could not determine why same URL could sometimes take 500ms and sometimes 3s • Ended up testing only the assumptions
  16. Using Profilers Responsibly @ggerrietts Geoff Gerrietts • Profilers provide very

    detailed call breakdowns • Profilers are fantastic at analyzing specific code paths • Once you’ve found the code path • Profiler can show you that your while loop is nested • But there is a way to use profiling responsibly in production
  17. @ggerrietts Geoff Gerrietts Statistical Profiling • Uses periodic random sampling

    to build a profile • Is inexact, but statistically accurate
  18. ELB App 1 MySQL memcache App 2 App 3 @ggerrietts

    Geoff Gerrietts • This is a fairly common architecture, right? • Load balancer • Some app nodes • Playing cat’s cradle • A database • A cache server
  19. ELB App 1 MySQL memcache App 2 App 3 @ggerrietts

    Geoff Gerrietts • Sample all the things • Provides big picture • Lacks context
  20. Operating System Tooling • Maybe your mind doesn’t go to

    profilers • Maybe top. Or strace. • Maybe you’re secretly a system administrator.
  21. @ggerrietts Geoff Gerrietts • OS does give a lot of

    tools • Look at this graph! But don’t try to read it • Available after the conference • I stole this directly from Brendan Gregg • Shows various parts the system and tools that can provide insight into the system • These tools are great! Most work just fine in production.
  22. ELB App 1 MySQL memcache App 2 App 3 @ggerrietts

    Geoff Gerrietts • So there’s some limitations to OS tools • Remember this architecture?
  23. @ggerrietts Geoff Gerrietts • Every one of those nodes has

    its own set of tools • The tools only very rarely know anything about the rest of the app • These tools are also really hard to trace back to code • Don’t really have a concept of requests
  24. Observing Resource Depletion @ggerrietts Geoff Gerrietts • OS tools are

    particularly good at identifying resource depletion • Scaling often run into resource depletion • Also good at diagnosing host or OS failure • Host or OS failure often presents as acute performance problems
  25. let’s look closer! @ggerrietts Geoff Gerrietts • Real insight into

    the code requires instrumentation • Instrumenting means inserting code to track the application’s behavior
  26. Zope 1 Zope 2 Zope n DB Service 1 Service

    2 Service n Stats Service @ggerrietts Geoff Gerrietts baby’s first monitoring project • This is where my career in performance really started: ad hoc instrumentation • I was working in a CORBA-based SOA. • I wanted to understand where all our latency was coming from. • I wrote a stats service that would record call timings and report mean latency and mean deviation on a per-endpoint basis. • It didn’t produce great insight, for reasons I’ll get to
  27. an asynchronous fanout aggregator Collector 1 Collector 2 Collector 3

    Flask App Web Node 2 Web Node 1 Web Node 3 @ggerrietts Geoff Gerrietts • More recent example • Collectors are high-throughput nodes responsible for receiving all inbound data • Collectors expose connection status • In response to requests from web app • Flask app aggregates, does some processing • This is ok for specialized cases, but there’s a better way
  28. Etsy’s statsd tool Application statsd Application statsd Graphite @ggerrietts Geoff

    Gerrietts • Etsy has done a huge good turn to the community with statsd • statsd is a small server that runs on your production nodes • your application can shovel labeled metrics -- counters and timings -- into it • statsd will upload those metrics into a Graphite instance • Graphite is a general-purpose graphing package for time series data • It will let you trend your metrics over time
  29. instrumenting for statsd @ggerrietts Geoff Gerrietts • This is a

    sample from Python’s statsd package. • Above is a timer. • You can use timers in a lot of ways -- decorators, direct calls, start-stop • Below is a counter. • Can also increment the counter by a number.
  30. a perfectly hideous, fact-filled graph from graphite @ggerrietts Geoff Gerrietts

    • Graphite isn’t the prettiest product in the world, but it does a great job plotting your data • This is a graphite graph we use at AppNeta • This is from our integration environment • Number of connections on one of our MySQL servers
  31. Ad-hoc instrumentation works great for tracking and trending discrete events.

    • If there’s a specific event that you’re interested in, like our traces per second number, or maybe mean time to process a login, or even just number of logins, ad hoc metrics are the best way to keep an eye on it. • This approach to stats can be labor-intensive: every point of instrumentation is hand-tooled. • Can also be exhausting to interpret: lots of discrete metrics can be hard to mentally assimilate, increasing risk that you overlook a key indicator. • Like many of the other tools we have looked at, looks at metrics without much context.
  32. The Rise of Tracing • There’s a theme that’s been

    developing • Hard to see performance in context of the request • This is where tracing techniques come in
  33. a trace in Twitter’s Zipkin @ggerrietts Geoff Gerrietts • Tracing

    products are based around the idea of a trace, • Represents the path of execution followed in the fulfillment of a single request. • Example from Zipkin shows a 113ms trace that makes use of memcache, some data services, and a few other peculiarly-named services. • Can see the trace begin, flow through many layers, and ultimately return to user • Each layer has specific latency values associated
  34. trended traces in AppNeta’s TraceView @ggerrietts Geoff Gerrietts • Traces

    can be aggregated into trended visualizations • This viz presents the average latency for all traces, at each layer • The underlying traces can be filtered to hone in on interesting events
  35. Finally, a good place to start @ggerrietts Geoff Gerrietts •

    Trace tools offer a great way to see the overall latency • Individual traces provide a good window into which code paths have unacceptable latency • Why wait until the end to talk about it then?
  36. a look inside the tracing infrastructure Application aggregator Application aggregator

    Ingestion & Assembly Analysis & Insertion Large-scale datastore Querying & Statistics Data Viz & UI @ggerrietts Geoff Gerrietts • Similar to the architecture diagram for the ad-hoc metrics • Significantly more articulated • Ingestion and assembly builds the trace up from discrete events • Separate processes generate the indexes into the traces and summary data • All this gets put into a large-scale datastore • Then queries need to be written against that datastore to generate time series • And then there’s data visualization & UI required • In short, it’s a pretty complicated tool to build and set up
  37. Google’s Dapper paper http://research.google.com/pubs/pub36356.html Yammer’s Telemetry https://github.com/yammer/telemetry Twitter’s Zipkin https://github.com/twitter/zipkin

    Free Tracing Technology @ggerrietts Geoff Gerrietts • It’s complicated, but worthwhile • Google’s Dapper paper presents one jumping-off point for implementation • Twitter made their Zipkin tool available too ◦ Kind of hard to stand up ◦ Lacks Python support, but would be a good project
  38. several pre-eminent tracing vendors @ggerrietts Geoff Gerrietts • Several SaaS

    vendors provide tracing tools • I put AppNeta on top because go team • Much simpler drop-in solutions that manage the data pipeline for you
  39. @ggerrietts Geoff Gerrietts One-Stop Instrumentation • Traces can be aggregated

    into trended visualizations • This viz presents the average latency for all traces, at each layer • The underlying traces can be filtered to hone in on interesting events
  40. lim (tracing) @ggerrietts Geoff Gerrietts • Get it? Like a

    limit. • Not really a limit -- I think this is a memory leak that resets itself by restarting • I guess that is a limit, right? • Tracing is a great tool, but it has limits • Filtering of the traces is limited a certain set of metadata • Relies on probabilistic sampling, so can miss outliers, does not see everything
  41. @ggerrietts Geoff Gerrietts • So we’ve looked at a bunch

    of tools for performance management • All of them have strengths, and all have limits • Any of them could be a hammer • Instead, think about them as a toolbox ◦ Start an investigation in a tracing tool to give you high-level insight ◦ Maybe you’re getting a few strange outliers -- check your hosts with OS tools! ◦ Maybe you filter the traces down until you find some slow, high-traffic code paths, then switch over to a profiler ◦ Track key events, and durations. Graph trended values for insight into the why. • No one tool has it all
  42. References and Resources AppNeta’s blog: www.appneta.com/blog Brendan Gregg’s blog: www.brendangregg.com

    Google’s Dapper paper: research.google.com/pubs/pub36356.html Papers We Love presentation: youtu.be/ya9X63VPgV8 Yammer’s Telemetry: github.com/yammer/telemetry Twitter’s Zipkin: github.com/twitter/zipkin Value of Performance: munchweb.com/effect-of-website-speed These Slides: goo.gl/JiptSI @ggerrietts Geoff Gerrietts