Upgrade to Pro — share decks privately, control downloads, hide ads and more …

Otto Kekäläinen - Improving WordPress performance with XDebug and PHP profiling

Otto Kekäläinen - Improving WordPress performance with XDebug and PHP profiling

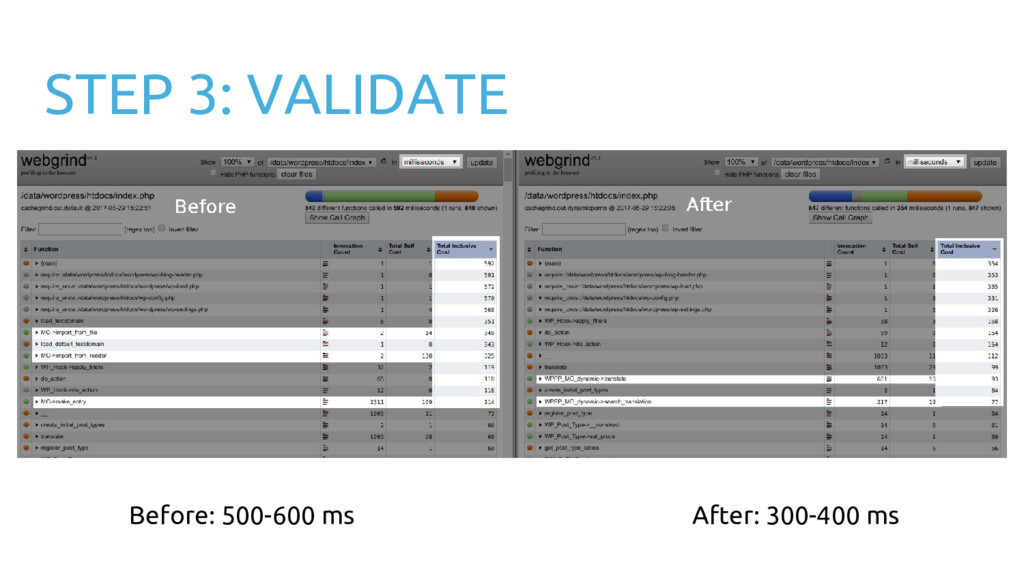
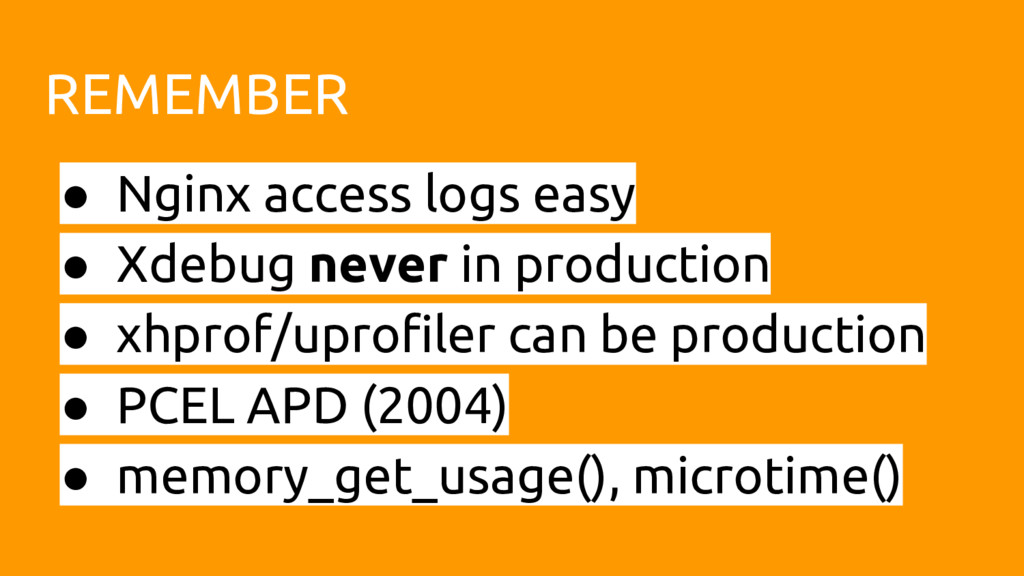
XDebug is a tool for developers to gain insight into how PHP is executed. Using it for profiling is a very effective, fast and precise method to find bottlenecks in your WordPress site. In this talk I explain how to use it with Webgrind, how to find potential optimization targets, show examples of real cases when XDebug helped fix a performance problem and also explain what XDebug is not suitable for and what can be used instead. If you are not a developer, you’ll learn what XDebug is capable of and when to ask a developer to use it.
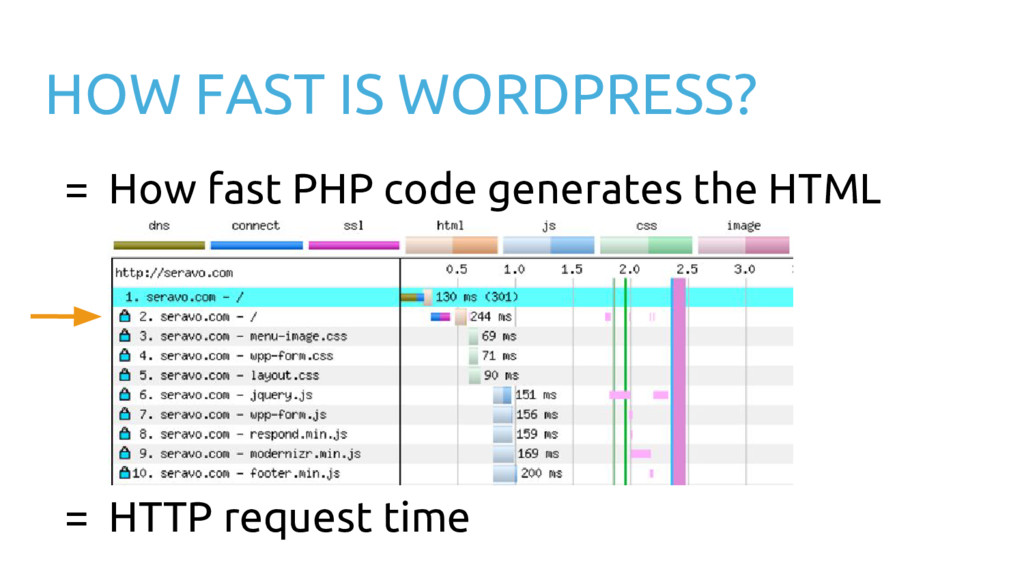
WordPress Greek Community

December 09, 2017
Tweet

More Decks by WordPress Greek Community

Other Decks in Technology

Transcript

  1. • Linux and open source advocate • Contributed to WordPress

    Core, translations, Linux, Docker, Nginx, Redis, MariaDB… • CEO, sysadmin and developer at Seravo.com – WordPress hosting and upkeep Otto Kekäläinen
  2. A WEB FULL OF WRONG ADVICE Most of the guides

    and tutorials on security and speed lack evidence.
  3. STEP 1: Measure Find out your baseline to make sure

    your optimizations later at least do not worsen the performance!
  4. FULL PAGE LOAD • Online tools ◦ WebPageTest.org ◦ GTMetrix.com

    ◦ Pingdom Tools ◦ Yellow Lab Tools ◦ Pagelocity ◦ KeyCDN Performance Test ◦ … • Visualize: ◦ HTML load time ◦ CSS rendering ◦ JavaScript loading ◦ image files download ◦ …
  5. CURL ssh example.com curl -s -o /dev/null \ -w "%{time_total}\n"

    https://example.com/ 0,235 https://curl.haxx.se/docs/manpage.html#-w
  6. CURL WITH NO CACHE curl -s -o /dev/null \ -w

    "%{time_total}\n" \ -H "Pragma: no-cache" https://example.com/ https://developers.google.com/web/fundamentals/performance/opti mizing-content-efficiency/http-caching
  7. CURL LOOP TO DETECT VARIATION export LC_NUMERIC=C for i in

    {1..20} do curl -so /dev/null -w "%{time_total}\n" http://localhost/ done | awk '{ sum += $1; n++; print $1 } END { if (n > 0) print "AVG: " sum / n; }' 0.209 0.107 0.152 AVG: 0.1378
  8. LOG HTTP REQUEST TIME [29/May/2017:10:02:45 +0300] "POST /wp-admin/admin-ajax.php HTTP/1.1" 200

    58 "Mozilla/5.0 (KHTML, like Gecko) Chrome/58.0.3029.110 Safari/537.36" - - 0.028 nginx.conf log_format extensive '$host ' '$remote_addr - $remote_user [$time_local] ' '"$request" $status $body_bytes_sent ' '"$http_referer" "$http_user_agent" ' '$upstream_cache_status - ' '$request_time';
  9. QUICK AND DIRTY: WP-CLI LOOP for p in $(wp plugin

    list --fields=name --status=active) do echo $p wp plugin deactivate $p for i in {1..5} do curl -so /dev/null -w "%{time_total}\n" \ -H "Pragma: no-cache" http://localhost/ done wp plugin activate $p done
  10. QUICK AND DIRTY: WP-CLI LOOP • Baseline ~550 ms •

    Deactivating wp-to-twitter or polylang does not have an effect • When deactivating advanced-custom-fields -pro load times drop to ~65 ms
  11. THE PROFESSIONAL WAY: XDEBUG A tool for developers to •

    analyze PHP execution • find bottle necks • xdebug.org
  12. XDEBUG INSTALLATION $ sudo apt-get install php-xdebug $ nano /etc/php/fpm/conf.d/20-xdebug.ini

    ; Enable Xdebug zend_extension=xdebug.so ; Enable php profiling with get param XDEBUG_PROFILE=1 xdebug.profiler_output_dir=/tmp xdebug.profiler_output_name=cachegrind.out.%t.%p xdebug.profiler_enable_trigger=1 $ sudo service restart php-fpm
  13. PROFILING RUN OF WORDPRESS FRONT PAGE /tmp $ curl -I

    http://localhost/?XDEBUG_PROFILE=1 \ -w "%{time_total}\n" 0.611 /tmp $ ll -h 11M cachegrind.out.1455198789.5601 /tmp $ head cachegrind.out.1455198789.5601 version: 1 creator: xdebug 2.2.3 cmd: /data/wordpress/htdocs/index.php part: 1 positions: line ...
  14. PREINSTALLED IN VVV AND SERAVO VAGRANT laptop$ vagrant ssh vagrant$

    xdebug_on # Varying Vagrant Vagrants vagrant$ wp-xdebug-on # Seravo Vagrant
  15. DEVELOPERS: PLEASE LEARN TO USE THE WP TRANSIENT API! Most

    DB queries and external PHP::curl request can be cached easily:
  16. $ for i in {1..99}; do curl -IL -H "Pragma:

    no-cache" -w "%{time_total}\n" -o /dev/null -s "http://localhost/?XDEBUG_PROFILE=1"; done $ ll -Sh /tmp -rw-r--r-- 111M cachegrind.out.1455200976.5601 -rw-r--r-- 91M cachegrind.out.1455200984.5601 -rw-r--r-- 89M cachegrind.out.1455200972.5604 -rw-r--r-- 89M cachegrind.out.1455200964.5604 -rw-r--r-- 88M cachegrind.out.1455200973.5604 -rw-r--r-- 87M cachegrind.out.1455200963.5601 -rw-r--r-- 87M cachegrind.out.1455200967.5601
  17. STEP 2: OPTIMIZE Translation functions slowest. WP does not use

    native gettext (https://core.trac.wordpress.org/ticket/17268). Solution: composer require aucor/dynamic-mo-loader
  18. REMEMBER • Nginx access logs easy • Xdebug never in

    production • xhprof/uprofiler can be production • PCEL APD (2004) • memory_get_usage(), microtime()