Upgrade to Pro — share decks privately, control downloads, hide ads and more …

DeSoto People and the Market 2.pdf

Avatar for ya1990 ya1990
May 14, 2012
43

DeSoto People and the Market 2.pdf

Avatar for ya1990

ya1990

May 14, 2012
Tweet

Transcript

  1. Total Population US, MS and DeSoto Description 1980 Census 1990

    Census 2000 Census 2010 Census Growth 2000- 2010 Growth 1990- 2000 Growth 1980- 1990 USA* 226,545,805 248,709,873 281,421,906 309,038,974 9.81% 13.15% 9.78% Mississppi 2,520,638 2,573,216 2,844,658 2,967,297 4.31% 10.55% 2.09% DeSoto County 53,930 67,910 107,199 161,252 50.42% 57.85% 25.92% Source: US Census Bureau, *Claritas
  2. Total Population Shelby County, Memphis Description 1980 Census 1990 Census

    2000 Census 2010 Census Growth 2000- 2010 Growth 1990- 2000 Growth 1980- 1990 Shelby County 777,113 826,330 897,472 927,644 3.36% 8.61% 6.33% Memphis 646,356 660,536 650,100 646,889 -0.49% -1.58% 2.19% Source: US Census Bureau
  3. Total Population Memphis Contiguous Counties Description 1980 Census 1990 Census

    2000 Census 2010 Census Growth 1980- 1990 Growth 1990- 2000 Growth 2000- 2010 Fayette County 25,305 25,559 28,806 38,413 1.00% 12.70% 33.35% Tipton County 32,930 37,568 51,271 61,081 14.08% 36.48% 19.13% Crittenden County, AR 49,499 49,939 50,866 50,902 0.89% 1.86% 0.07% DeSoto County 53,930 67,910 107,199 161,252 25.92% 57.85% 50.42% Source: US Census Bureau
  4. Population Projections 2010 Census 2015 % Change 2020 % Change

    2025 % Change Mississippi 2,967,297 3,090,895 4.2% 3,160,850 2.3% 3,218,871 1.8% DeSoto County 161,252 196,459 21.8% 219,151 11.6% 240,491 9.7% Shelby County, TN 927,644 887,968 -4.3% 875,972 -1.4% 892,254 1.9% Source: Univ. of MS, Univ. of TN, Univ. of AR
  5. Population Projections Memphis MSA 2010 Census 2015 % Change 2020

    % Change 2025 % Change Memphis MSA 1,316,100 1,329,379 1.0% 1,353,457 1.8% 1,401,079 3.5% Shelby 927,644 887,968 -4.3% 875,972 -1.4% 892,254 1.9% Tipton 61,081 62,837 2.9% 66,124 5.2% 71,161 7.6% Fayette 38,413 47,925 24.8% 54,051 12.8% 54,901 1.6% DeSoto 161,252 196,459 21.8% 219,151 11.6% 240,491 9.7% Tunica 10,778 11,864 10.1% 12,453 5.0% 12,902 3.6% Tate 28,886 28,595 -1.0% 29,699 3.9% 30,922 4.1% Marshall 37,144 37,691 1.5% 38,390 1.9% 38,987 1.6% Crittenden, AR 50,902 56,040 10.1% 57,617 2.8% 59,461 3.2% Source: Univ. of MS, Univ. of TN, Univ. of AR
  6. Population by Racial Distribution White 71% Black 22% Asian 1%

    Hispanic 5% Other 0% Two Races 1% DeSoto County White 65% Black 12% Asian 4% Hispanic 16% Other 1% Two Races 2% US Source: US Census Bureau, 2010 Source: Neilsen Claritas
  7. Population by Age Cohorts US % Mississippi % DeSoto County

    % Shelby County % Age 0 - 4 6.90 7.52 7.82 7.67 Age 5 - 9 6.61 7.10 8.18 7.23 Age 10 - 14 6.55 6.95 7.96 7.30 Age 15 - 17 4.20 4.36 4.63 4.64 Age 18 - 20 4.28 4.80 3.85 4.35 Age 21 - 24 5.43 5.74 5.06 5.42 Age 25 - 34 13.33 13.04 14.37 12.23 Age 35 - 44 13.65 12.67 14.40 13.59 Age 45 - 54 14.42 13.62 13.37 14.86 Age 55 - 64 11.47 11.21 10.20 11.98 Age 65 - 74 6.98 7.01 6.24 6.11 Age 75 - 84 4.26 4.15 2.99 3.24 Age 85 and over 1.92 1.83 0.94 1.39 Source: Nielson Claritas
  8. 2010 Median Age • United States 36.98 • Mississippi 35.39

    • DeSoto Co. 33.70 • Shelby Co. 37.92 Source: Nielson Claritas
  9. Annual Average Household Income Source: Neilson Claritas • United States

    $71,071 • Mississippi $51,752 • DeSoto Co. $69,736 • Shelby Co. $58,839
  10. Households by Income Level Source: Nielson Claritas DeSoto County Less

    than $15,000 $15,000 - $24,999 $25,000 - $34,999 $35,000 - $49,999 $50,000 - $74,999 $75,000 - $99,999 $100,000 - $124,999 $125,000 - $149,999 $150,000 - $199,999 $200,000 - $499,999
  11. Corridor Profile Population Growth 1990 11,222 2000 16,553 47.5% 2010

    26,998 63.1% % of Population White 75% Black 21% Other 4% Median Age 35.88 Average HH Income $76,164 Source: US Census Bureau, Claritas
  12. Migration DeSoto & Shelby Counties 2004-2005 Average Household Income Households

    Income DeSoto to Shelby $ 30,969 1,227 $38 Million Shelby to DeSoto $ 41,211 2,378 $98 Million 2007-2008 Average Household Income Households Income DeSoto to Shelby $32,885 1,338 $44 Million Shelby to DeSoto $39,967 2,427 $97 Million Source: Internal Revenue Service
  13. Housing Starts 0 500 1000 1500 2000 2500 3000 1996

    1997 1998 1999 2000 2001 2002 2003 2004 2005 2006 2007 2008 2009 2010 DeSoto County, Mississippi Source: US Census Bureau
  14. Housing Starts 0 1000 2000 3000 4000 5000 6000 1996

    1997 1998 1999 2000 2001 2002 2003 2004 2005 2006 2007 2008 2009 Shelby County, Tennessee Source: US Census Bureau
  15. Housing Starts Source: US Census Bureau 0 100 200 300

    400 500 600 700 800 1996 1997 1998 1999 2000 2001 2002 2003 2004 2005 2006 2007 2008 2009 2010 Fayette County, Tennessee
  16. Single Family Homes 1000 1200 1400 1600 1800 2000 2200

    2400 1973 1983 1993 2003 2009 United States South Average Square Footage Source: US Census Bureau, Dept. of Construction & Manufacturing
  17. DeSoto County Schools • Schools Built in Past: – 10

    years 17 – 7 years 15 – 1 year 3 • School System Total Debt: $211,680,000 • Average Spending per Student: $7,769 Source: DeSoto County School System
  18. DeSoto County Schools Achievement Levels • Enrollment 30,616 • Graduation

    Rate 84.5% • Proficient Math 67% • Proficient Science 39% • Average ACT Composite 21 Source: MS Dept of Education
  19. DeSoto County School System 65 70 75 80 85 90

    Total 4-year Asian Black Hispanic White Graduation Rates % Source: MS Dept of Education
  20. DeSoto County School System 65 70 75 80 85 90

    95 Total 4-year Black Female White Female Black Male White Male Graduation Rate % Source: MS Dept of Education
  21. State & Local Tax Burden • TN 7.6% • MS

    8.7% Percentage of Wages Paid in State and Local Taxes Source: Tax Foundation
  22. DeSoto County Retail Sales Fiscal Year Total Retail % Growth

    from Prior Period 2010 $2,157,549,219 4.8% 2005 $2,059,474,877 69.0% 2000 $1,218,684,856 124.9% 1995 $541,848,781 Auto 14% Machinery, Equipment & Supplies 3% Food & Beverage 28% Furniture & Fixtures 4% Apparel & Gen Merch 30% Building Materials 9% Contracting 11% Recreation 1% Distribution of Sales Source: MS Dept of Revenue
  23. Retail Location Criteria Example • Population in Trade Area 125,000

    • Average Daily Traffic Count 30,000 • Household Income Level $75,000 or above
  24. Distribution of Labor Natural Resources & Mining 1% Construction 6%

    Manufacturing 12% Wholesale Trade 5% Retail Trade 13% Transportation & Warehousing 4% Information 3% Financial Activities 5% Professional & Business Services 15% Education & Health Services 23% Leisure & Hospitality 10% Other Services 3% US 2009 Source: US Bureau of Labor Statistics
  25. Distribution of Labor Construction 7% Manufacturing 17% Wholesale Trade 5%

    Retail Trade 18% Transportation & Warehousing 8% Information 0% Financial Activities 2% Professional & Business Services 16% Education & Health Services 9% Leisure & Hospitality 15% Other Services 3% DeSoto Co., MS 2009 Source: MS Department of Employment Security
  26. Distribution of Labor Natural Resources & Mining 2% Construction 5%

    Manufacturing 18% Utilities 1% Wholesale Trade 3% Retail Trade 14% Transportation & Warehousing 4% Information 2% Financial Activities 3% Professional & Business Services 9% Education & Health Services 24% Leisure & Hospitality 13% Other Services 2% MS 2009 Source: MS Department of Employment Security
  27. Distribution of Labor Construction 5% Manufacturing 9% Wholesale Trade 8%

    Retail Trade 13% Transportation & Warehousing 13% Information 2% Financial Activities 7% Professional & Business Services 16% Education & Health Services 14% Leisure & Hospitality 10% Other Services 3% Shelby Co., TN 2009 Source: TN Department of Labor and Workforce Development
  28. Unemployment Rates 0.0% 2.0% 4.0% 6.0% 8.0% 10.0% 12.0% 14.0%

    1983 1991 2000 2007 2010 DeSoto County Mississippi US Source: US Bureau of Labor Statistics, MS Department of Employment Security
  29. Average Commute Time US % Mississippi % DeSoto County %

    Shelby County % Less than 15 Minutes 39,911,501 28.6% 394,617 32.4% 17,031 21.8% 100,702 24.4% 15 - 29 Minutes 50,462,298 36.1% 442,883 36.3% 31,017 39.6% 191,717 46.5% 30 - 44 Minutes 27,499,999 19.7% 225,514 18.5% 21,713 27.7% 86,793 21.0% 45 - 59 Minutes 10,471,977 7.5% 74,915 6.1% 5,589 7.1% 20,228 4.9% 60 or more Minutes 11,306,757 8.1% 80,567 6.6% 2,908 3.7% 13,140 3.2% Avg Travel Time to Work in Minutes • United States 26.83 • Mississippi 25.24 • DeSoto Co. 26.60 • Shelby Co. 24.22 Source: Neilson Claritas
  30. Average Commute Time By Cohort 0.0% 5.0% 10.0% 15.0% 20.0%

    25.0% 30.0% 35.0% 40.0% 45.0% 50.0% Less than 15 Minutes 15 - 29 Minutes 30 - 44 Minutes 45 - 59 Minutes 60 or more Minutes US Mississippi DeSoto County Shelby County Percent of Workforce Source: Neilson Claritas
  31. Annual Average Wage By Industry US Mississippi DeSoto Shelby Natural

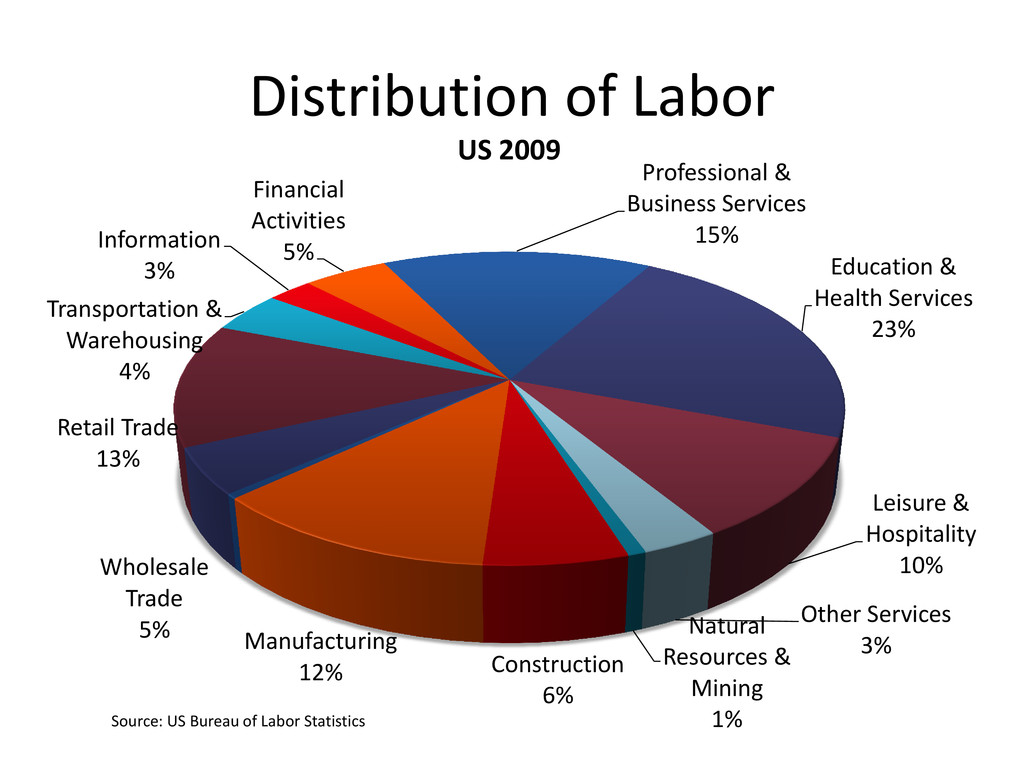
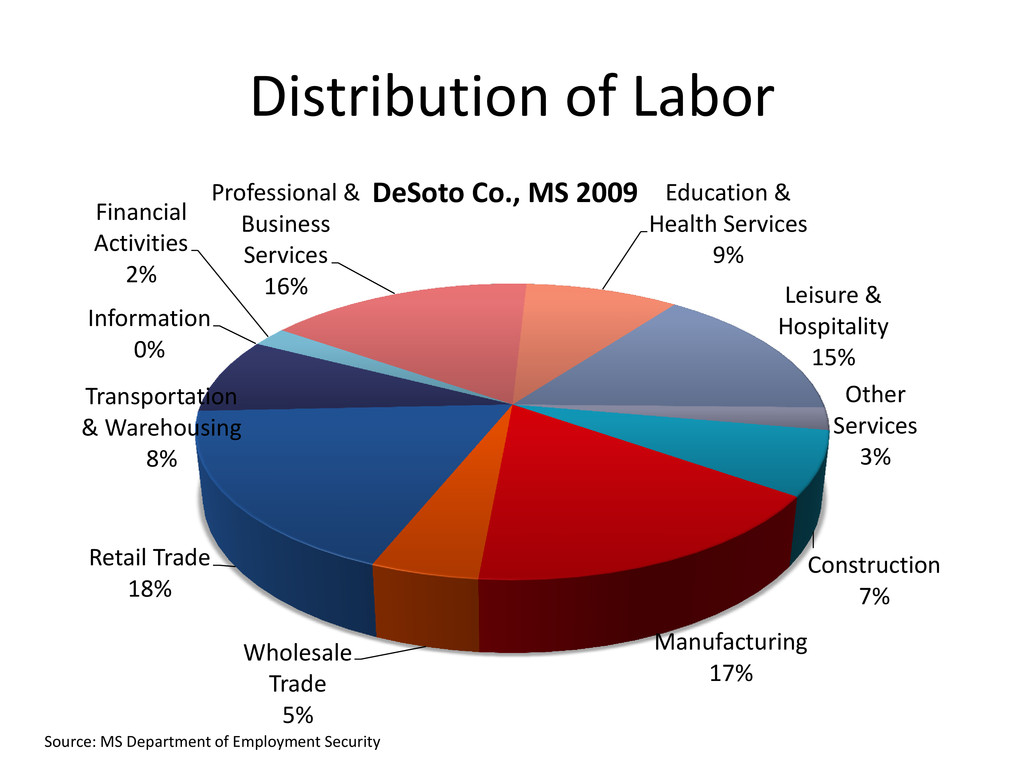
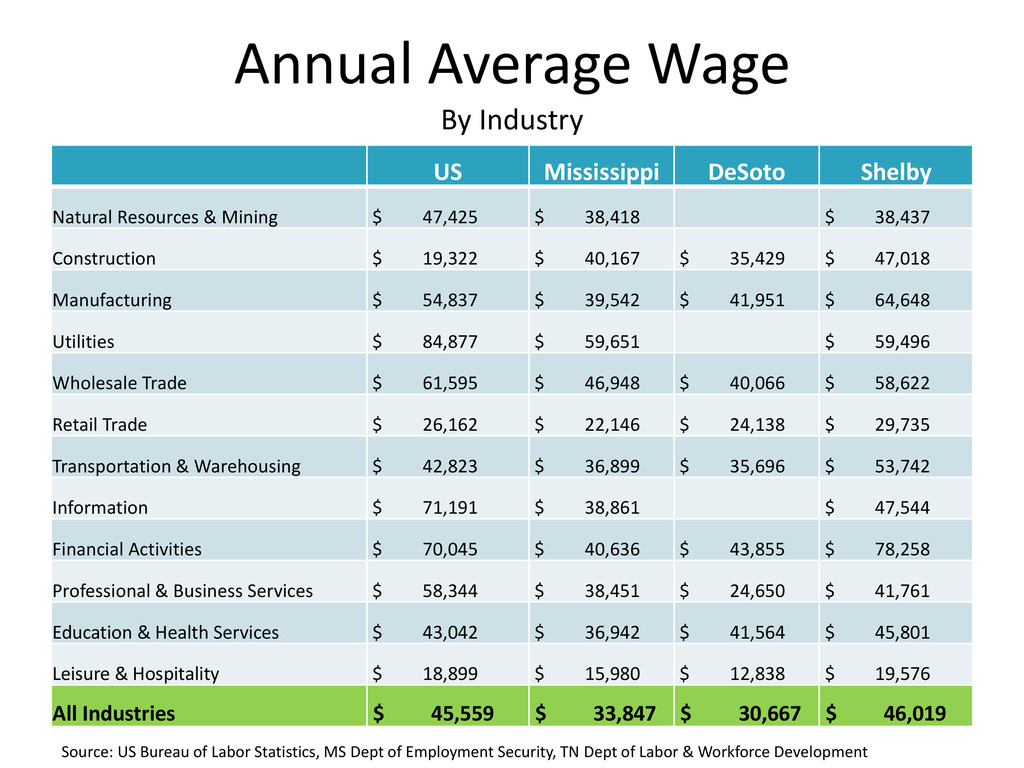
    Resources & Mining $ 47,425 $ 38,418 $ 38,437 Construction $ 19,322 $ 40,167 $ 35,429 $ 47,018 Manufacturing $ 54,837 $ 39,542 $ 41,951 $ 64,648 Utilities $ 84,877 $ 59,651 $ 59,496 Wholesale Trade $ 61,595 $ 46,948 $ 40,066 $ 58,622 Retail Trade $ 26,162 $ 22,146 $ 24,138 $ 29,735 Transportation & Warehousing $ 42,823 $ 36,899 $ 35,696 $ 53,742 Information $ 71,191 $ 38,861 $ 47,544 Financial Activities $ 70,045 $ 40,636 $ 43,855 $ 78,258 Professional & Business Services $ 58,344 $ 38,451 $ 24,650 $ 41,761 Education & Health Services $ 43,042 $ 36,942 $ 41,564 $ 45,801 Leisure & Hospitality $ 18,899 $ 15,980 $ 12,838 $ 19,576 All Industries $ 45,559 $ 33,847 $ 30,667 $ 46,019 Source: US Bureau of Labor Statistics, MS Dept of Employment Security, TN Dept of Labor & Workforce Development
  32. DeSoto County Major Employers COMPANY NAME SELECTED SIC DESC Actual

    Employment DeSoto County Schools Schools-Universities & Colleges Academic 3653 Baptist Memorial Hosp-Desoto & Rehab Hospital/Health Services 1930 Kroger (Hernando, Horn Lake, Olive Branch & Southaven) Grocers-Retail 729 DeSoto County School District Transportation & Security Transportation 500 Walmart Supercenter Department Stores 500 Landau Uniforms Inc Mens & Boys Suits Coats/Overcoats (Mfrs) 330 Future Electronics Electronic Equipment & Supplies-Retail 304 Lowe's (all locations) Home Improvements 300 Desoto Civic Ctr Convention & Meeting Facilities & Svc 300 Newly Weds Foods Sauces (Mfrs) 282 Source: Info USA
  33. COMPANY NAME SELECTED SIC DESC Actual Employment CSI Closures-Industrial-Protective (Mfrs)

    250 Terex Distribution Center Construction Equipment- Manufacturers 225 J T Shannon Lumber Inc Sawmills & Planing Mills- General (Mfrs) 220 ScanSource Computers-Wholesale 220 Home Depot Home Improvements 218 Stylecraft Home Collection Lighting Fixtures- Manufacturers 210 Milwaukee Electric Tool Corp Tools-Electric (Whls) 207 Brentwood Originals Manufacturers 201 M & H Construction General Contractors 200 Dillard's Department Stores 200 DeSoto County Major Employers Source: Info USA
  34. Occupations in Demand Occupation Education Required Industrial Production Managers 12-15

    yrs Storage & Distribution Managers 16 yrs Transportation Managers 16 yrs Accountants/Auditors 16+ yrs Financial Analysts 16+ yrs Human Resource Managers 16 yrs Customer Service Representatives 12 yrs Electrical/Industrial Equipment Repairers 12-15 yrs Conveyor Operators & Tenders 12 yrs Materials Movers-Supervisors 12-15 yrs Materials Movers-Laborers 12 yrs Truck Drivers 12 yrs or GED Source: Younger Associates Workforce Analysis 2010
  35. Education Levels 0 5 10 15 20 25 30 35

    40 US Mississippi DeSoto County Shelby County Percent of Total Source: Neilson Claritas
  36. Targeted Industries Mississippi Development Authority • Aerospace/Aviation • Automotive Assembly

    • Automotive Suppliers • Contact Centers • Communications & Information Technology • Remote Data Centers • Defense/Homeland Security • Food Processing • Metal Fabrication & Steel • Plastics/Polymers/Chemicals • Shared Services Centers • Shipbuilding • Timber/Wood Products • Warehouse & Distribution
  37. Targeted Industries Entergy: Technology Targets • Polymer Science • Marine

    Research • Remote Sensing • High Performance Computing
  38. Targeted Industries TVA • Data Centers • Transportation-Related Manufacturing •

    Food Processing & Packaging • Solar Component Manufacturing
  39. Targeted Industries Greater Memphis Chamber • Bio-medical • Electronics •

    Manufacturing/Logistics • Information Technology • Music/Film/Tourism
  40. STEM Degrees Greater Memphis Region North Mississippi Study Area North

    Mississippi Area Including Mississippi State University Engineering Technicians 110 53 101 Engineering 405 140 669 Mathematics 51 30 55 Computer Sciences 334 84 128 Chemistry, Biology, & Physical Sciences 532 170 478 The Annual Number of Science and Technology Graduates Is Low
  41. University of Mississippi • Oldest engineering school in Mississippi •

    Led by Dean Kai-Fong Lee • Bachelor’s Master’s and Ph.D degrees • Seven nationally recognized research centers • Center for Manufacturing Excellence was established as a result of Toyota in MS • Carnegie II Research Institution—one of the top 125 research institutions in the US
  42. Mississippi State University • The James Worth Bagley College of

    Engineering • One of the largest in the southeast with 109 faculty members • 18 research centers and labs • Center for Advanced Vehicular Systems (CAVS) • National Science Foundation Engineering Research Center • Aerospace Engineering School • Polymer Research Institute • Food Service Institute • National Strategic Planning, Analysis and Research Center
  43. University of Memphis • FedEx Institute of Technology is a

    gateway for businesses to work with university researchers • FedEx Center for Supply Chain Management is an alliance to create systems to move products better, faster and cheaper nationally and internationally • The Herf College of Engineering is also involved in research and offers advanced degrees
  44. Christian Brothers University • CBU School of Engineering offers flexible

    programs that allow students to earn a combined degree in engineering and computer science or business. • Dr. Yeu-Sheng Shiue is head of the Mechanical Engineering Department and an editor of the International Journal of Engineering Education.
  45. Northwest Mississippi Community College • Campuses in Senatobia and Southaven

    • Technical programs include automotive, computer information systems, electronics and tool and die Mid-South Community College • Advanced Manufacturing Technology Program • Provides specialized training for Hino Motors
  46. Top 5 Business Location Decision Factors •Quality of Workforce •Infrastructure

    •Proximity to Markets/Suppliers (or) •Access to Research & Development •Incentives •Quality of Life
  47. Employer Rating of Workforce Greater Memphis Region North Mississippi Region

    Work Ethic   Productivity   Willingness to Work Overtime   Punctuality   Overall Employer/Employee Relations   Willingness to Attend Training  
  48. Employer Rating of Basic Job Skills Greater Memphis Region North

    Mississippi Region Written Communication   Reading Comprehension   Math   Critical Thinking   Verbal Communication/Comprehension   Team and Cooperative Skills  
  49. What is “Quality of Life” Anyway? • Economy rich and

    diverse enough to provide opportunities for two-professional households • Strong K-12 educational opportunities • Environment where housing and income are in equilibrium • Trip to work is a manageable commute • Communities that welcome diversity
  50. Renewable Energy • Global Oil Markets Driving Faster Change •

    All Regions of U.S. Are Pursuing Opportunities • Alternative Vehicles – GreenTech, Toyota, New Battery Technology • Alternative Fuels – MS Biomass Initiative, KIOR in Columbus & Newton – Twin Creeks Tehnology in Senatobia • Green Buildings and Construction – Soladigm in Olive Branch
  51. Advanced Manufacturing • Manufacturing with process productivity that overcomes foreign

    labor cost advantages • TPS – Lean Manufacturing – ISO – Six Sigma • Often Associated with Automotive Manufacturing
  52. Global Logistics/Aerotropolis • The concept of an airport as a

    major economic engine • Memphis OLD: America’s Distribution Center Memphis NEW: America’s Aerotropolis • Aerotropolis 25 mile radius encompasses DesSoto County • Convergence of Road, River, Rail and Runway; Location position DeSoto Co. as important Global Logistics node
  53. Guiding Principles Recreation Entertainment – Preserve natural elements Education –

    Prepare for the future Residential – Variety of attractive, livable options Retail – Meet the needs of trade area Transportation – Prepare for alternate modes Infrastructure – telecommunications, broadband, flexibility