Different methods of detecting ANR at Uber ◦ Leveraging ApplicationExitInfo API • Managing your ANR ◦ Prevention during development and testing ◦ Monitoring for regression In Production • Available tools open source solutions
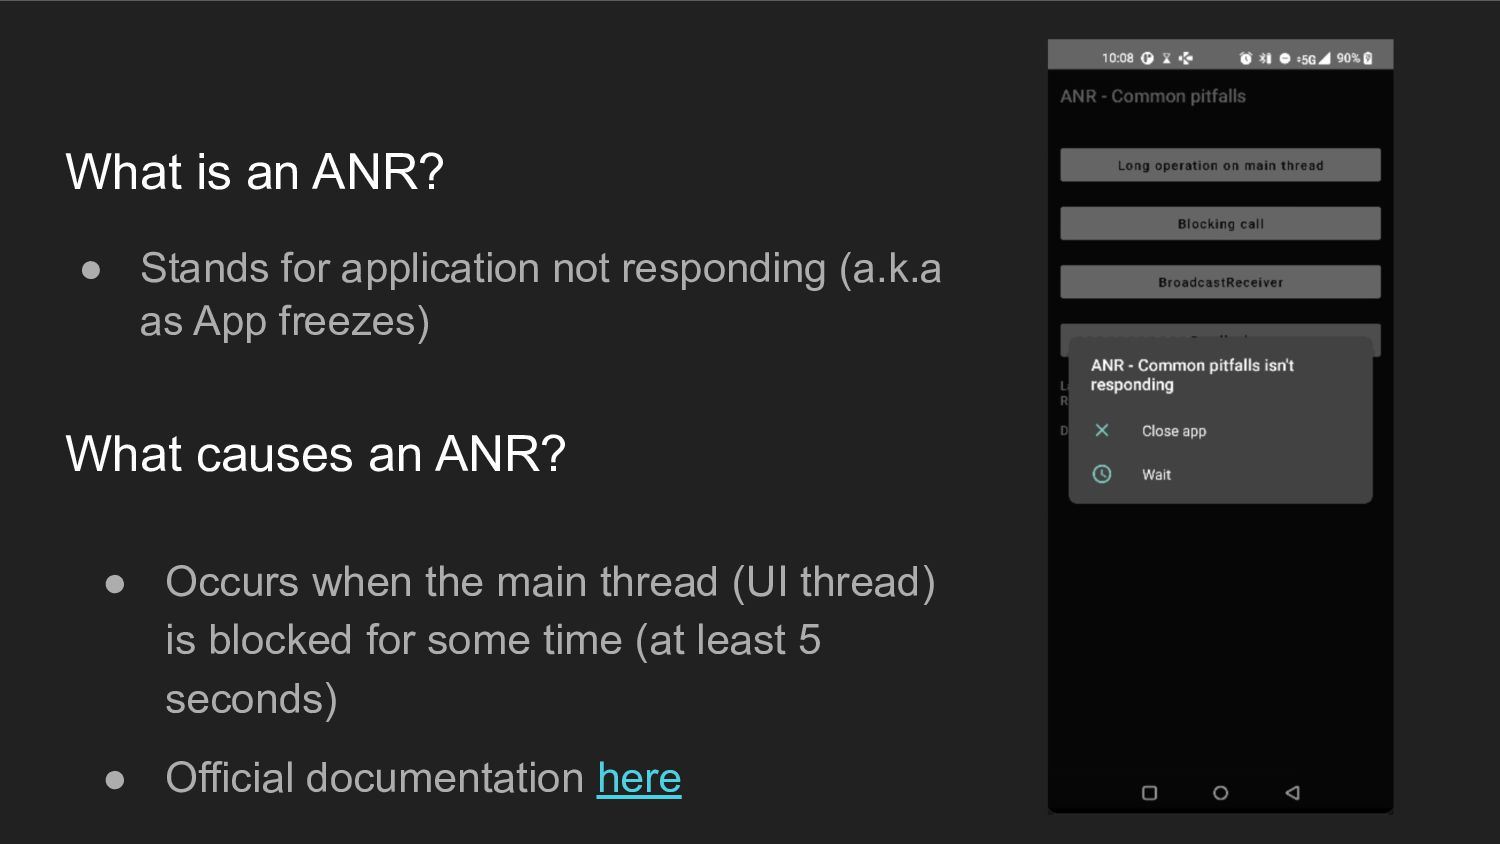
(a.k.a as App freezes) What causes an ANR? • Occurs when the main thread (UI thread) is blocked for some time (at least 5 seconds) • Official documentation here
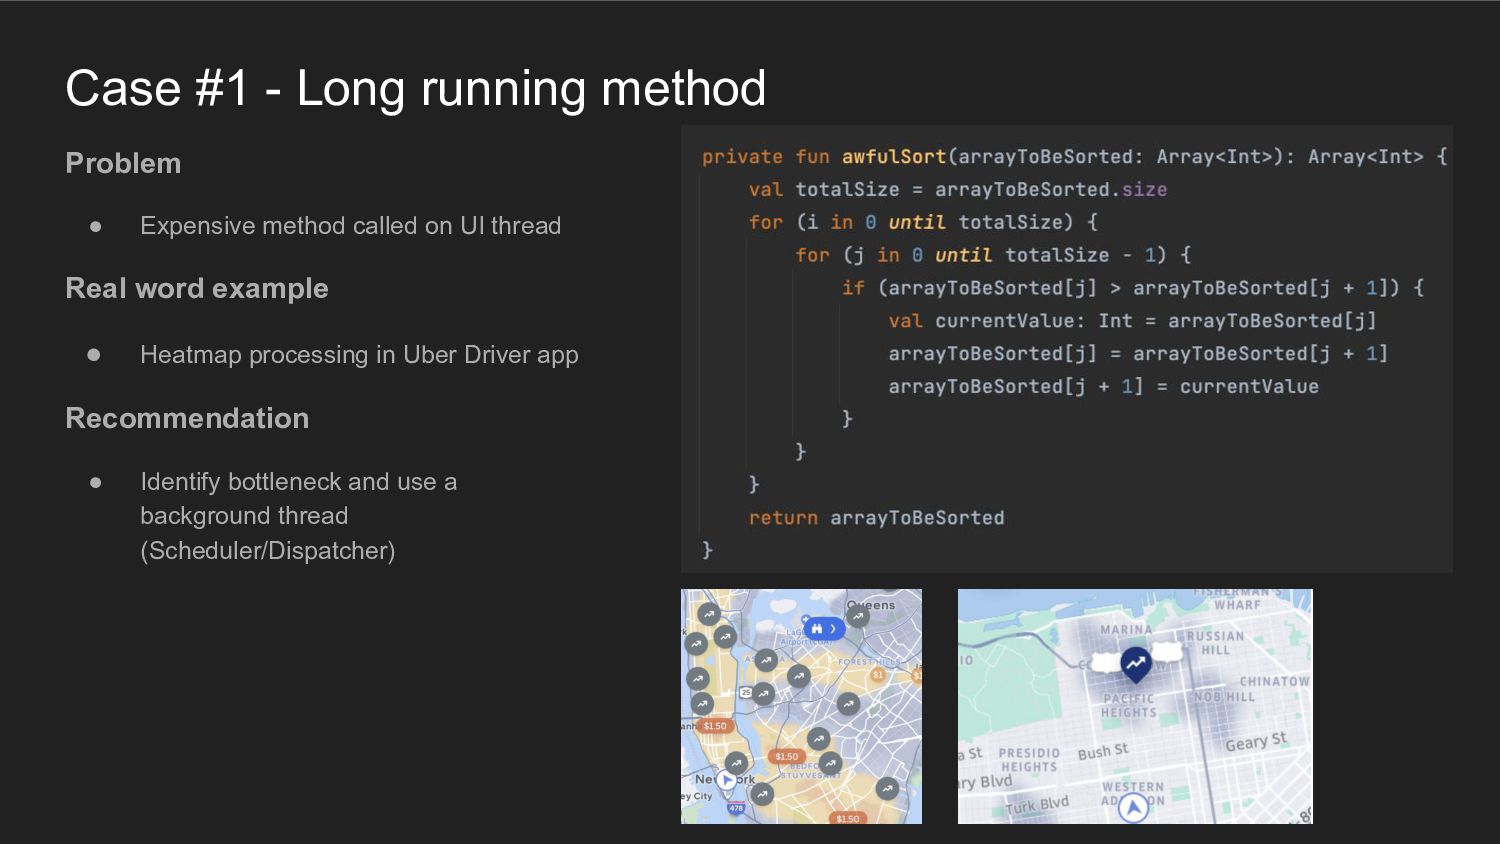
called on UI thread Real word example • Heatmap processing in Uber Driver app Recommendation • Identify bottleneck and use a background thread (Scheduler/Dispatcher)
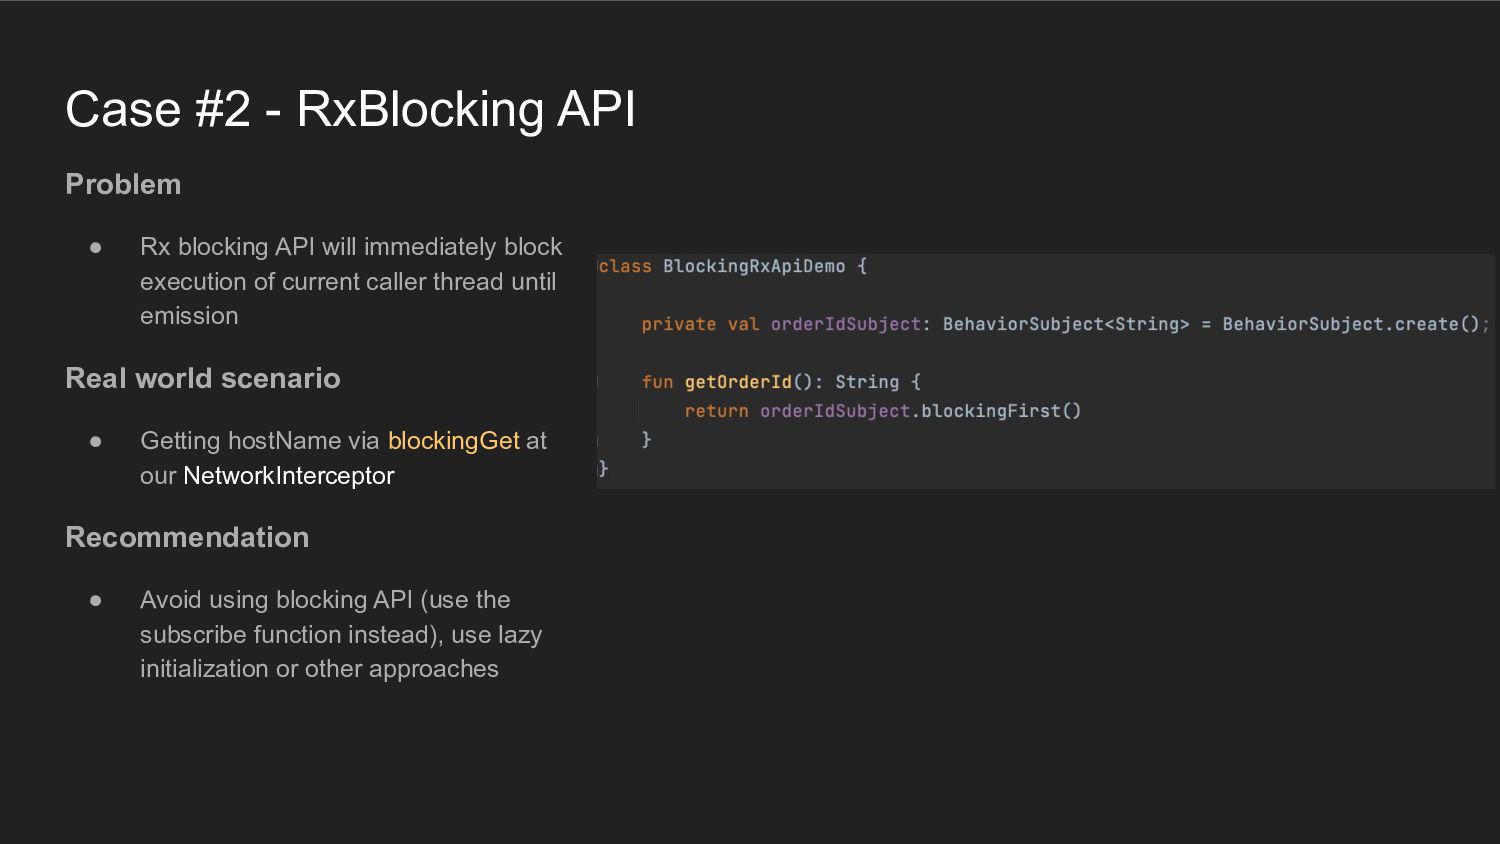
will immediately block execution of current caller thread until emission Real world scenario • Getting hostName via blockingGet at our NetworkInterceptor Recommendation • Avoid using blocking API (use the subscribe function instead), use lazy initialization or other approaches
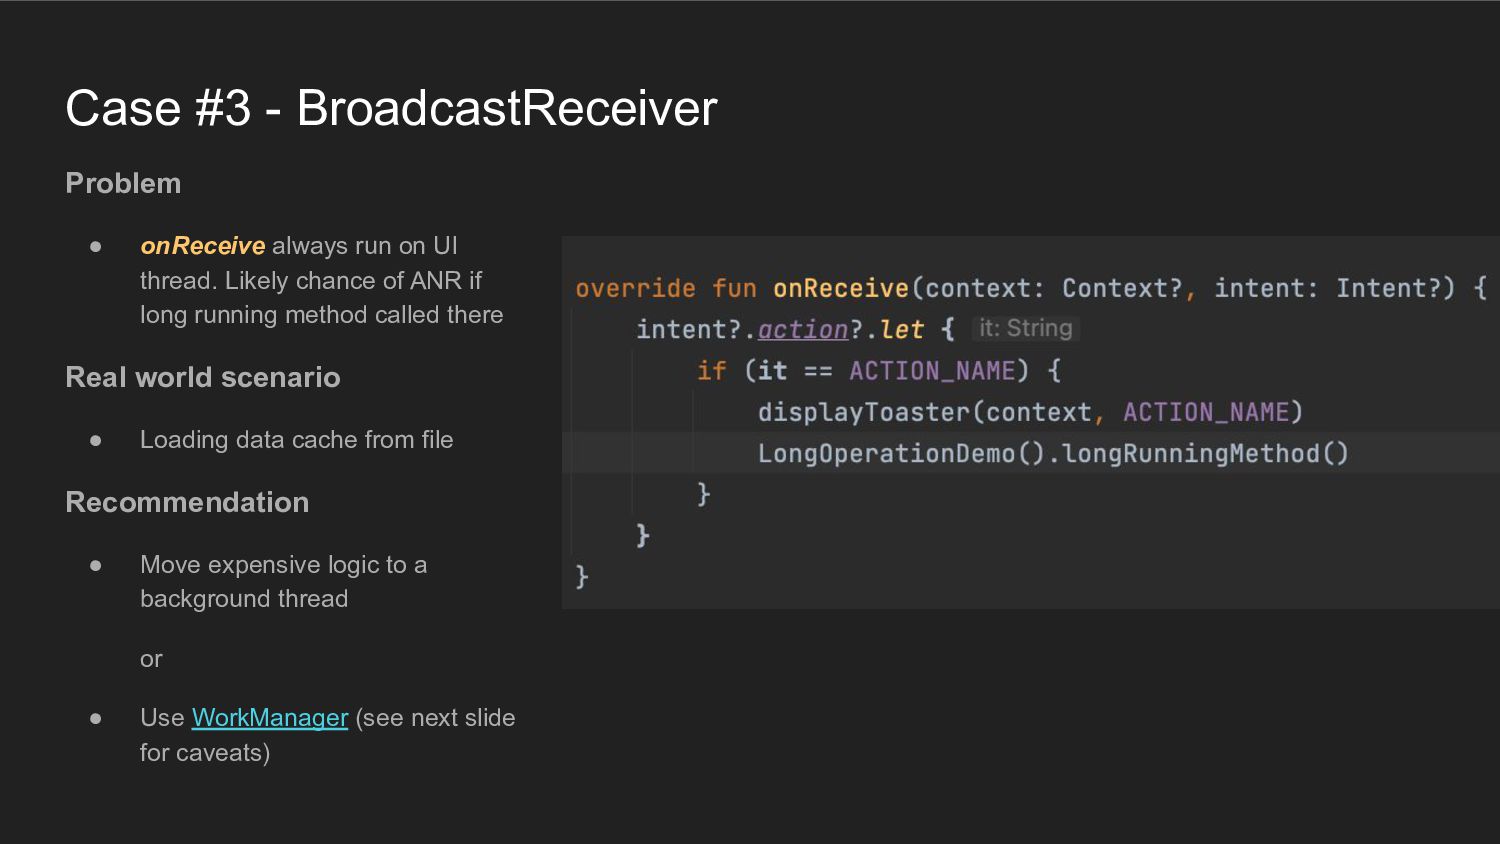
UI thread. Likely chance of ANR if long running method called there Real world scenario • Loading data cache from file Recommendation • Move expensive logic to a background thread or • Use WorkManager (see next slide for caveats)
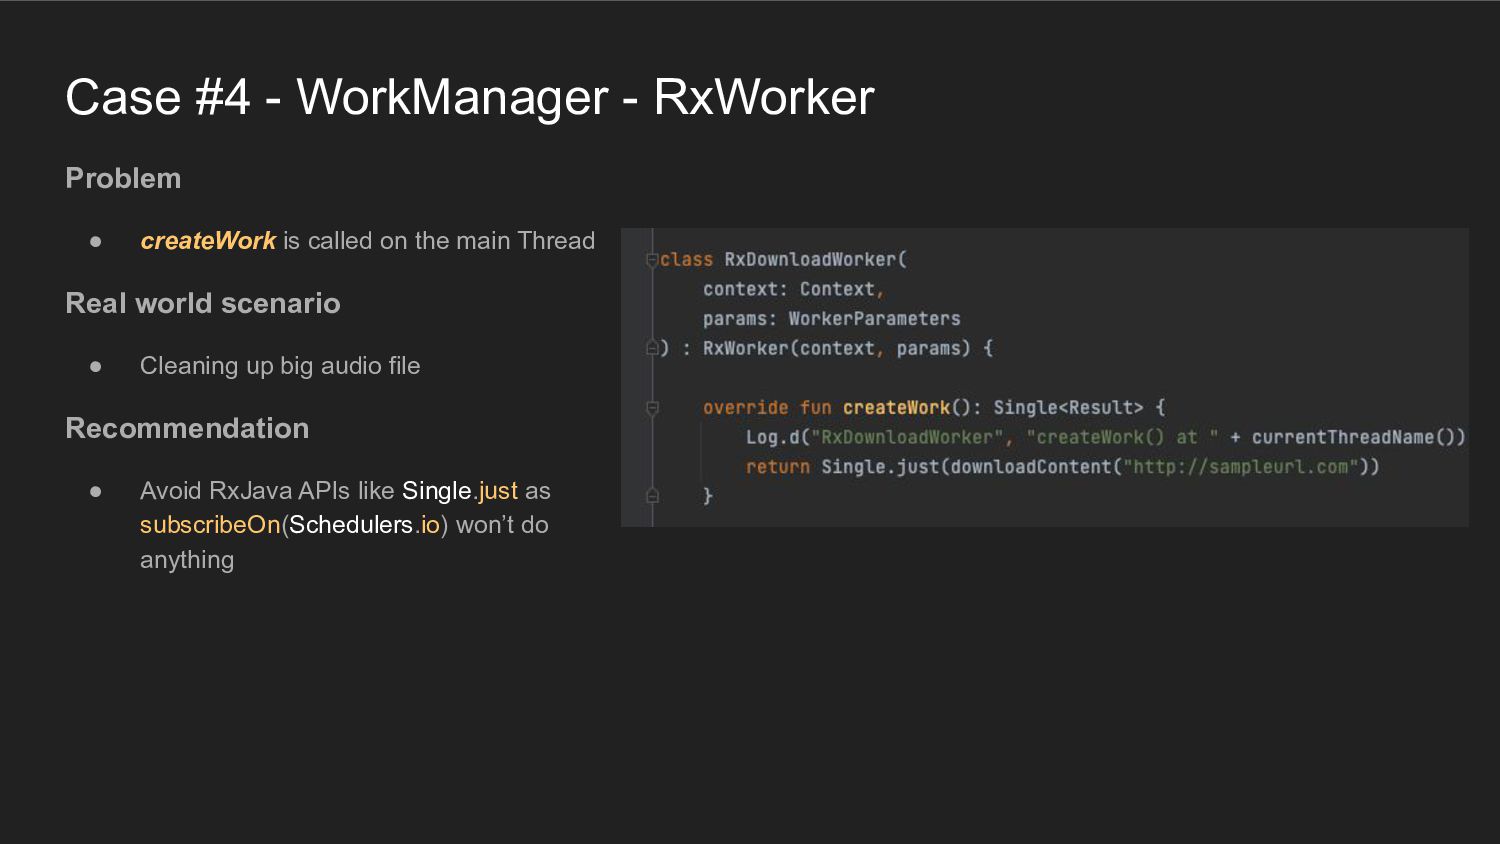
called on the main Thread Real world scenario • Cleaning up big audio file Recommendation • Avoid RxJava APIs like Single.just as subscribeOn(Schedulers.io) won’t do anything
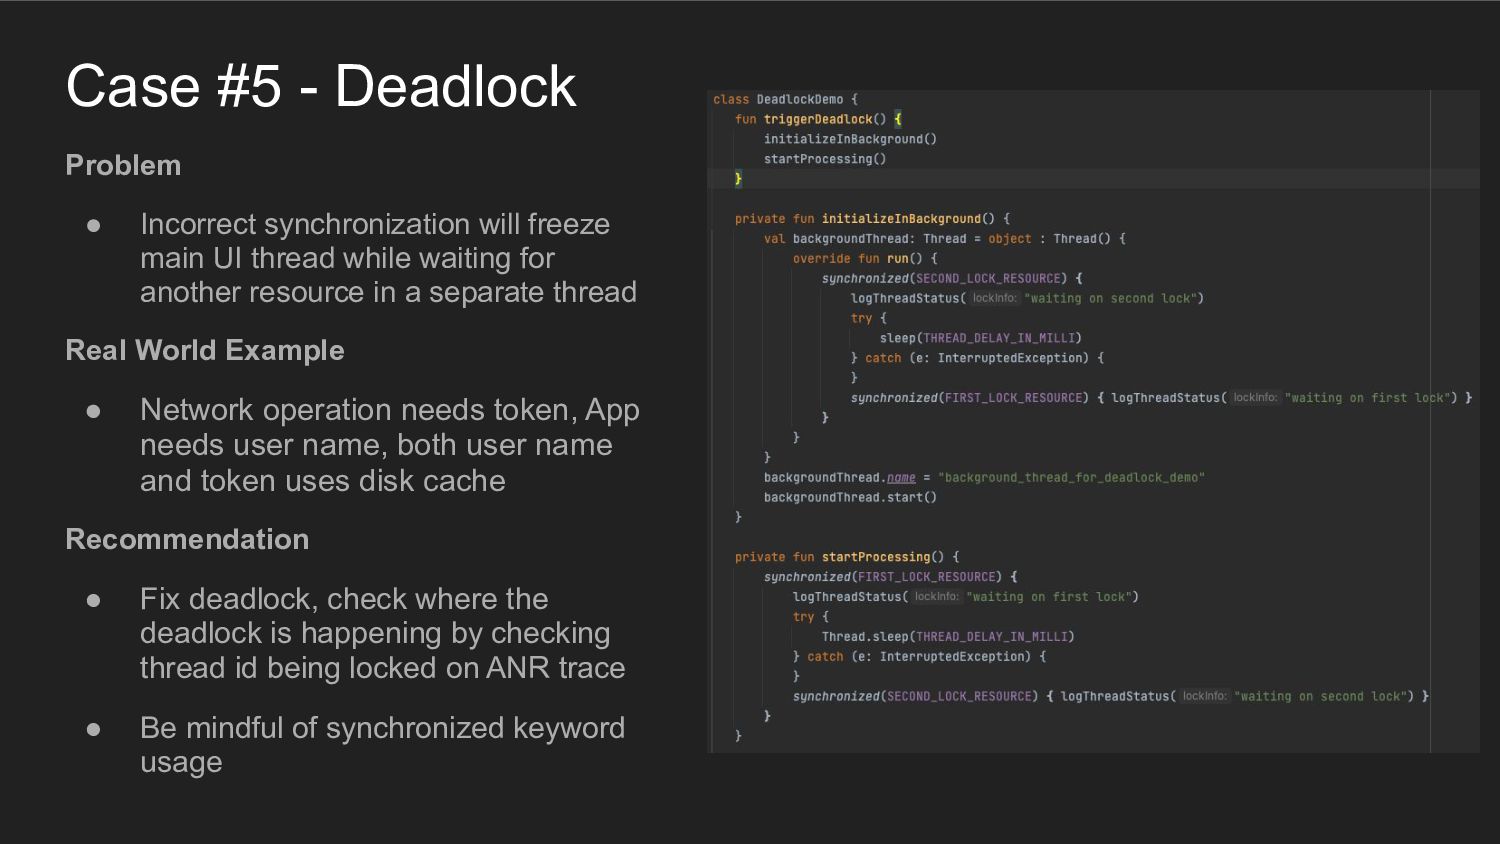
main UI thread while waiting for another resource in a separate thread Real World Example • Network operation needs token, App needs user name, both user name and token uses disk cache Recommendation • Fix deadlock, check where the deadlock is happening by checking thread id being locked on ANR trace • Be mindful of synchronized keyword usage
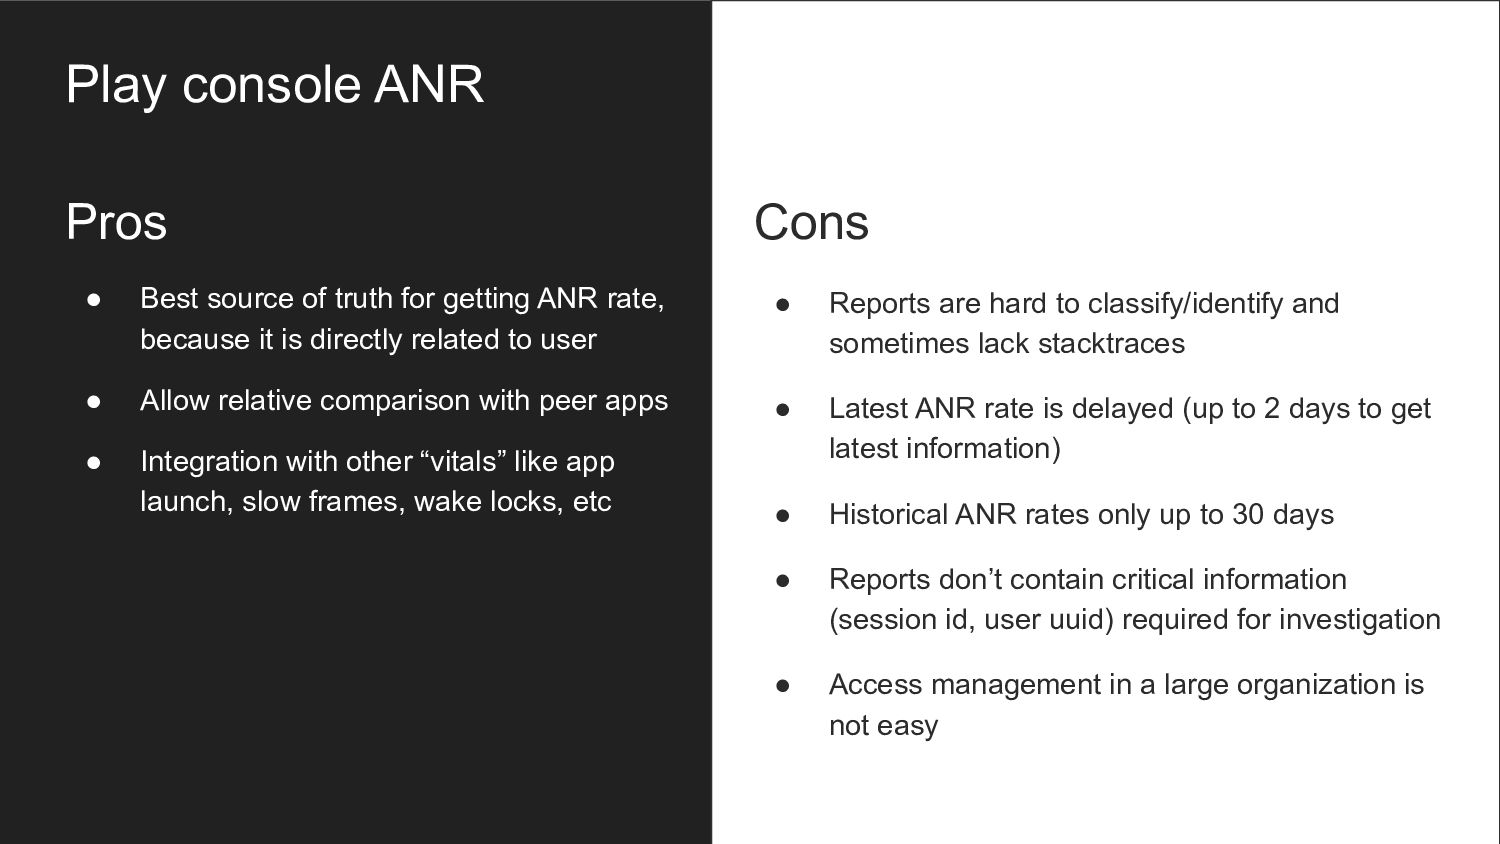
and sometimes lack stacktraces • Latest ANR rate is delayed (up to 2 days to get latest information) • Historical ANR rates only up to 30 days • Reports don’t contain critical information (session id, user uuid) required for investigation • Access management in a large organization is not easy Pros • Best source of truth for getting ANR rate, because it is directly related to user • Allow relative comparison with peer apps • Integration with other “vitals” like app launch, slow frames, wake locks, etc
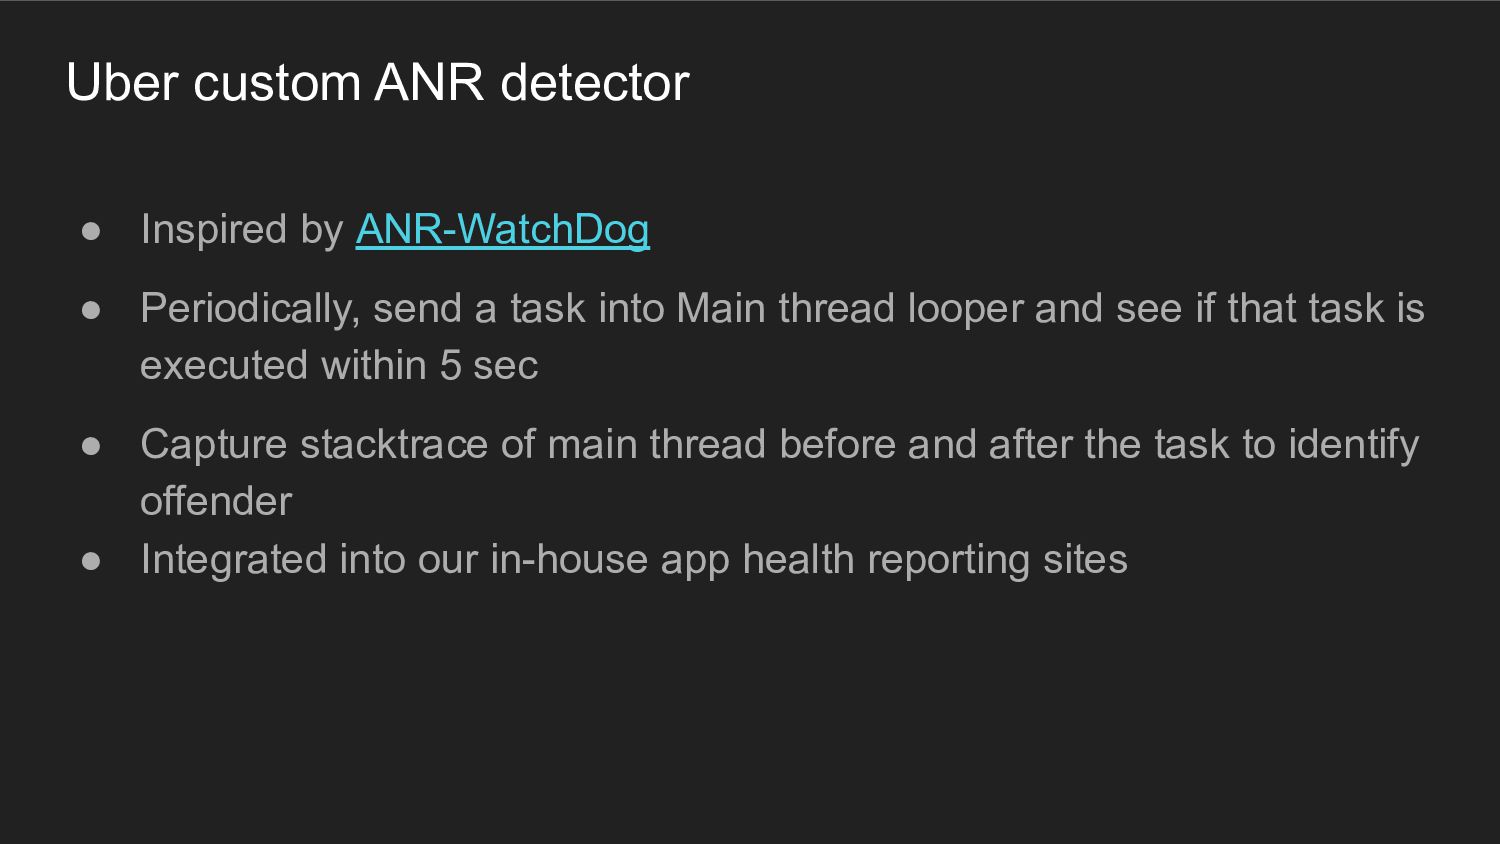
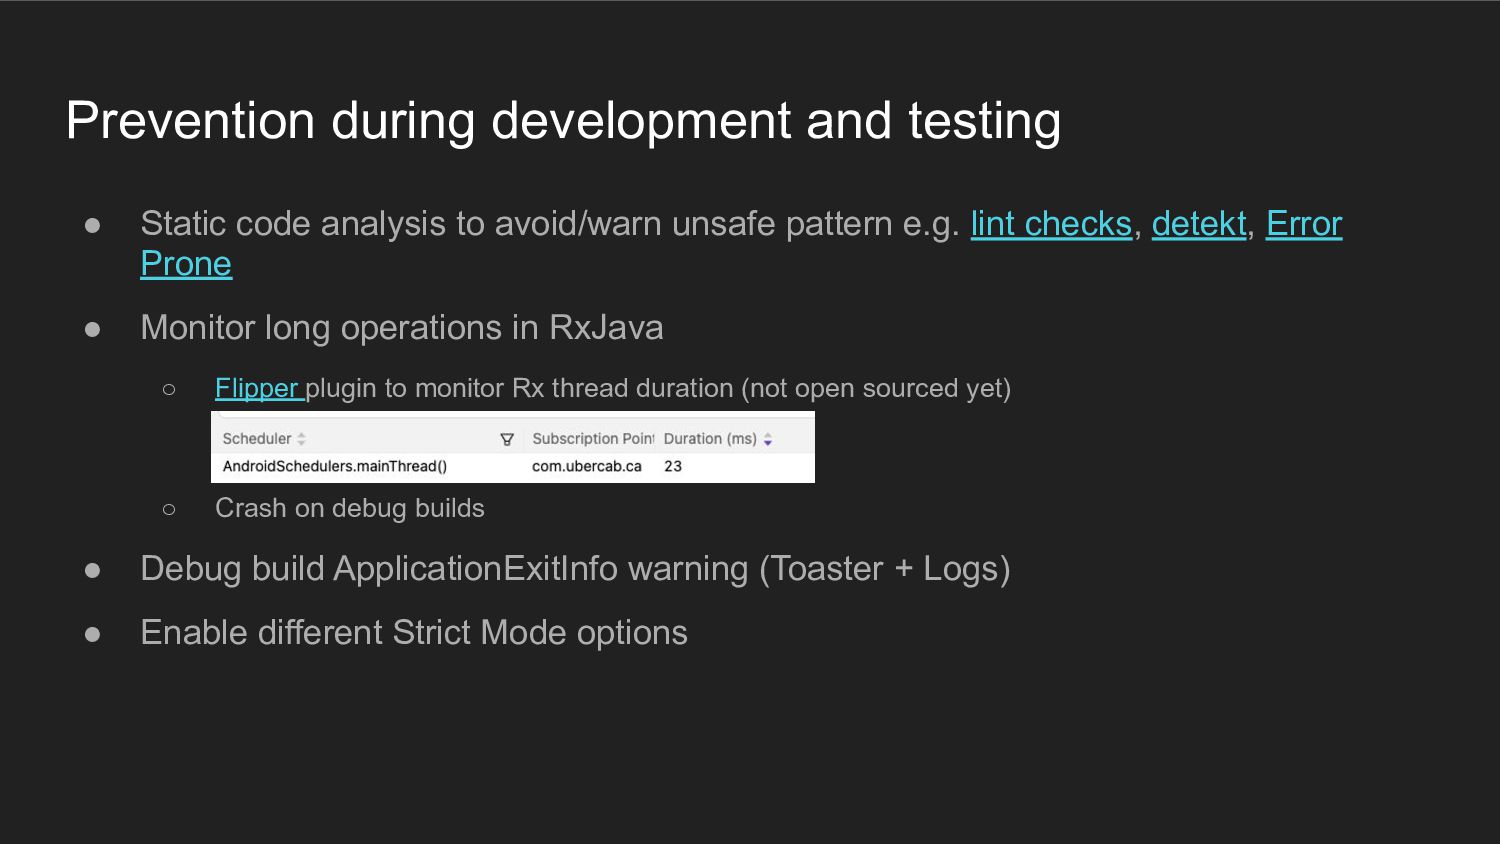
send a task into Main thread looper and see if that task is executed within 5 sec • Capture stacktrace of main thread before and after the task to identify offender • Integrated into our in-house app health reporting sites
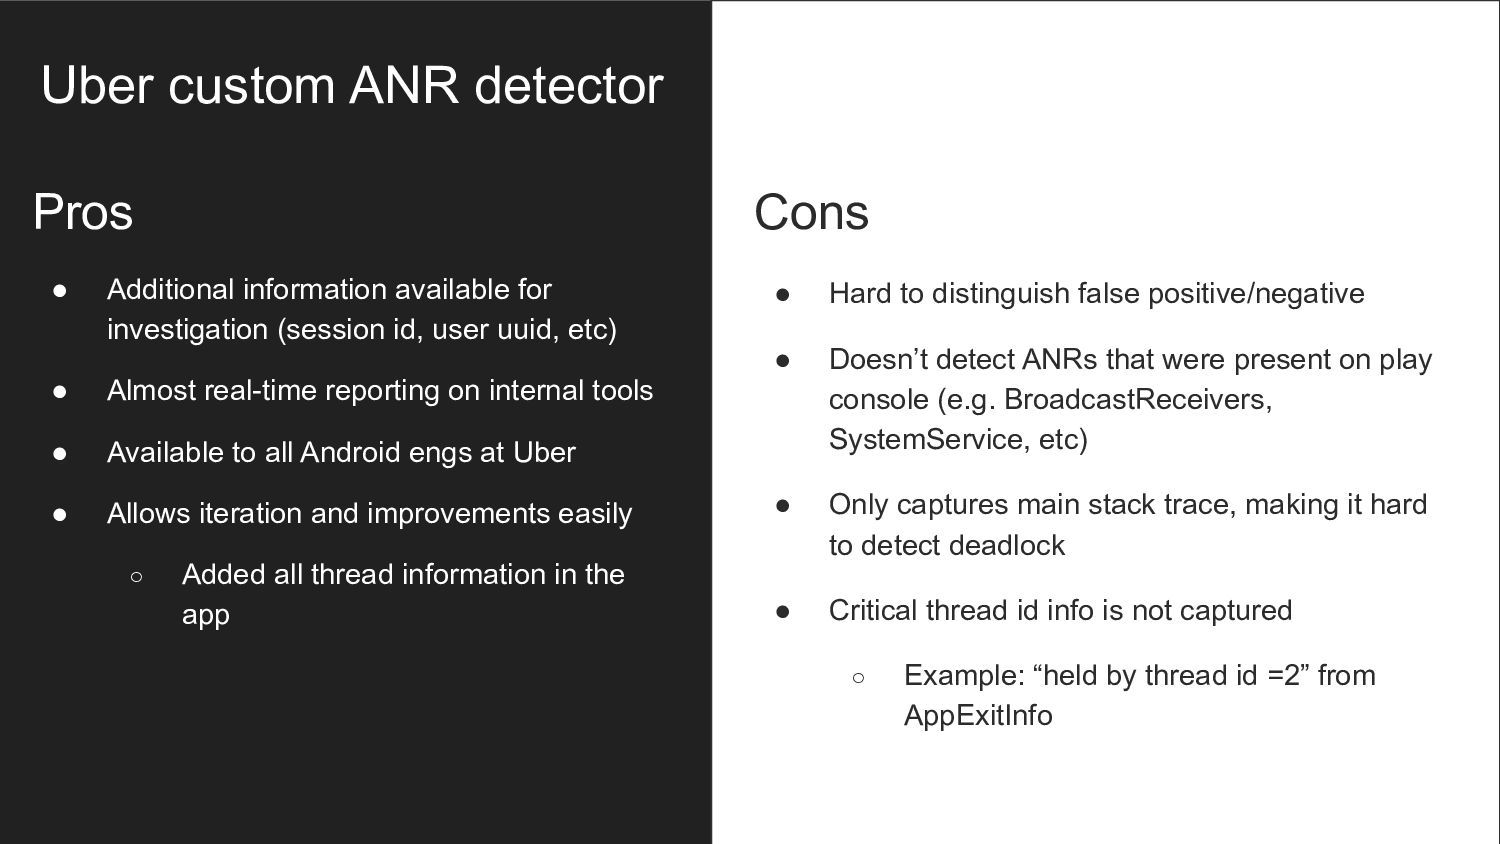
positive/negative • Doesn’t detect ANRs that were present on play console (e.g. BroadcastReceivers, SystemService, etc) • Only captures main stack trace, making it hard to detect deadlock • Critical thread id info is not captured ◦ Example: “held by thread id =2” from AppExitInfo Pros • Additional information available for investigation (session id, user uuid, etc) • Almost real-time reporting on internal tools • Available to all Android engs at Uber • Allows iteration and improvements easily ◦ Added all thread information in the app
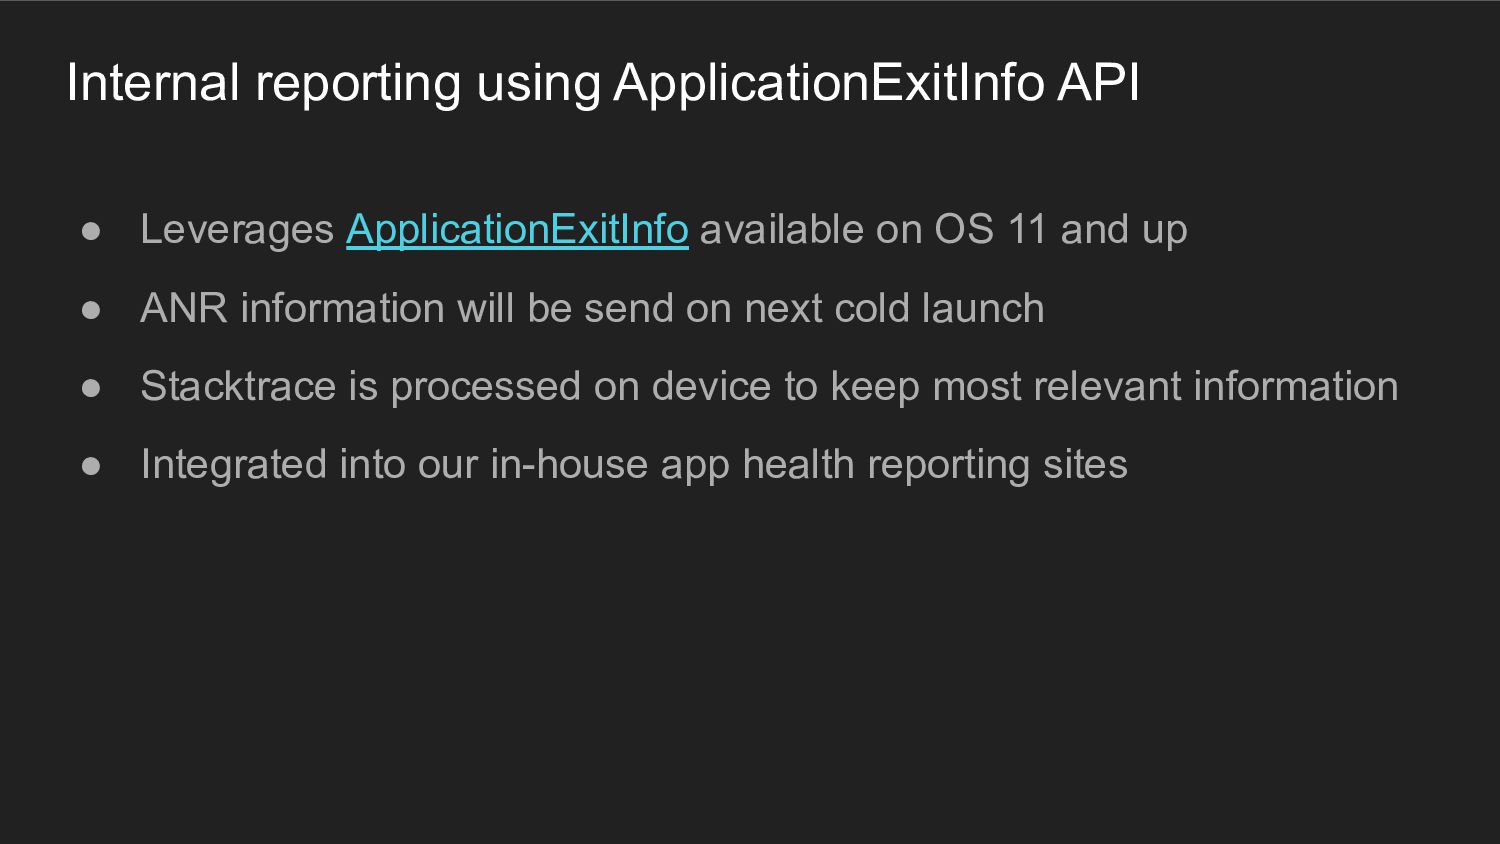
OS 11 and up • ANR information will be send on next cold launch • Stacktrace is processed on device to keep most relevant information • Integrated into our in-house app health reporting sites
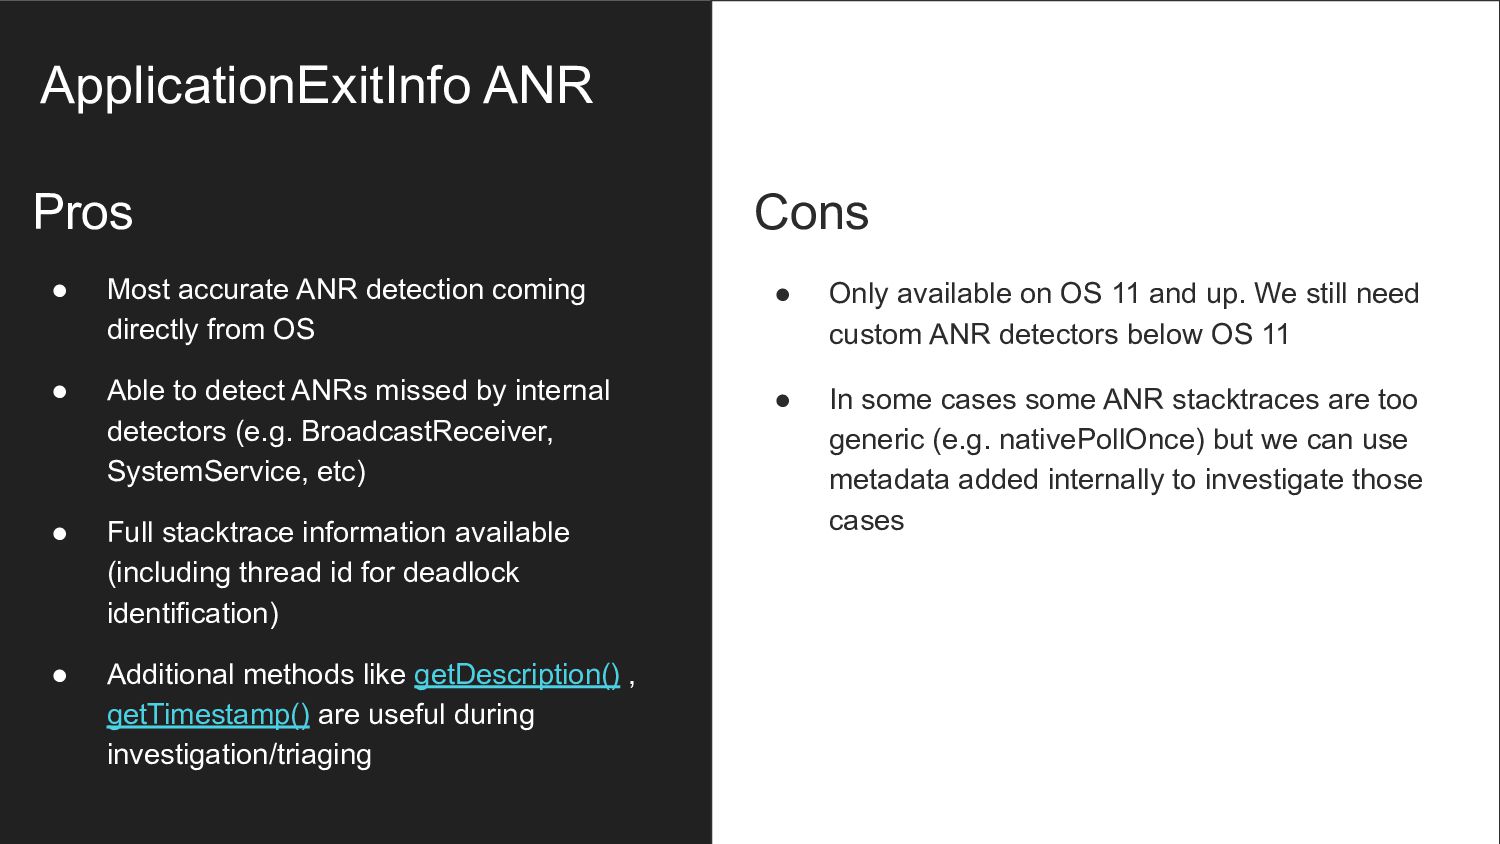
up. We still need custom ANR detectors below OS 11 • In some cases some ANR stacktraces are too generic (e.g. nativePollOnce) but we can use metadata added internally to investigate those cases Pros • Most accurate ANR detection coming directly from OS • Able to detect ANRs missed by internal detectors (e.g. BroadcastReceiver, SystemService, etc) • Full stacktrace information available (including thread id for deadlock identification) • Additional methods like getDescription() , getTimestamp() are useful during investigation/triaging
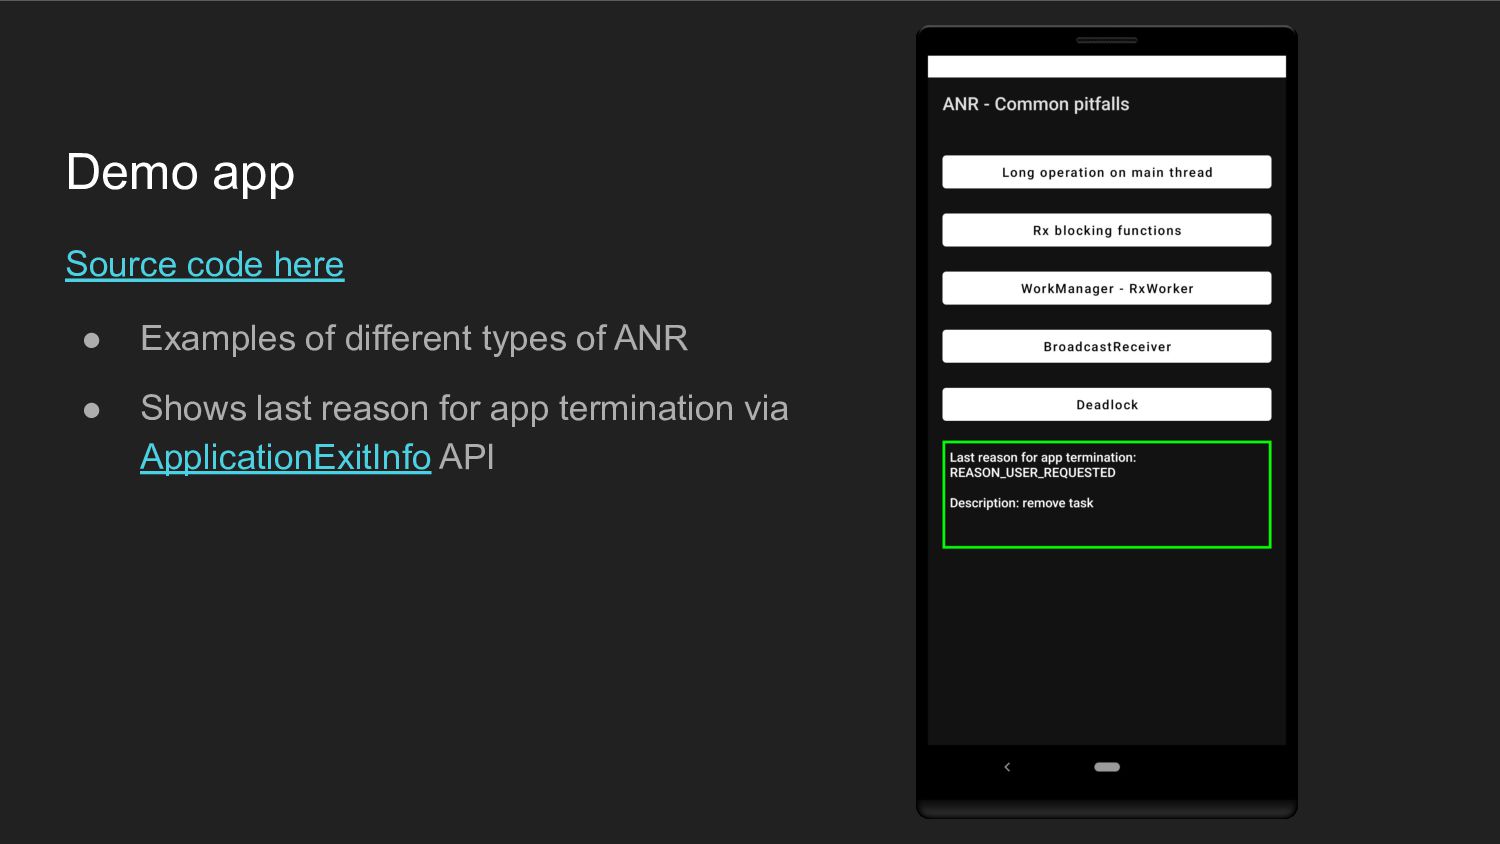
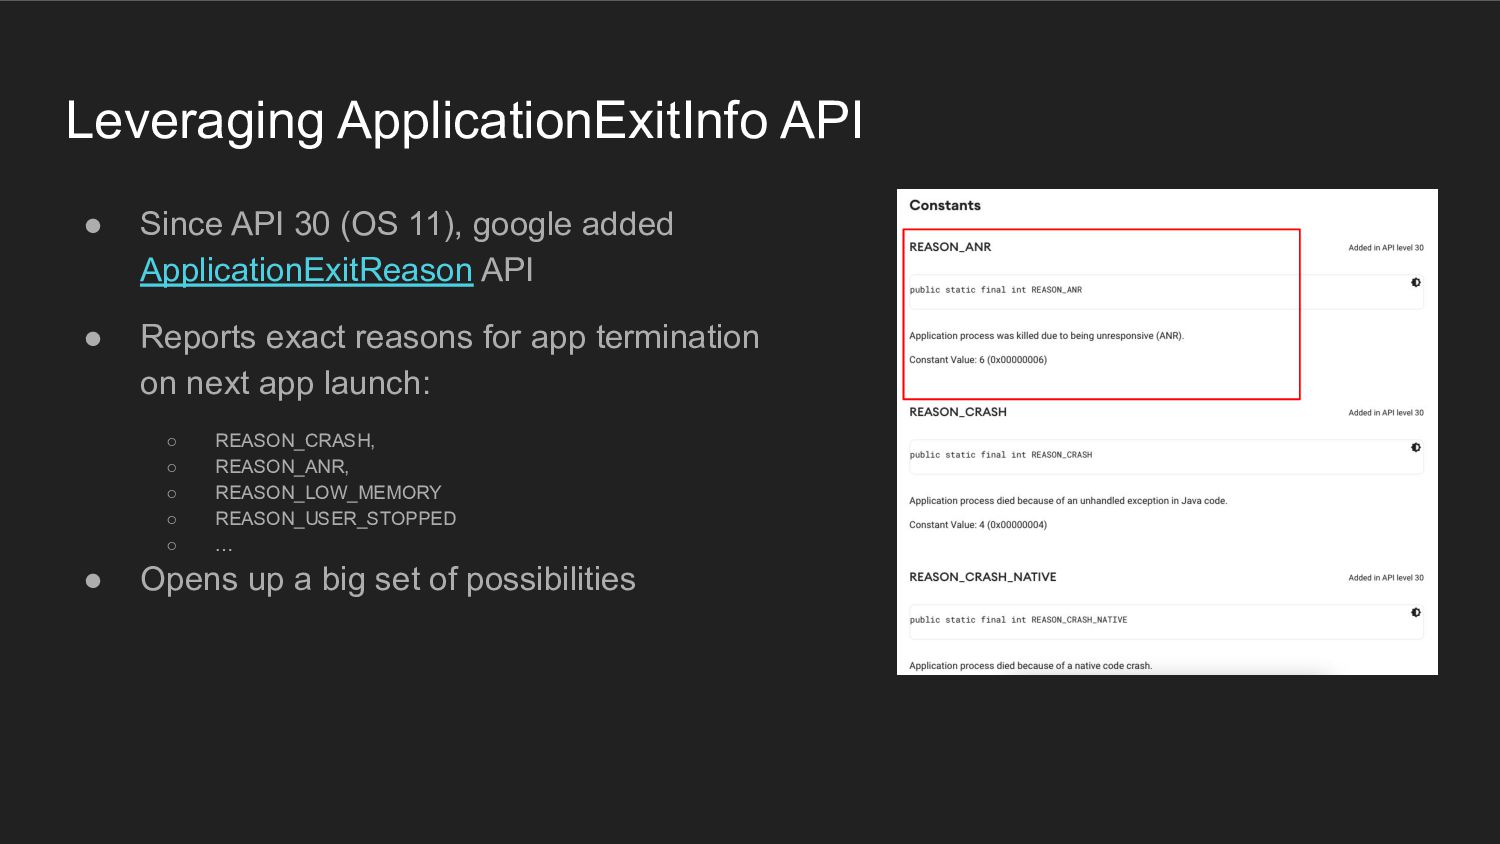
added ApplicationExitReason API • Reports exact reasons for app termination on next app launch: ◦ REASON_CRASH, ◦ REASON_ANR, ◦ REASON_LOW_MEMORY ◦ REASON_USER_STOPPED ◦ … • Opens up a big set of possibilities
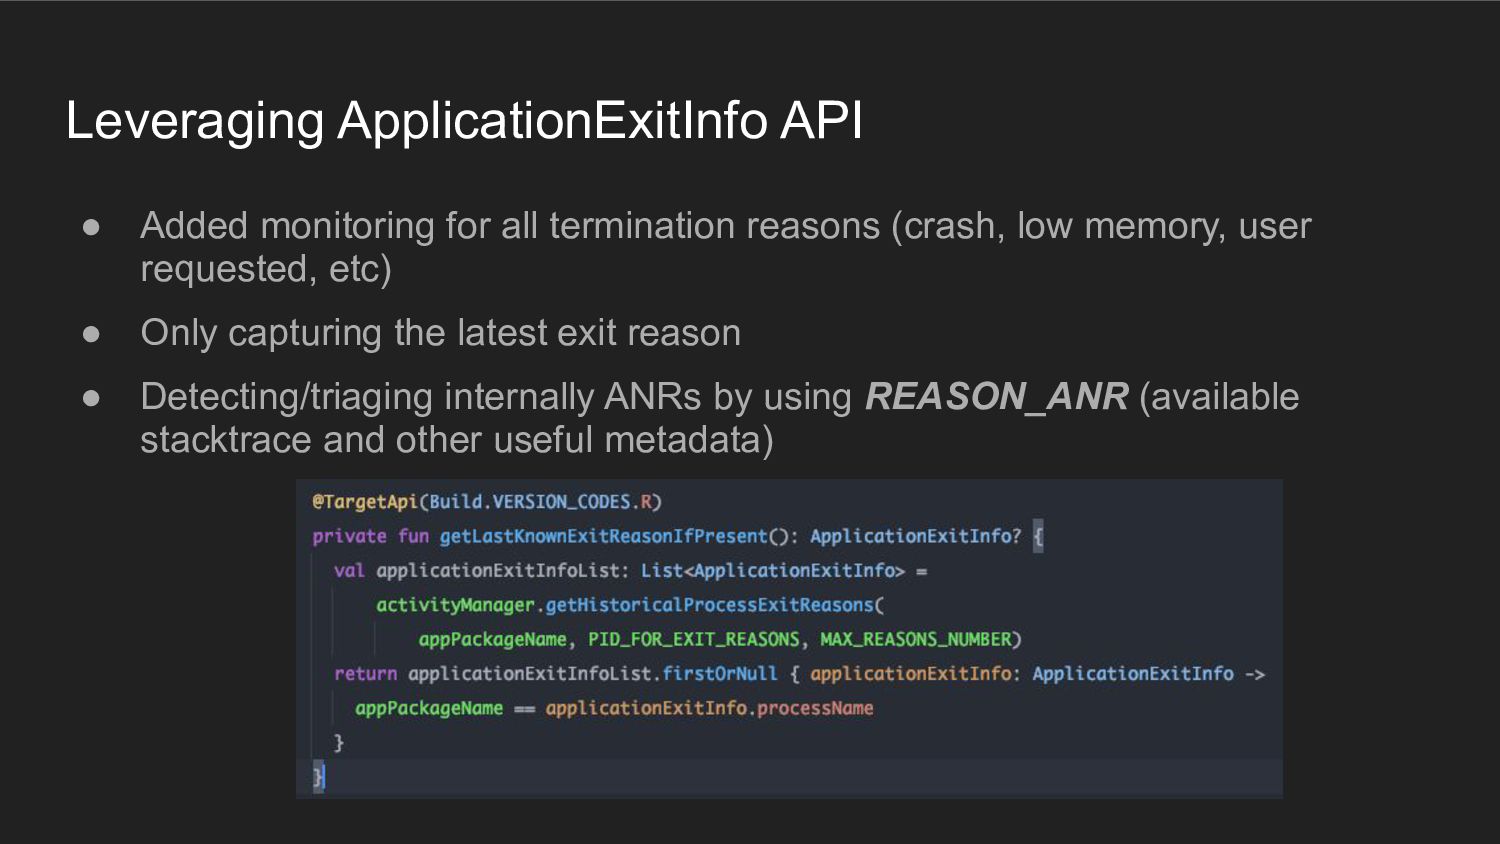
(crash, low memory, user requested, etc) • Only capturing the latest exit reason • Detecting/triaging internally ANRs by using REASON_ANR (available stacktrace and other useful metadata)
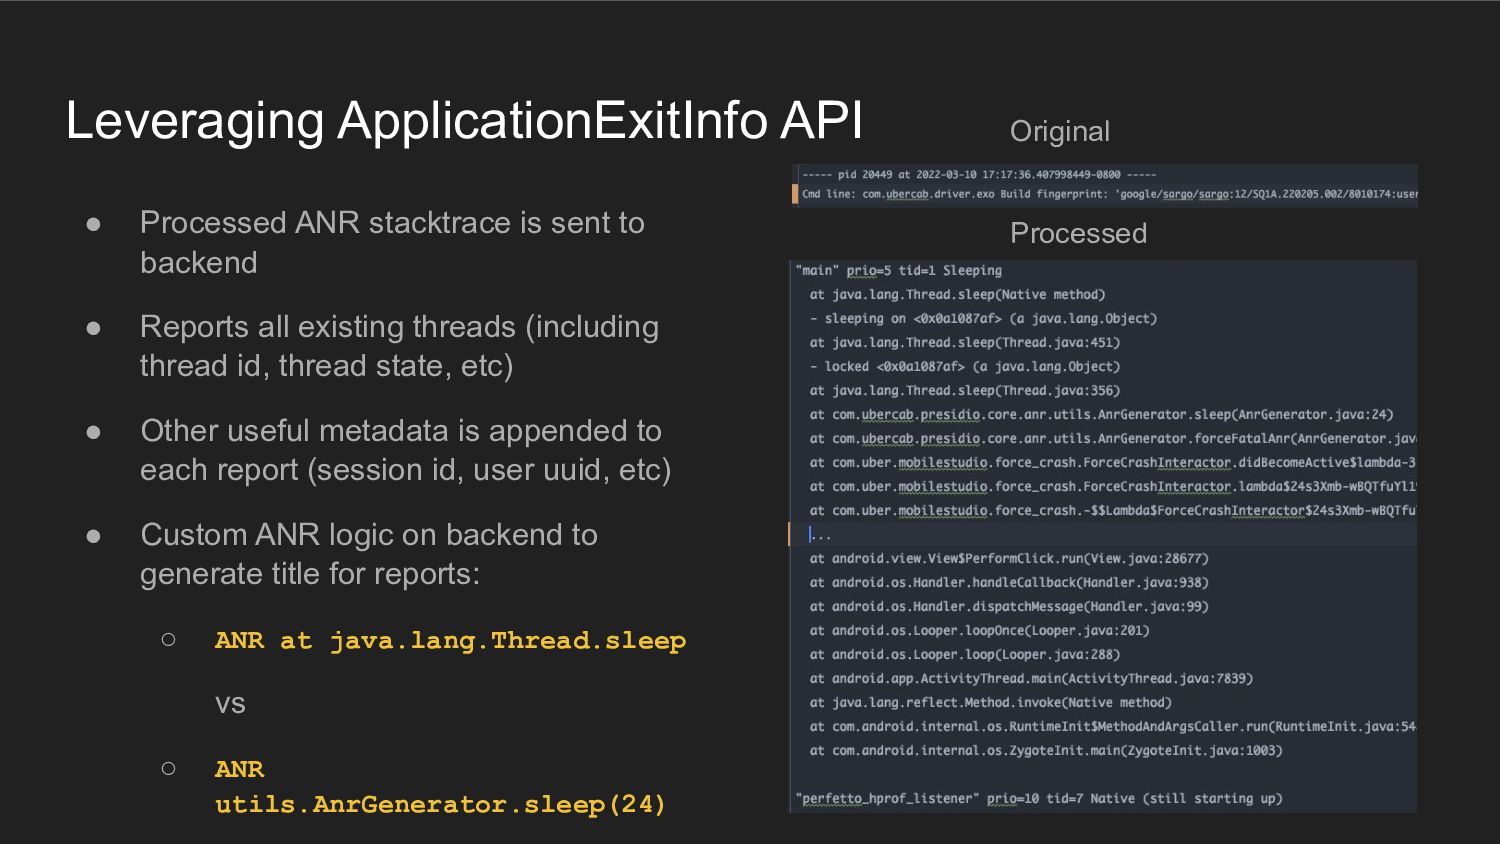
backend • Reports all existing threads (including thread id, thread state, etc) • Other useful metadata is appended to each report (session id, user uuid, etc) • Custom ANR logic on backend to generate title for reports: ◦ ANR at java.lang.Thread.sleep vs ◦ ANR utils.AnrGenerator.sleep(24) Original Processed
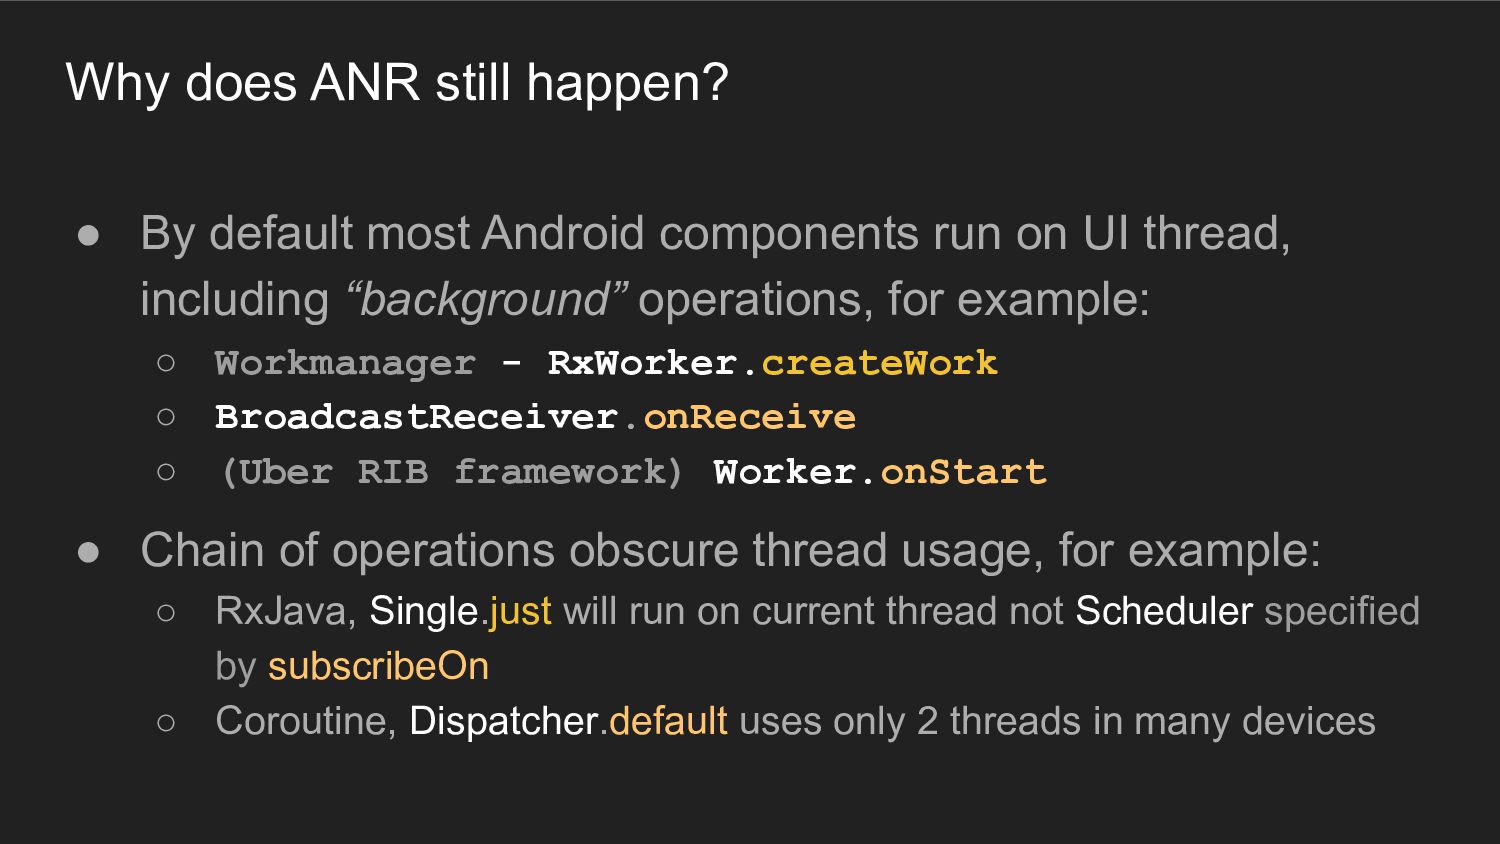
components run on UI thread, including “background” operations, for example: ◦ Workmanager - RxWorker.createWork ◦ BroadcastReceiver.onReceive ◦ (Uber RIB framework) Worker.onStart • Chain of operations obscure thread usage, for example: ◦ RxJava, Single.just will run on current thread not Scheduler specified by subscribeOn ◦ Coroutine, Dispatcher.default uses only 2 threads in many devices
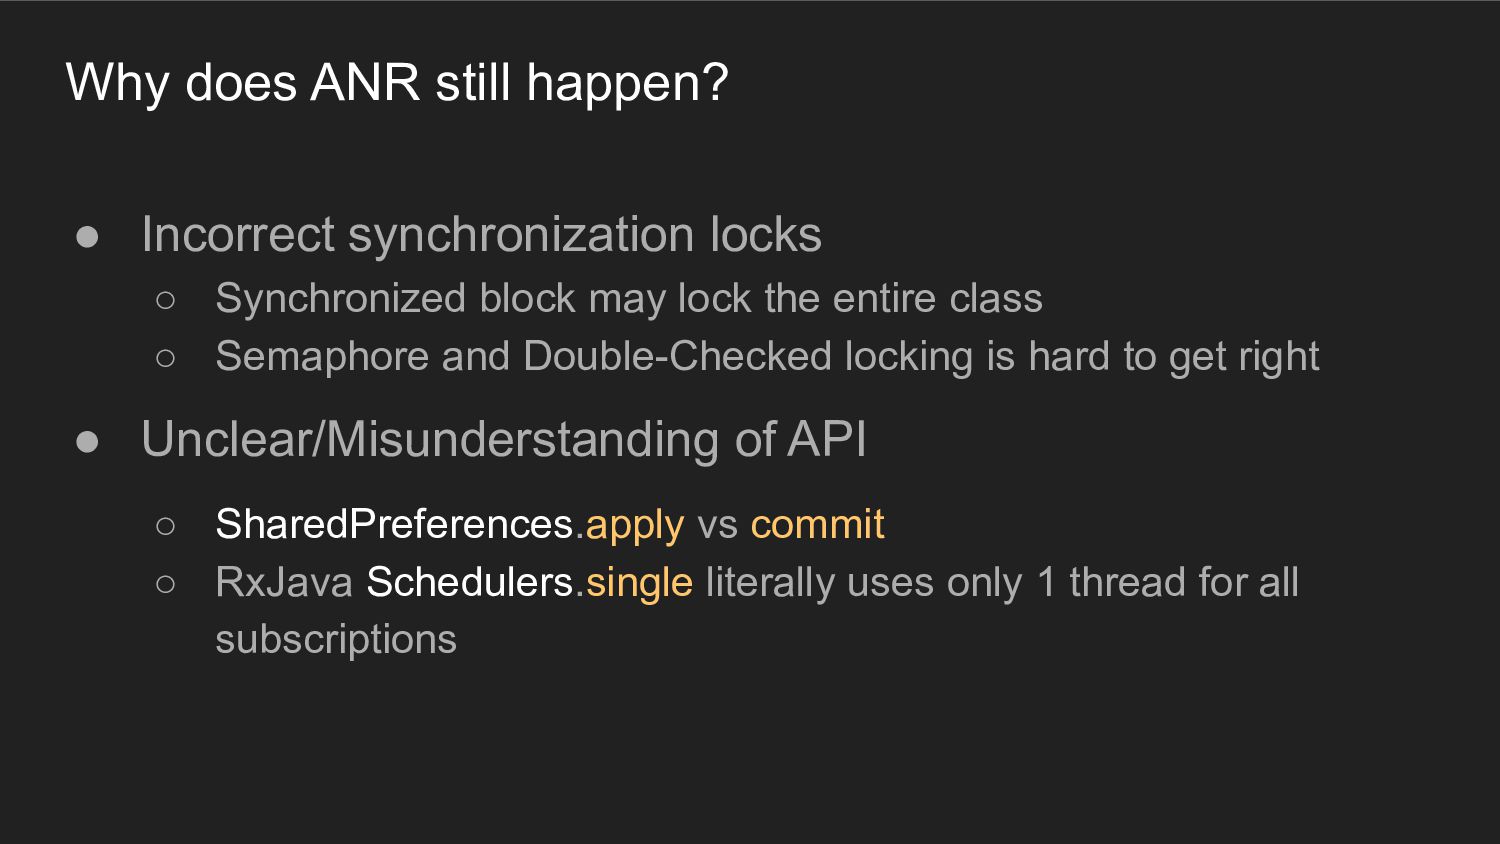
Synchronized block may lock the entire class ◦ Semaphore and Double-Checked locking is hard to get right • Unclear/Misunderstanding of API ◦ SharedPreferences.apply vs commit ◦ RxJava Schedulers.single literally uses only 1 thread for all subscriptions
defines bad behavior threshold as: ◦ Exhibits at least one ANR in at least 0.47% of its daily sessions. ◦ Exhibits 2 or more ANRs in at least 0.24% of its daily sessions. • Apps above this recommended threshold can have reduced visibility on play console. Source here • Treat ANR equal to Crash ◦ Set a goal for your team ◦ Fix as early as possible to avoid accumulation of tech debt
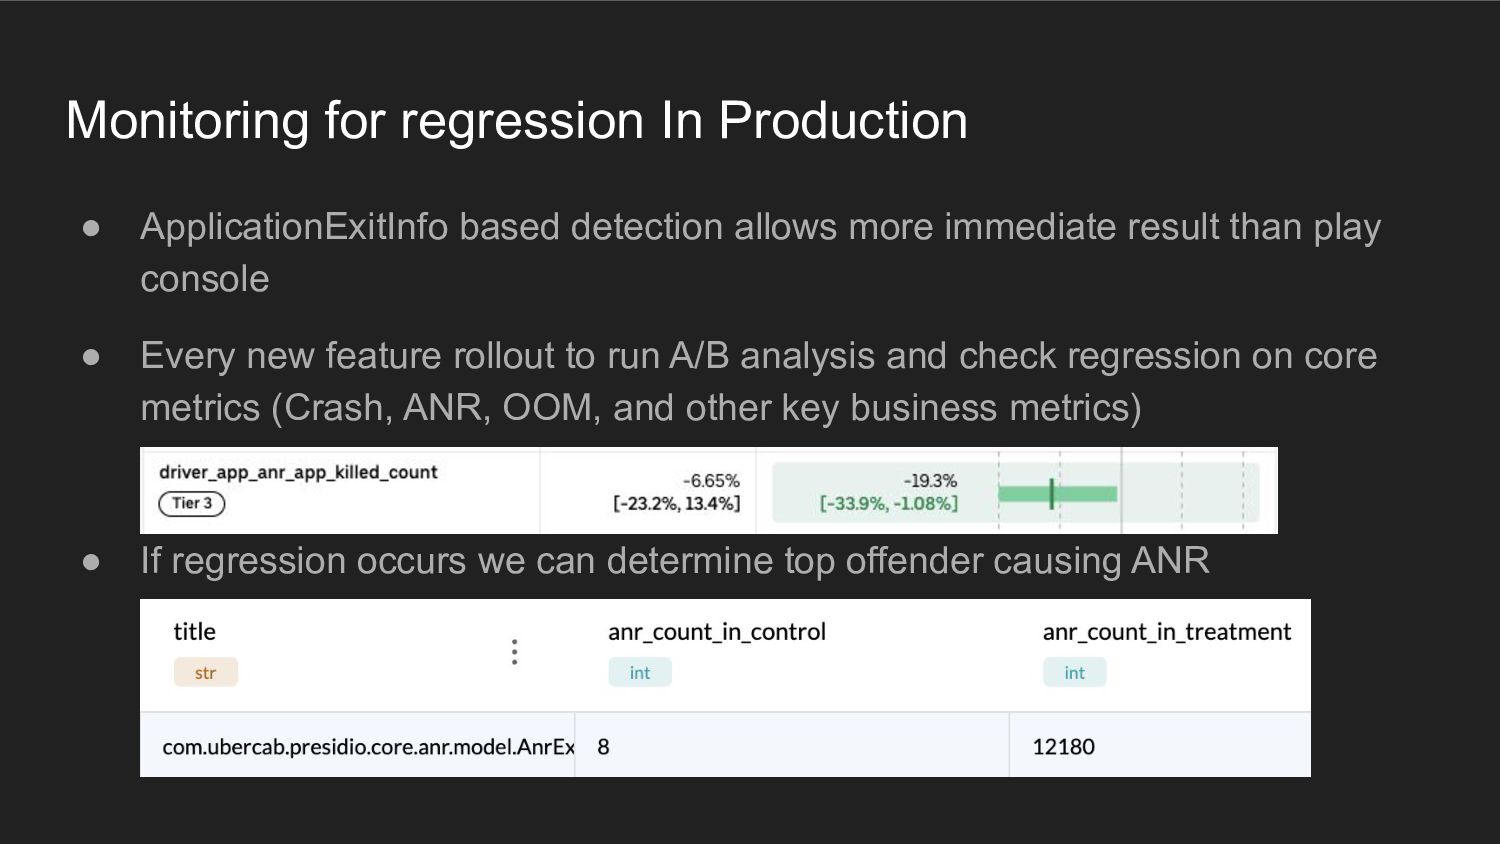
more immediate result than play console • Every new feature rollout to run A/B analysis and check regression on core metrics (Crash, ANR, OOM, and other key business metrics) • If regression occurs we can determine top offender causing ANR
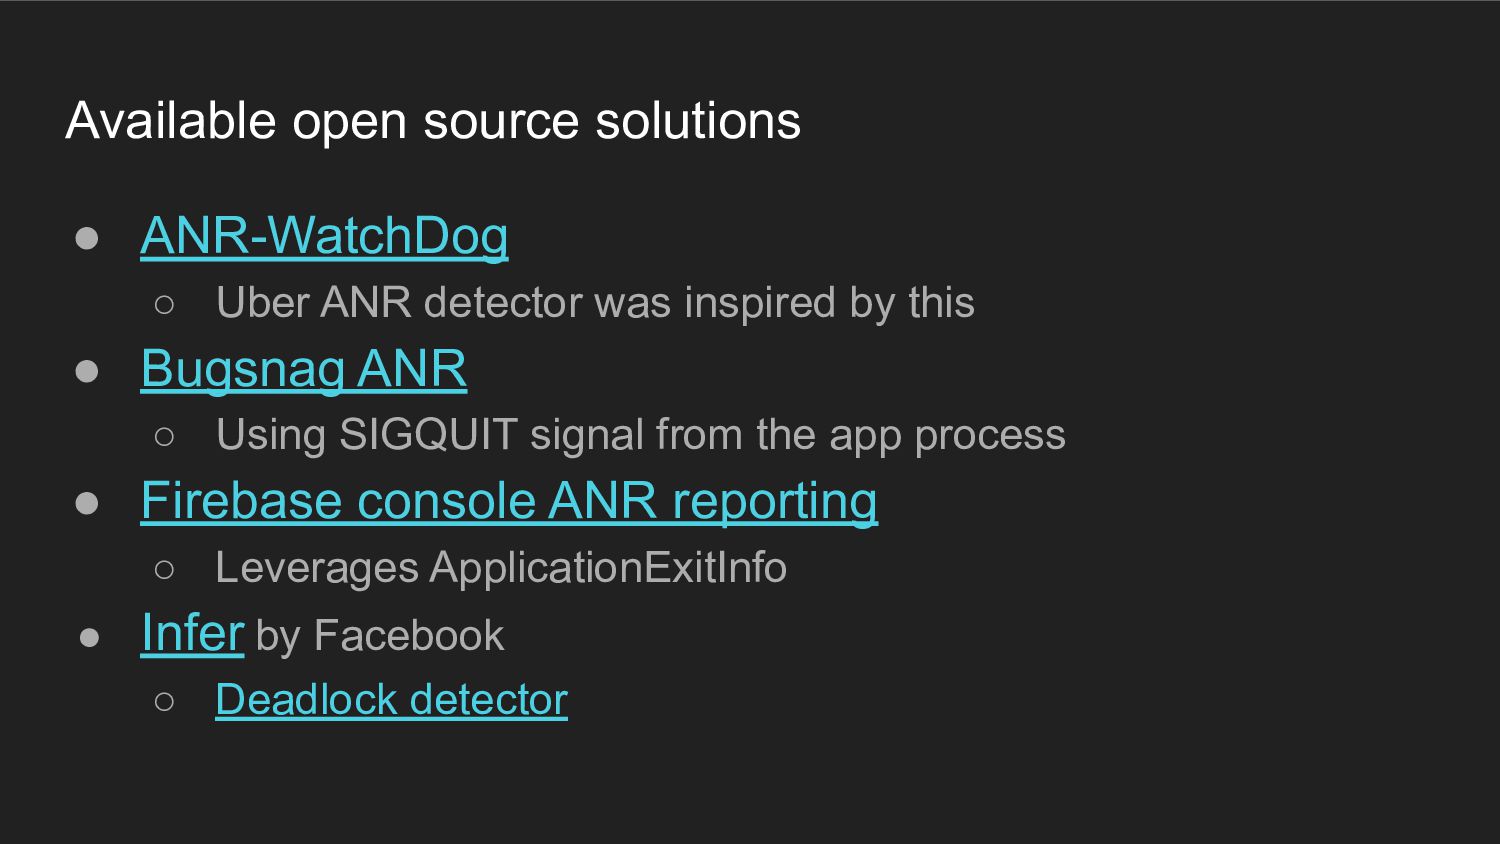
was inspired by this • Bugsnag ANR ◦ Using SIGQUIT signal from the app process • Firebase console ANR reporting ◦ Leverages ApplicationExitInfo • Infer by Facebook ◦ Deadlock detector