to color mixing and the visual effects of specific color combinations. ▪ Designers can use color theory to help them think about how color works on people, so that the artifacts they create are more effective.
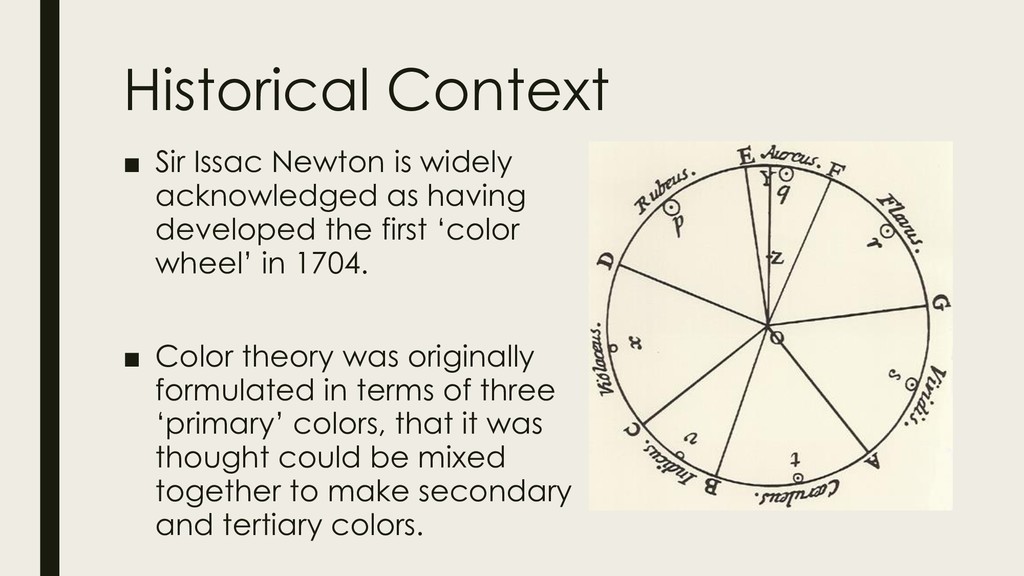
having developed the first ‘color wheel’ in 1704. ▪ Color theory was originally formulated in terms of three ‘primary’ colors, that it was thought could be mixed together to make secondary and tertiary colors.
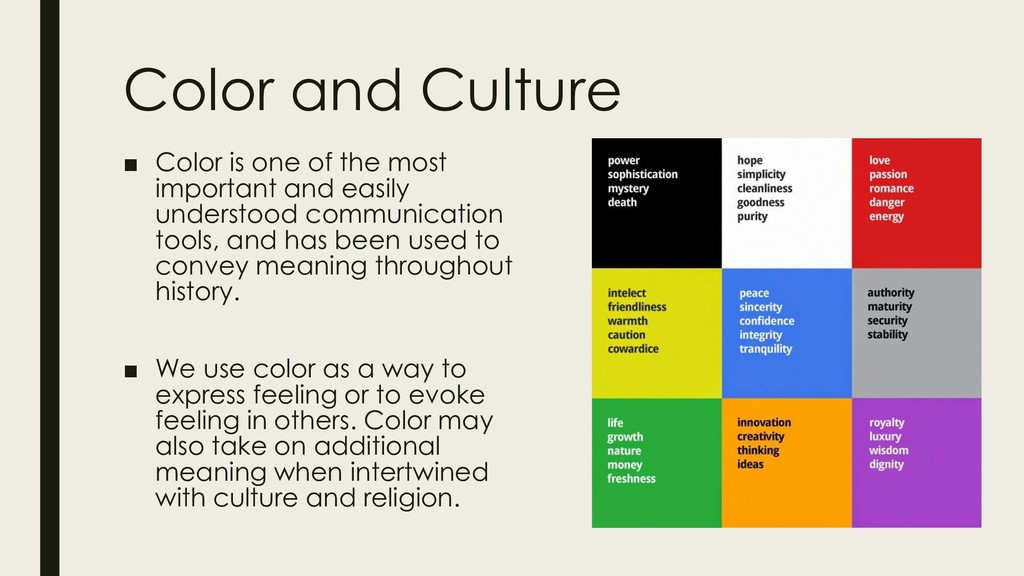
important and easily understood communication tools, and has been used to convey meaning throughout history. ▪ We use color as a way to express feeling or to evoke feeling in others. Color may also take on additional meaning when intertwined with culture and religion.
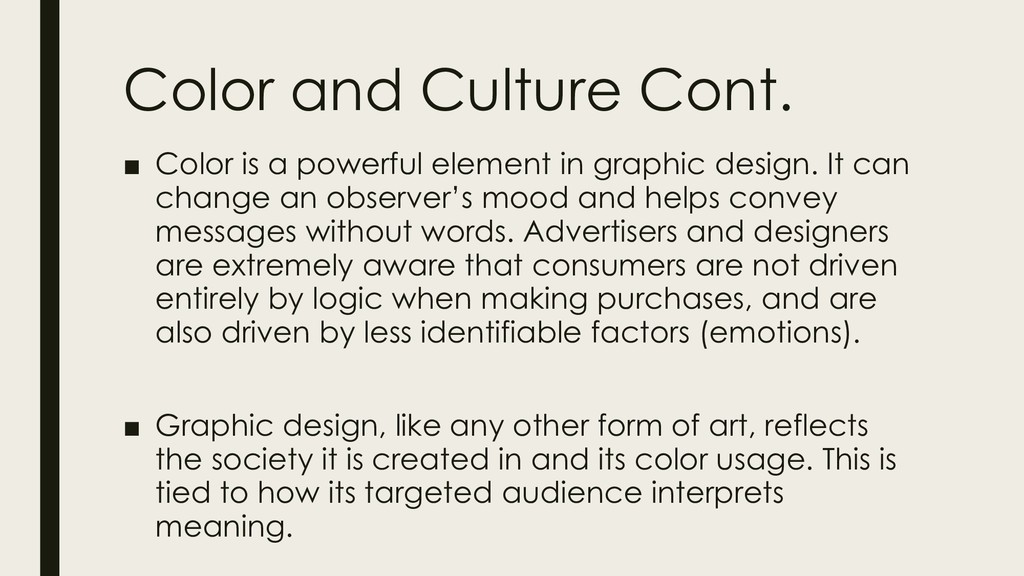
in graphic design. It can change an observer’s mood and helps convey messages without words. Advertisers and designers are extremely aware that consumers are not driven entirely by logic when making purchases, and are also driven by less identifiable factors (emotions). ▪ Graphic design, like any other form of art, reflects the society it is created in and its color usage. This is tied to how its targeted audience interprets meaning.
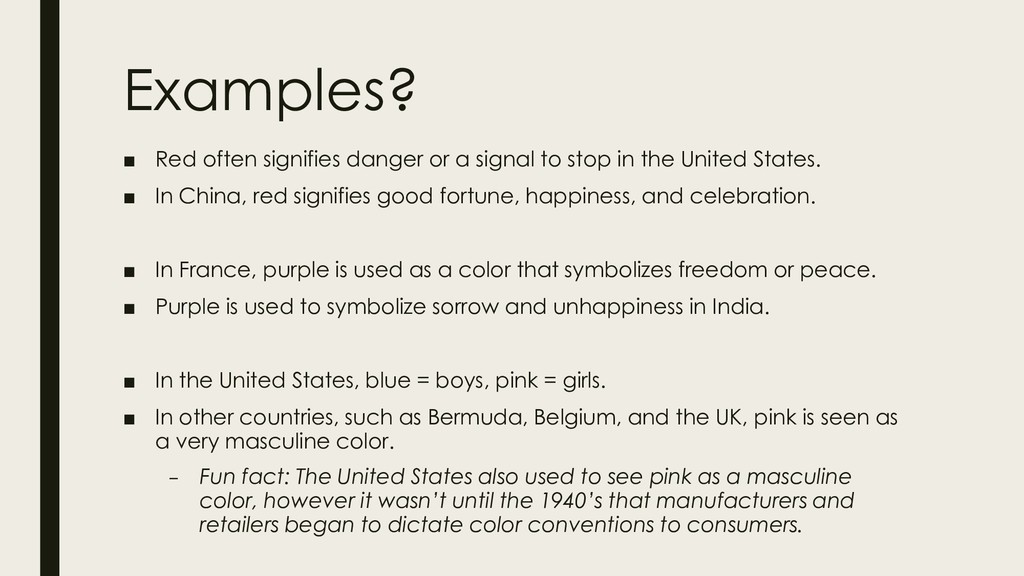
stop in the United States. ▪ In China, red signifies good fortune, happiness, and celebration. ▪ In France, purple is used as a color that symbolizes freedom or peace. ▪ Purple is used to symbolize sorrow and unhappiness in India. ▪ In the United States, blue = boys, pink = girls. ▪ In other countries, such as Bermuda, Belgium, and the UK, pink is seen as a very masculine color. – Fun fact: The United States also used to see pink as a masculine color, however it wasn’t until the 1940’s that manufacturers and retailers began to dictate color conventions to consumers.
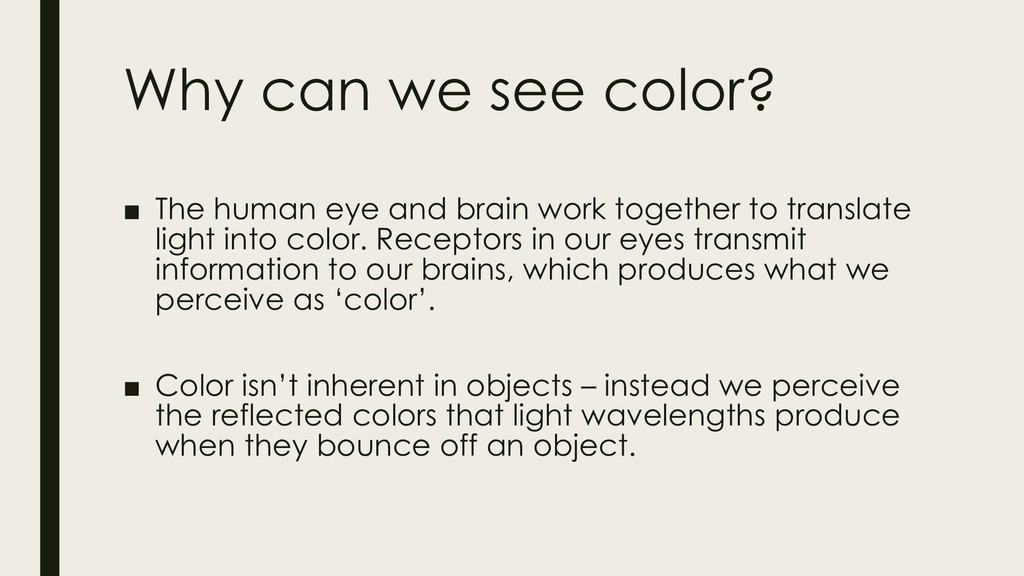
brain work together to translate light into color. Receptors in our eyes transmit information to our brains, which produces what we perceive as ‘color’. ▪ Color isn’t inherent in objects – instead we perceive the reflected colors that light wavelengths produce when they bounce off an object.
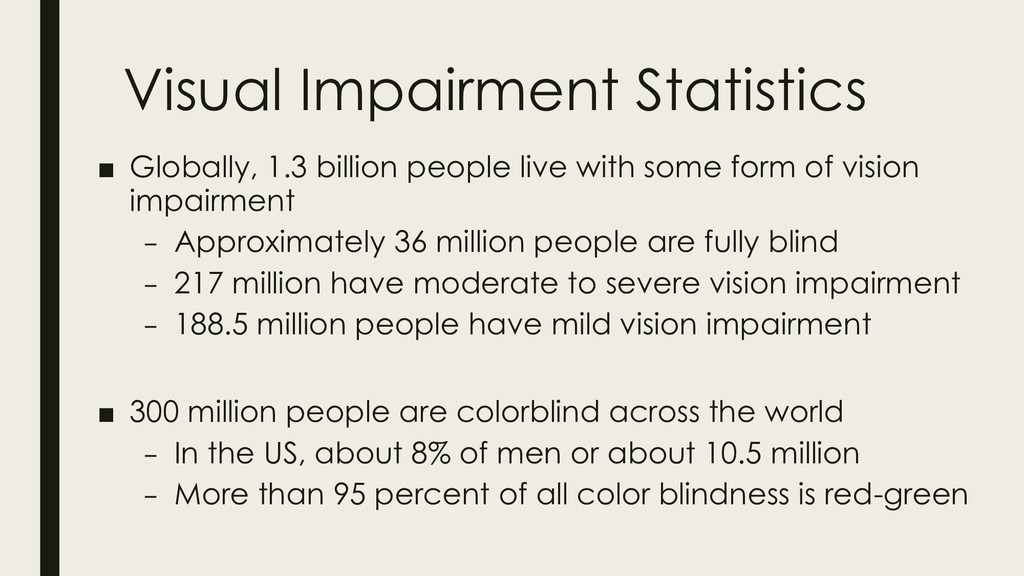
some form of vision impairment – Approximately 36 million people are fully blind – 217 million have moderate to severe vision impairment – 188.5 million people have mild vision impairment ▪ 300 million people are colorblind across the world – In the US, about 8% of men or about 10.5 million – More than 95 percent of all color blindness is red-green
can be a misleading term. ▪ Many people are actually color deficient, meaning that they see a reduced number of colors and may have a hard time distinguishing between similar shades of a color. ▪ Complete color blindness is called monochromacy, and people who suffer from this don’t experience color at all. Instead they see their world in shades of grey at varying levels of brightness.
‘correct color blindness’ are not intended for long-term use, and are not a complete solution to the problem. ▪ They are intended more for helping users identify colors at home or at a store. – Color blindness can be a challenging thing to live with – it can prevent you from obtaining certain jobs and some countries prevent people from driving or operating motor vehicles.
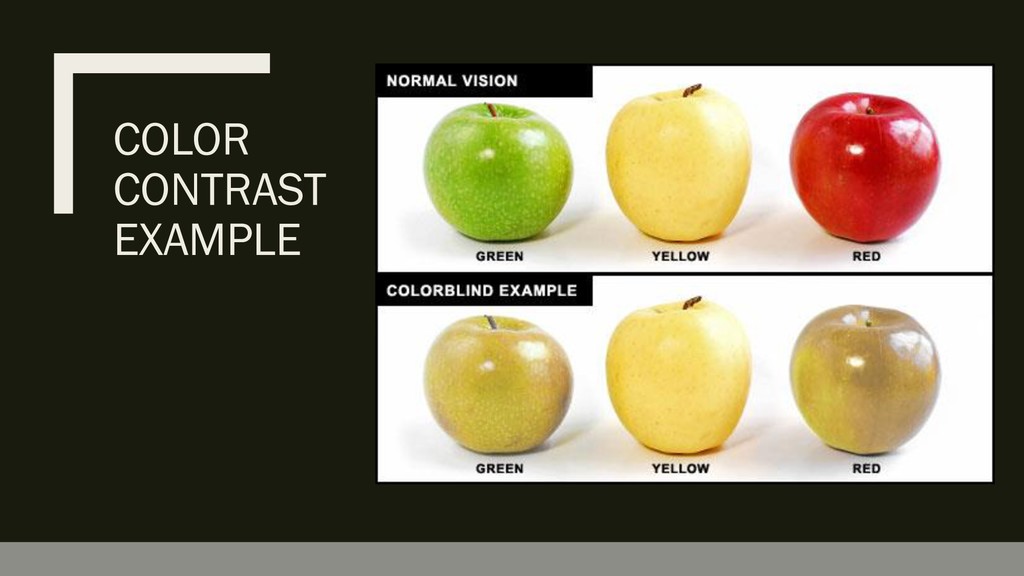
known as Protanomaly and Deuteranomaly ▪ Individuals with these color deficiencies have a reduced sensitivity to red and green light respectively. Thus, red and green will look similar. ▪ Blue-Yellow Color Blindness – Also known as Tritanomaly ▪ Individuals with this type of color deficiency have a reduced sensitivity to blue light. This means that yellow and blue look similar.
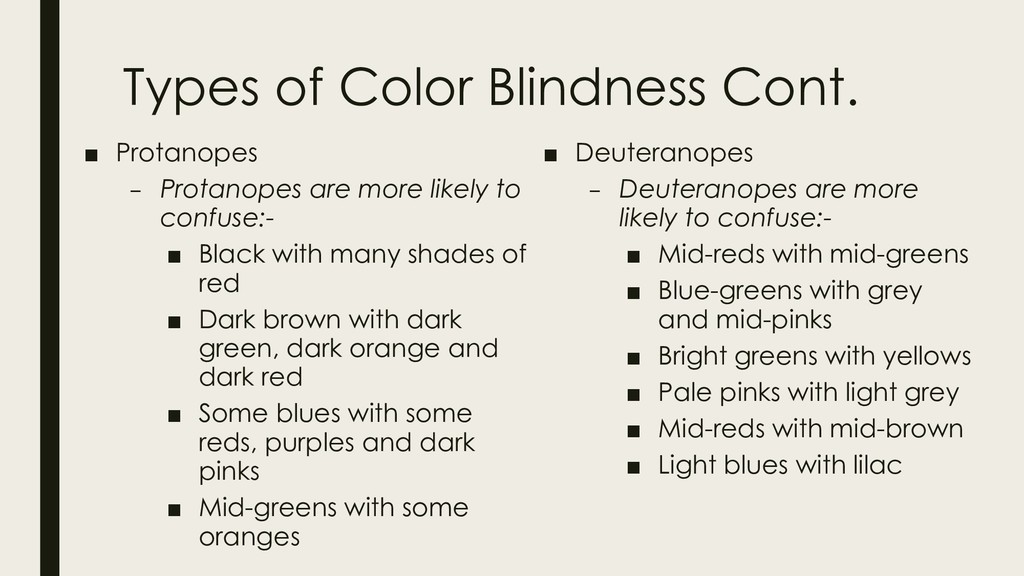
more likely to confuse:- ▪ Black with many shades of red ▪ Dark brown with dark green, dark orange and dark red ▪ Some blues with some reds, purples and dark pinks ▪ Mid-greens with some oranges ▪ Deuteranopes – Deuteranopes are more likely to confuse:- ▪ Mid-reds with mid-greens ▪ Blue-greens with grey and mid-pinks ▪ Bright greens with yellows ▪ Pale pinks with light grey ▪ Mid-reds with mid-brown ▪ Light blues with lilac
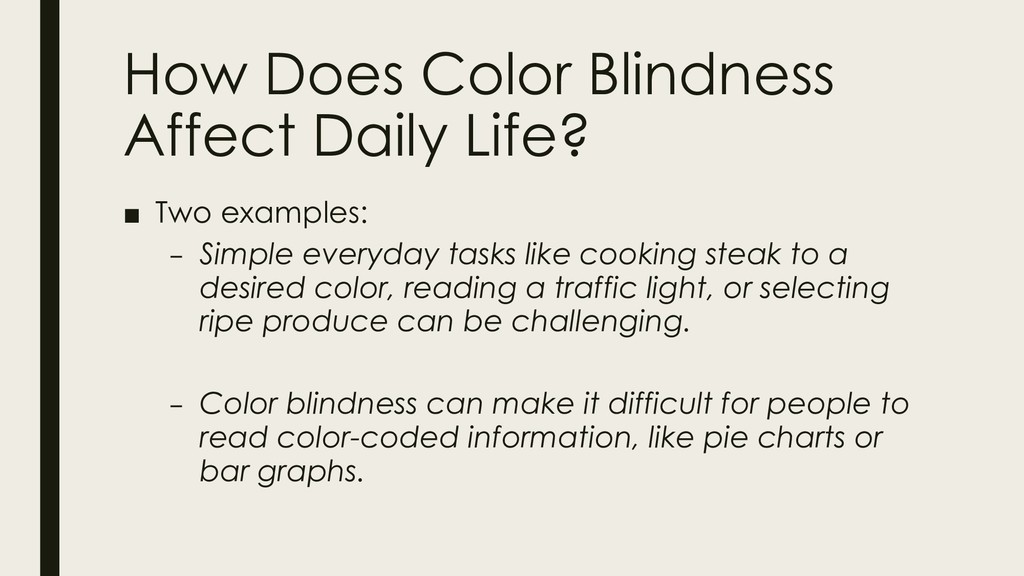
– Simple everyday tasks like cooking steak to a desired color, reading a traffic light, or selecting ripe produce can be challenging. – Color blindness can make it difficult for people to read color-coded information, like pie charts or bar graphs.
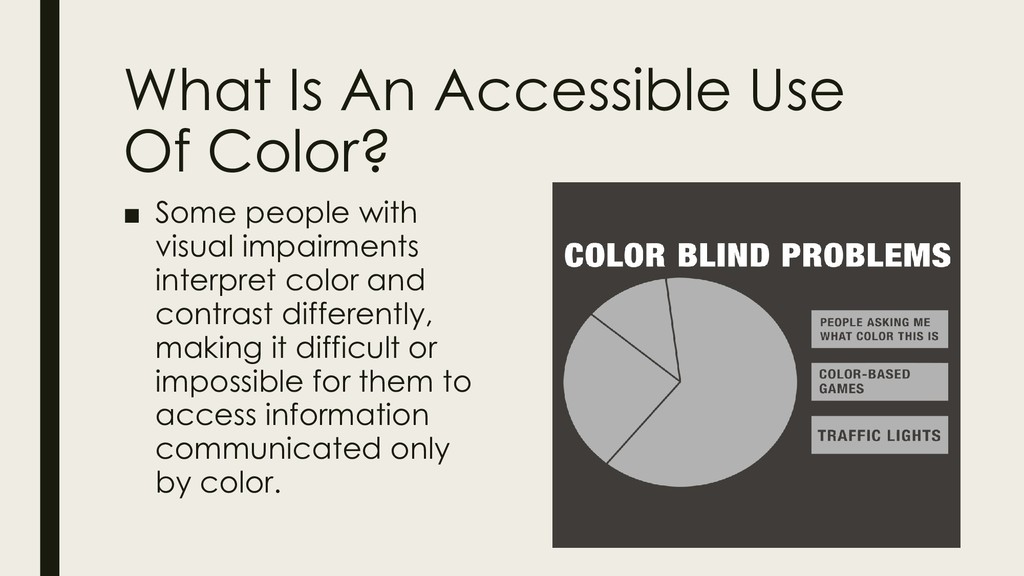
with visual impairments interpret color and contrast differently, making it difficult or impossible for them to access information communicated only by color.
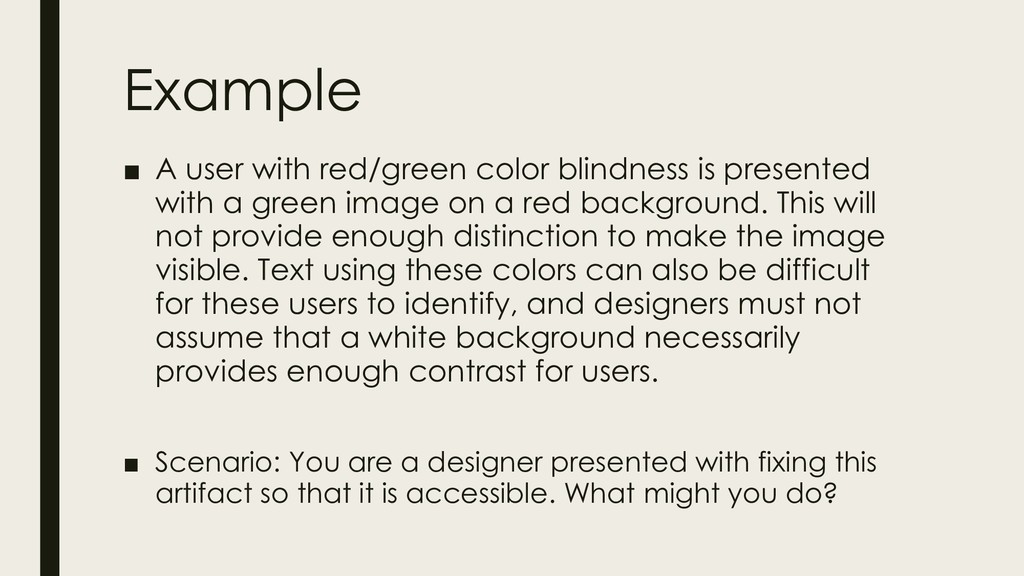
with a green image on a red background. This will not provide enough distinction to make the image visible. Text using these colors can also be difficult for these users to identify, and designers must not assume that a white background necessarily provides enough contrast for users. ▪ Scenario: You are a designer presented with fixing this artifact so that it is accessible. What might you do?
color choices, especially for important documents where graphs may be included. Don’t ever rely only on color to convey your meaning. – This has added benefit as you include the option for low- cost printing to your users, who may only be able to print in black and white. ▪ Check your contrast ratios, use the WCAG 2.0 standards for color contrast when making color palettes. ▪ Download Color Oracle for insight into what your projects may look like to someone who is color blind.


 ainischool
 matleenalaakso
 pawan_pharm
 frievea
 cbtlibrary
 akiraasano
 naochim2026
 drpoonamkc
 yatabe
 signer
 moriyuya
 nonsquared
 morganepeng
 bcantrill
 gurzu
 marktimemedia
 varn
 cargoodrich
 maltzj
 jlugia
 3n
 eileencodes
 reverentgeek