Paste it - Store it - Upgrade it - Share it - Git it - Convert it - Standard it - Generate it Text is awesome because you can do all of this quickly, easily, and while singing to Daft Punk.
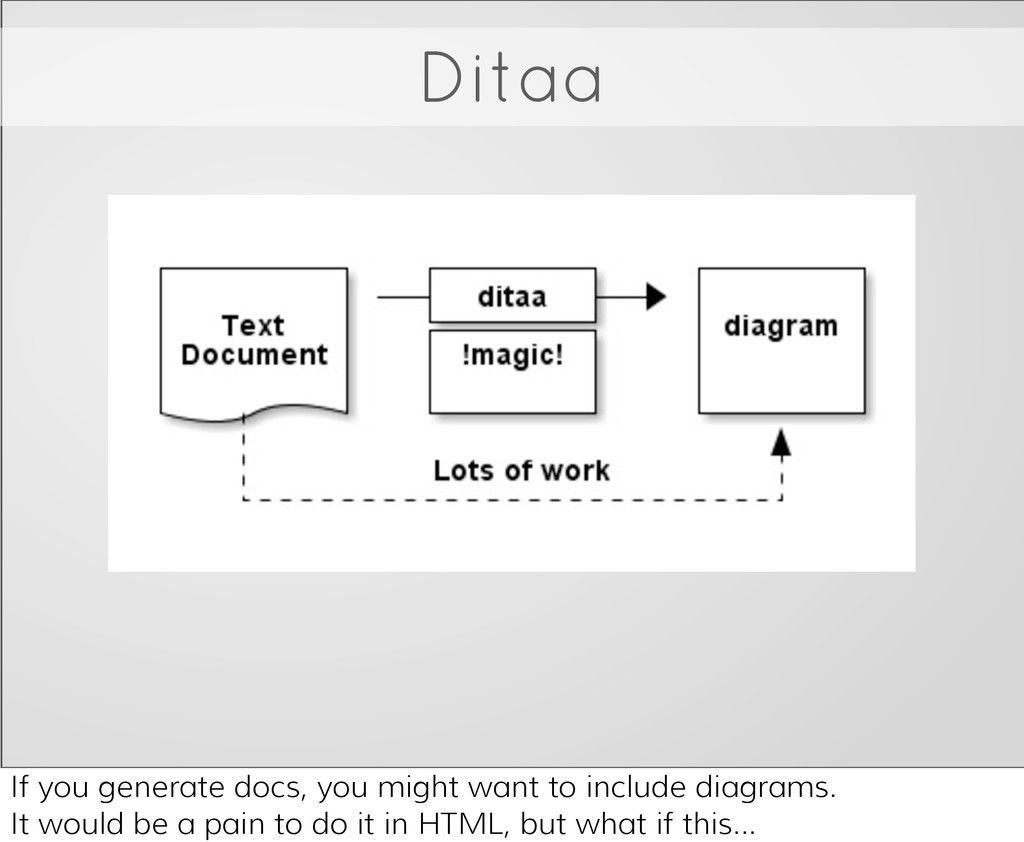
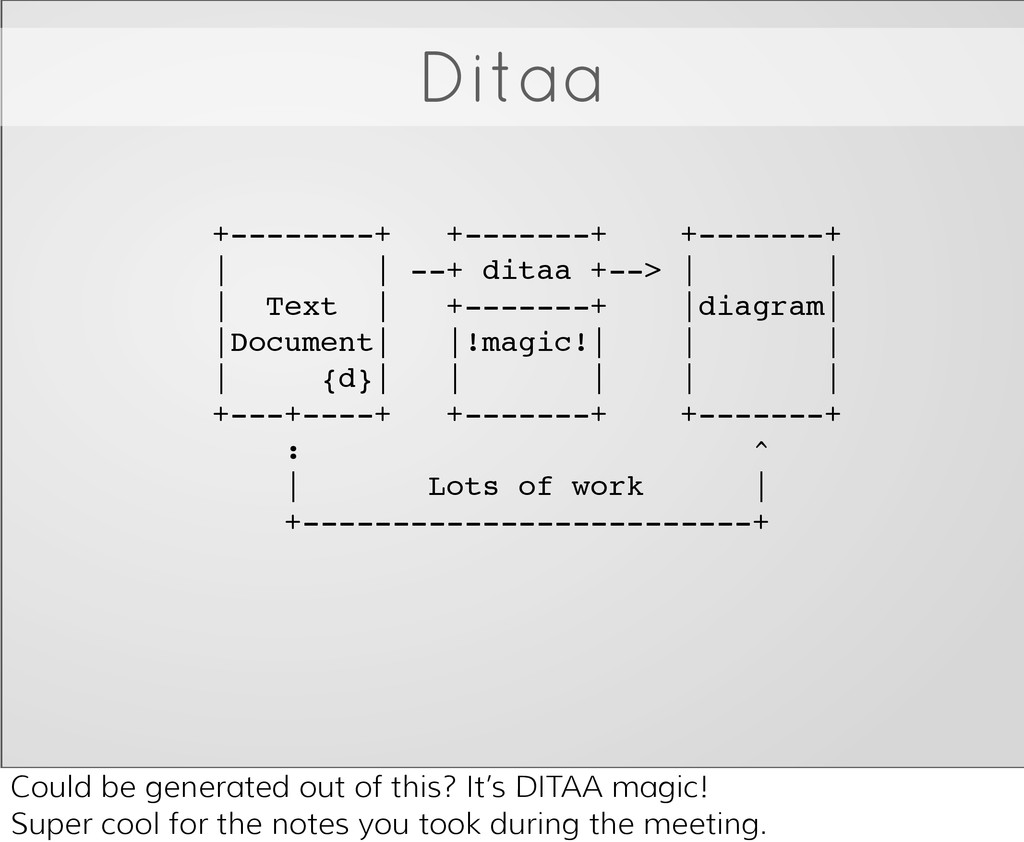
| | Text | +-------+ |diagram| |Document| |!magic!| | | | {d}| | | | | +---+----+ +-------+ +-------+ : ^ | Lots of work | +-------------------------+ Could be generated out of this? It’s DITAA magic! Super cool for the notes you took during the meeting.
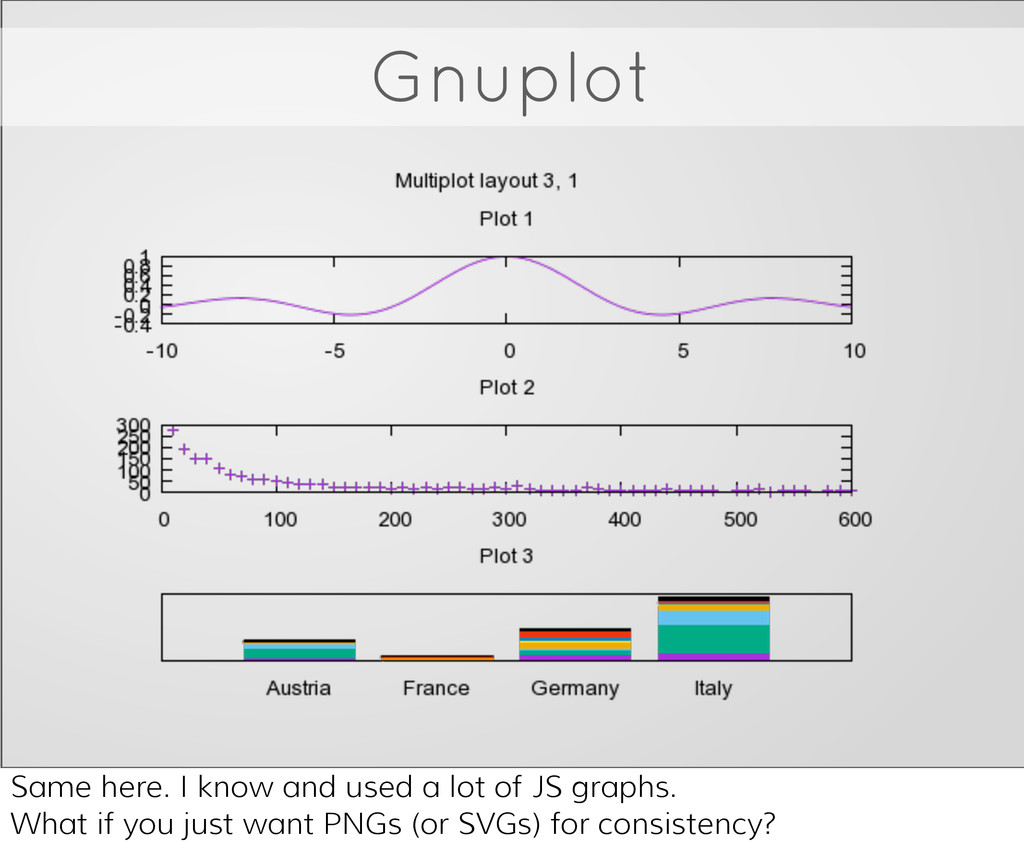
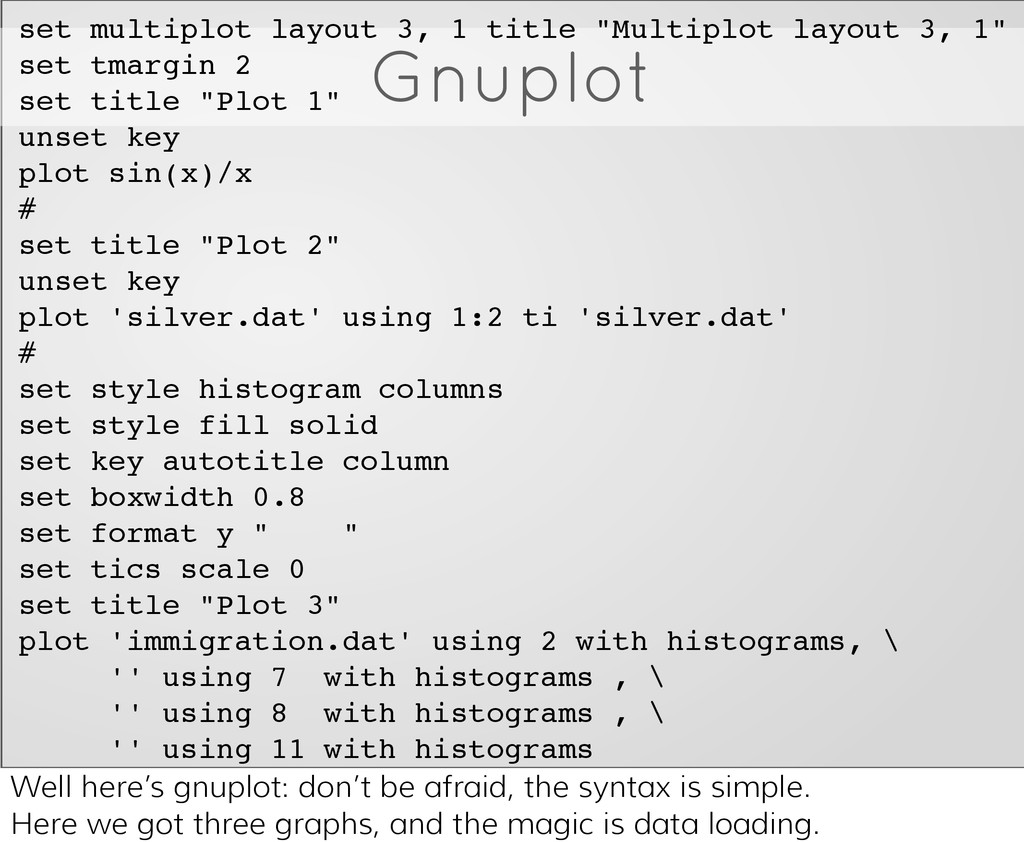
1" set tmargin 2 set title "Plot 1" unset key plot sin(x)/x # set title "Plot 2" unset key plot 'silver.dat' using 1:2 ti 'silver.dat' # set style histogram columns set style fill solid set key autotitle column set boxwidth 0.8 set format y " " set tics scale 0 set title "Plot 3" plot 'immigration.dat' using 2 with histograms, \ '' using 7 with histograms , \ '' using 8 with histograms , \ '' using 11 with histograms # unset multiplot Well here’s gnuplot: don’t be afraid, the syntax is simple. Here we got three graphs, and the magic is data loading.
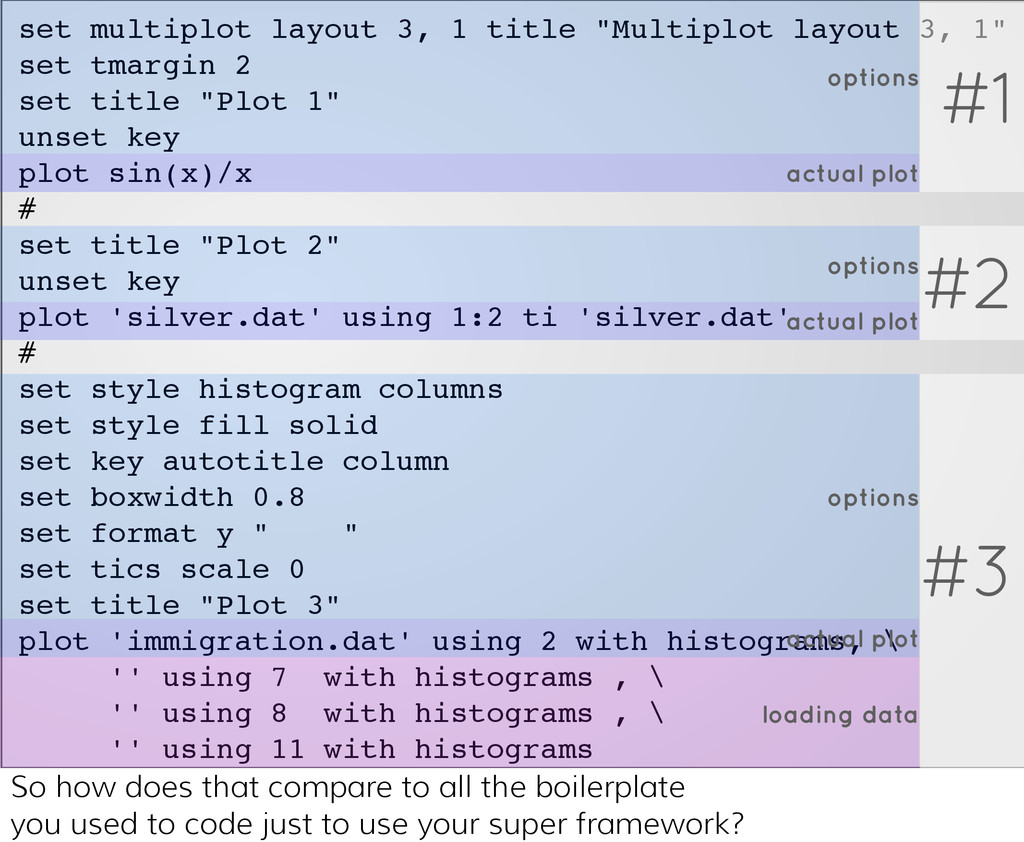
set tmargin 2 set title "Plot 1" unset key plot sin(x)/x # set title "Plot 2" unset key plot 'silver.dat' using 1:2 ti 'silver.dat' # set style histogram columns set style fill solid set key autotitle column set boxwidth 0.8 set format y " " set tics scale 0 set title "Plot 3" plot 'immigration.dat' using 2 with histograms, \ '' using 7 with histograms , \ '' using 8 with histograms , \ '' using 11 with histograms # unset multiplot #2 options actual plot #1 options actual plot #3 options actual plot loading data So how does that compare to all the boilerplate you used to code just to use your super framework?
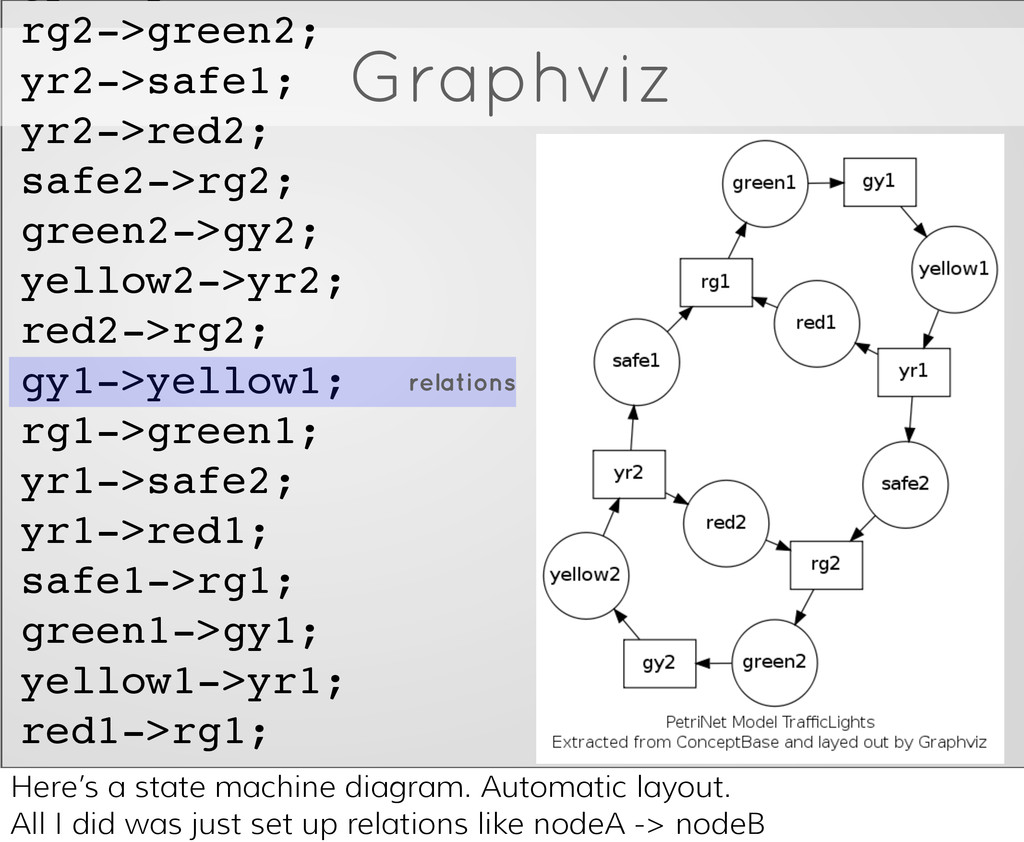
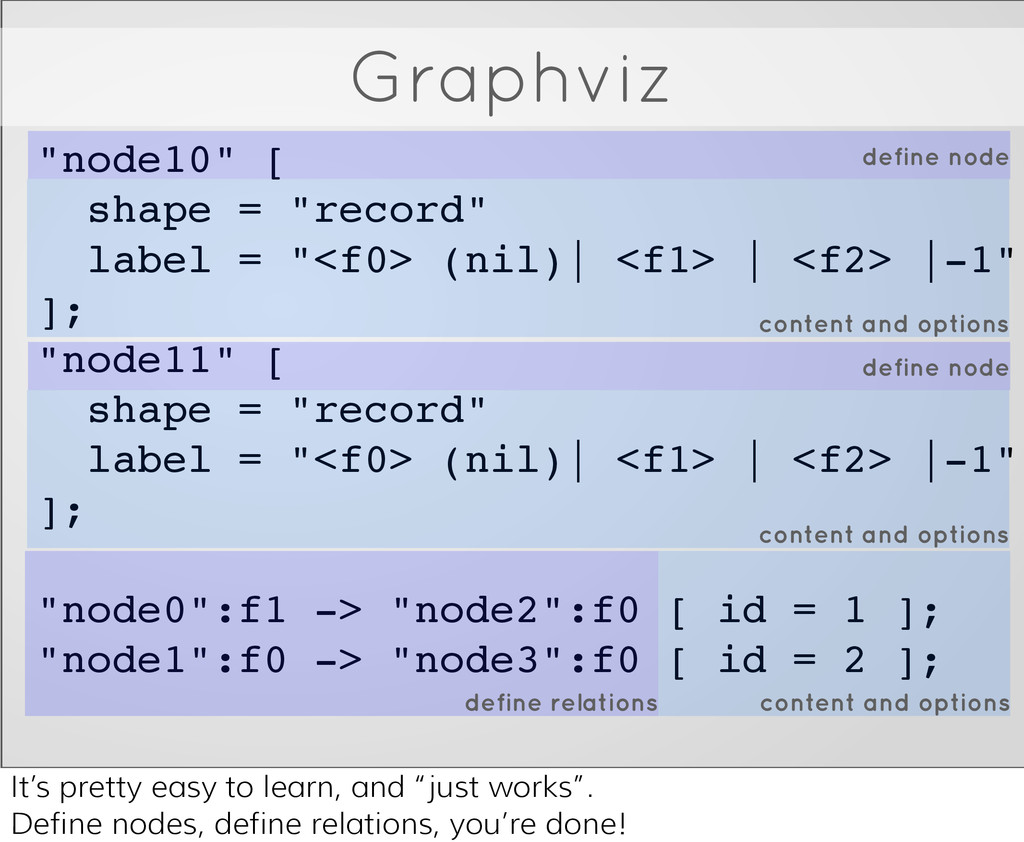
yr1->safe2; yr1->red1; safe1->rg1; green1->gy1; yellow1->yr1; red1->rg1; relations Here’s a state machine diagram. Automatic layout. All I did was just set up relations like nodeA -> nodeB
![\LaTeX \documentclass{minimal} \begin{document} \[\sum_{n=1}^{+\infty}\frac{1}{n^2}= \frac{\pi^2}{6}.\] \end{document} LaTeX is like a](https://files.speakerdeck.com/presentations/d3284c40e4010131e3ad6ac4dbaea8fd/slide_4.jpg)