"Stingray: Time series methods for asronomical X-ray data that aren't fishy at all!"
A presentation at the Python in Astronomy 2016 workshop in Seattle.
Vary on timescales from tens of microseconds to months/years X-ray pulsations, zoology of quasi-periodic oscillations, broadband “peaked” noise Similar variability phenomena in gamma, optical, IR Figure: NASA
3.4 3.3 3.2 3.1 3.0 2.9 2.8 2.7 2.6 2.5 2.4 2.3 2.2 2.1 2.0 1.9 1.8 1.7 100 10 1 2.4 2.2 2.0 1.8 1.6 1.4 1.2 1.0 0.8 0.6 0.4 0.2 Fourier frequency f [Hz] 2.1–15 keV PSD ×f [rms2 × 102] IGR J17480 2446 GX 17+2 4U 1728 34 Frequency x (RMS/Mean) Hz 2 −1 Frequency x (RMS/Mean) Hz 2 −1 Frequency x (RMS/Mean) Hz 2 −1 L b L b L b L h L hHz Frequency (Hz) kHz QPOs kHz QPO kHz QPO HBO HBO Figures: Grinberg et al ‘14, Done et al ‘07, Altamirano et al ‘12
Count/sec Time (s) Start Time 10168 18:16:52:570 Stop Time 10168 18:17:08:180 Bin time: 0.1562E−01 s Time domain Light curve Frequency domain Power spectrum FOURIER TRANSFORM
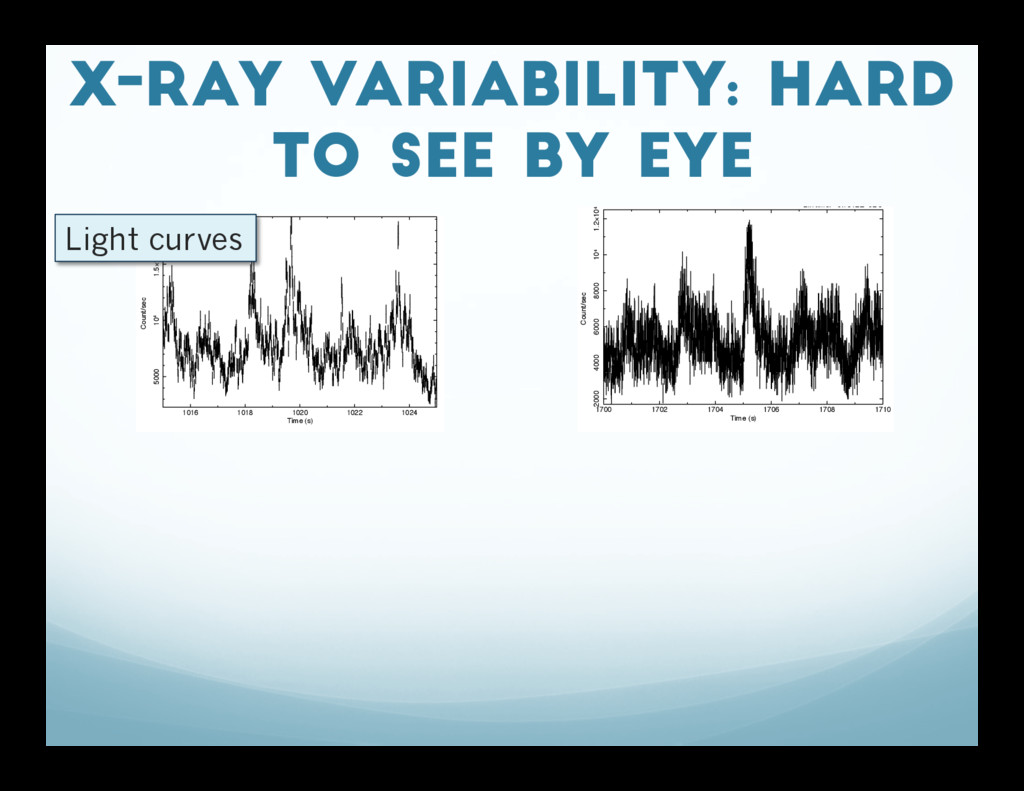
1022 1024 5000 104 1.5×10⁴ Count/sec Time (s) Start Time 10168 18:16:52:570 Stop Time 10168 18:17:08:180 Bin time: 0.1562E−01 s 1700 1702 1704 1706 1708 1710 2000 4000 6000 8000 104 1.2×10⁴ Count/sec Time (s) Start Time 12339 7:28:14:566 Stop Time 12339 7:29:32:683 Bin time: 0.7812E−02 s Light curves
1022 1024 5000 104 1.5×10⁴ Count/sec Time (s) Start Time 10168 18:16:52:570 Stop Time 10168 18:17:08:180 Bin time: 0.1562E−01 s 1700 1702 1704 1706 1708 1710 2000 4000 6000 8000 104 1.2×10⁴ Count/sec Time (s) Start Time 12339 7:28:14:566 Stop Time 12339 7:29:32:683 Bin time: 0.7812E−02 s Light curves Power spectra
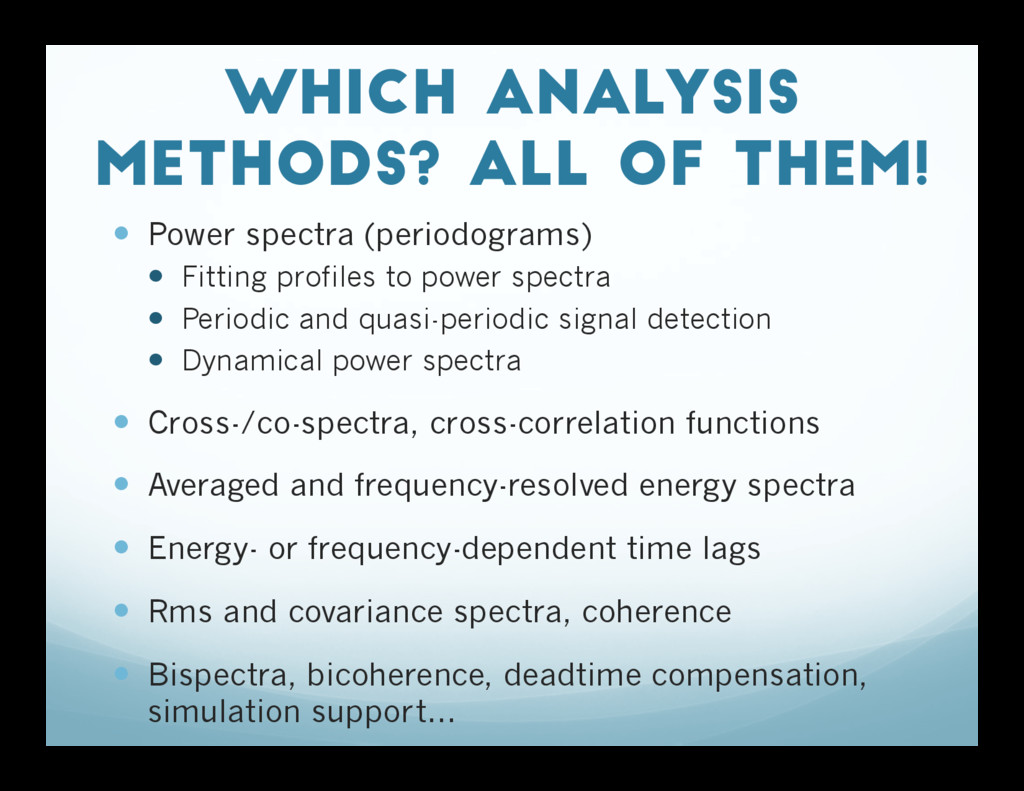
Fitting profiles to power spectra Periodic and quasi-periodic signal detection Dynamical power spectra Cross-/co-spectra, cross-correlation functions Averaged and frequency-resolved energy spectra Energy- or frequency-dependent time lags Rms and covariance spectra, coherence Bispectra, bicoherence, deadtime compensation, simulation support…
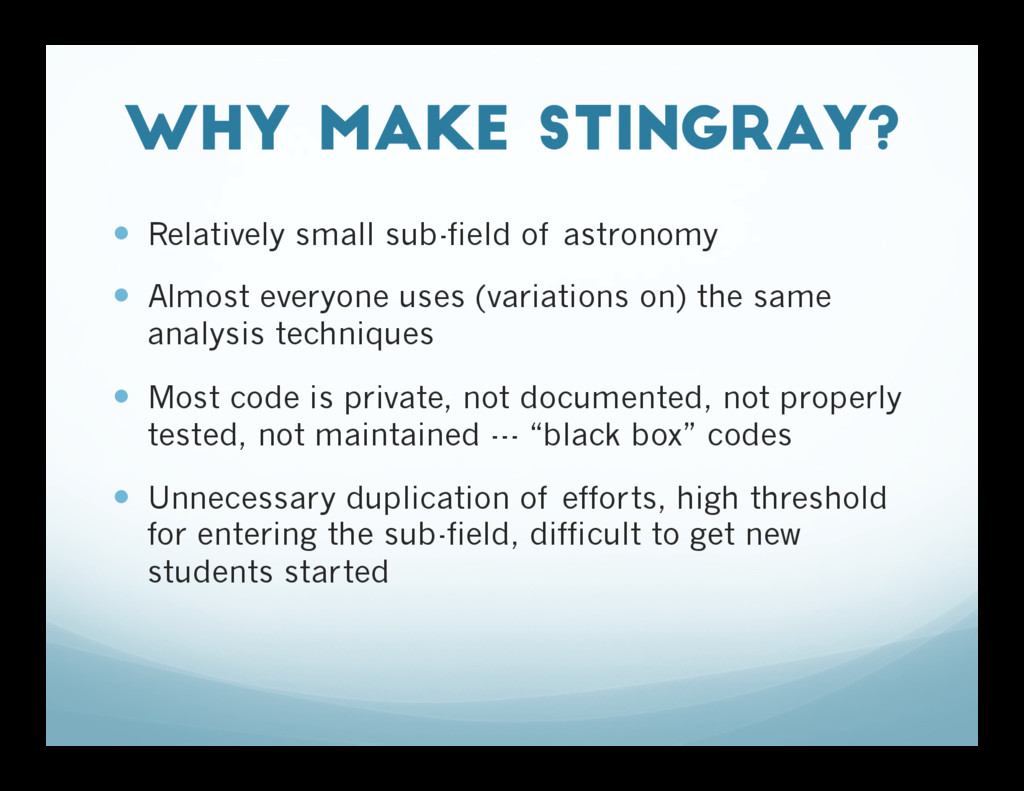
Almost everyone uses (variations on) the same analysis techniques Most code is private, not documented, not properly tested, not maintained --- “black box” codes Unnecessary duplication of efforts, high threshold for entering the sub-field, difficult to get new students started
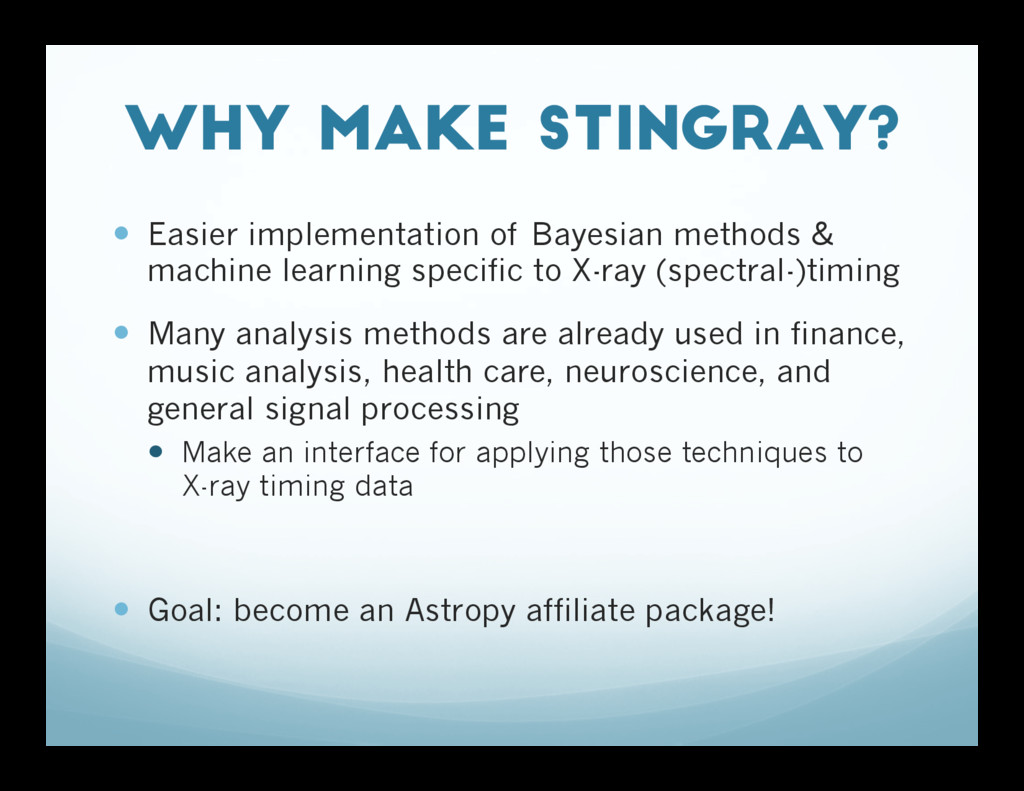
machine learning specific to X-ray (spectral-)timing Many analysis methods are already used in finance, music analysis, health care, neuroscience, and general signal processing Make an interface for applying those techniques to X-ray timing data Goal: become an Astropy affiliate package!
exploratory data analysis Part of the Google Summer of Code! Likely support from HEASARC for developing data structures and I/O interface with existing & future missions Potential for interfacing with astropy.modeling and/ or Sherpa spectral fitting package, especially for cross-spectral models YOU CAN HELP! Extending to IR, optical fast variability (spectral-)timing?