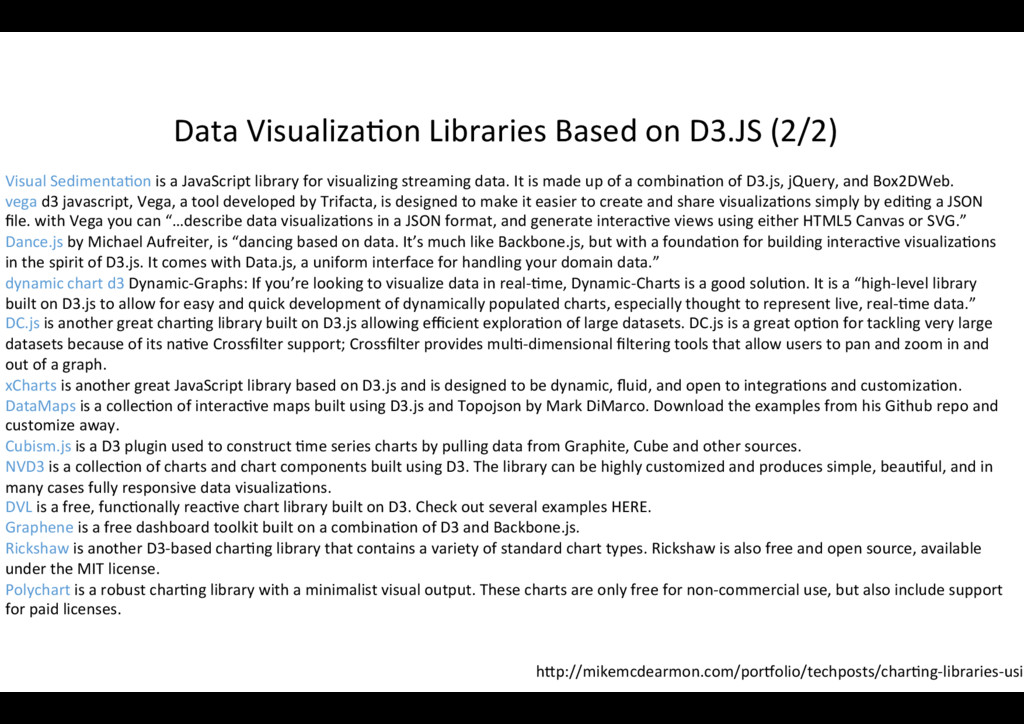
a JavaScript library for visualizing streaming data. It is made up of a combina?on of D3.js, jQuery, and Box2DWeb. vega d3 javascript, Vega, a tool developed by Trifacta, is designed to make it easier to create and share visualiza?ons simply by edi?ng a JSON file. with Vega you can “…describe data visualiza?ons in a JSON format, and generate interac?ve views using either HTML5 Canvas or SVG.” Dance.js by Michael Aufreiter, is “dancing based on data. It’s much like Backbone.js, but with a founda?on for building interac?ve visualiza?ons in the spirit of D3.js. It comes with Data.js, a uniform interface for handling your domain data.” dynamic chart d3 Dynamic-Graphs: If you’re looking to visualize data in real-?me, Dynamic-Charts is a good solu?on. It is a “high-level library built on D3.js to allow for easy and quick development of dynamically populated charts, especially thought to represent live, real-?me data.” DC.js is another great char?ng library built on D3.js allowing efficient explora?on of large datasets. DC.js is a great op?on for tackling very large datasets because of its na?ve Crossfilter support; Crossfilter provides mul?-dimensional filtering tools that allow users to pan and zoom in and out of a graph. xCharts is another great JavaScript library based on D3.js and is designed to be dynamic, fluid, and open to integra?ons and customiza?on. DataMaps is a collec?on of interac?ve maps built using D3.js and Topojson by Mark DiMarco. Download the examples from his Github repo and customize away. Cubism.js is a D3 plugin used to construct ?me series charts by pulling data from Graphite, Cube and other sources. NVD3 is a collec?on of charts and chart components built using D3. The library can be highly customized and produces simple, beau?ful, and in many cases fully responsive data visualiza?ons. DVL is a free, func?onally reac?ve chart library built on D3. Check out several examples HERE. Graphene is a free dashboard toolkit built on a combina?on of D3 and Backbone.js. Rickshaw is another D3-based char?ng library that contains a variety of standard chart types. Rickshaw is also free and open source, available under the MIT license. Polychart is a robust char?ng library with a minimalist visual output. These charts are only free for non-commercial use, but also include support for paid licenses. h4p://mikemcdearmon.com/porrolio/techposts/char?ng-libraries-usin
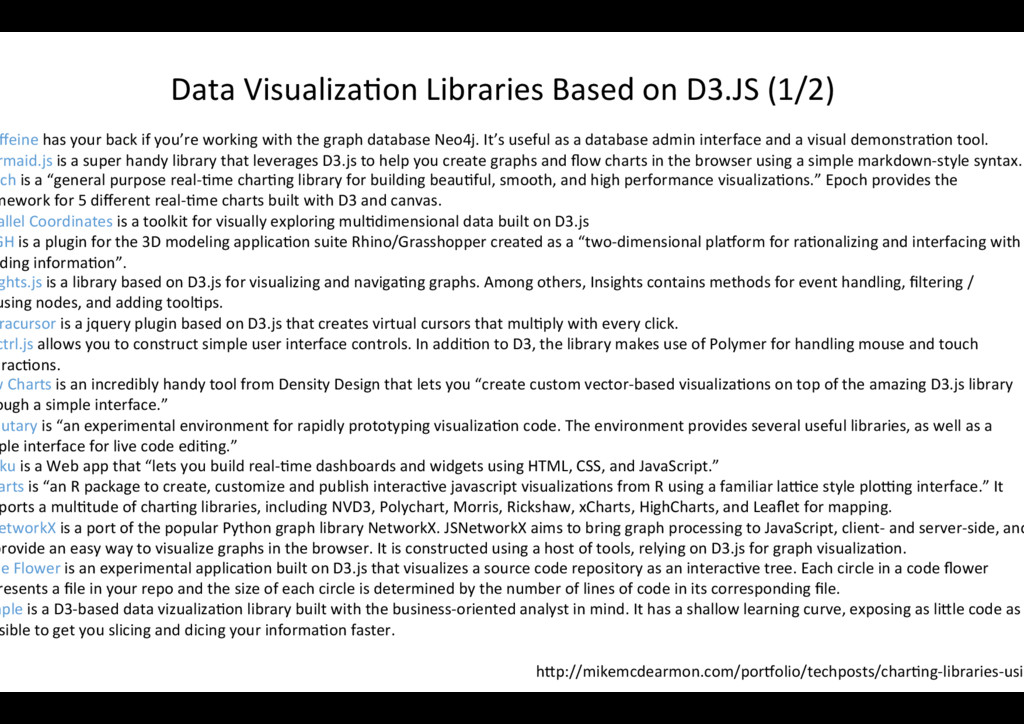
your back if you’re working with the graph database Neo4j. It’s useful as a database admin interface and a visual demonstra?on tool. rmaid.js is a super handy library that leverages D3.js to help you create graphs and flow charts in the browser using a simple markdown-style syntax. och is a “general purpose real-?me char?ng library for building beau?ful, smooth, and high performance visualiza?ons.” Epoch provides the mework for 5 different real-?me charts built with D3 and canvas. allel Coordinates is a toolkit for visually exploring mul?dimensional data built on D3.js GH is a plugin for the 3D modeling applica?on suite Rhino/Grasshopper created as a “two-dimensional plarorm for ra?onalizing and interfacing with ding informa?on”. ghts.js is a library based on D3.js for visualizing and naviga?ng graphs. Among others, Insights contains methods for event handling, filtering / using nodes, and adding tool?ps. racursor is a jquery plugin based on D3.js that creates virtual cursors that mul?ply with every click. ctrl.js allows you to construct simple user interface controls. In addi?on to D3, the library makes use of Polymer for handling mouse and touch erac?ons. w Charts is an incredibly handy tool from Density Design that lets you “create custom vector-based visualiza?ons on top of the amazing D3.js library ough a simple interface.” butary is “an experimental environment for rapidly prototyping visualiza?on code. The environment provides several useful libraries, as well as a ple interface for live code edi?ng.” ku is a Web app that “lets you build real-?me dashboards and widgets using HTML, CSS, and JavaScript.” arts is “an R package to create, customize and publish interac?ve javascript visualiza?ons from R using a familiar latce style plotng interface.” It ports a mul?tude of char?ng libraries, including NVD3, Polychart, Morris, Rickshaw, xCharts, HighCharts, and Leaflet for mapping. etworkX is a port of the popular Python graph library NetworkX. JSNetworkX aims to bring graph processing to JavaScript, client- and server-side, and provide an easy way to visualize graphs in the browser. It is constructed using a host of tools, relying on D3.js for graph visualiza?on. de Flower is an experimental applica?on built on D3.js that visualizes a source code repository as an interac?ve tree. Each circle in a code flower resents a file in your repo and the size of each circle is determined by the number of lines of code in its corresponding file. mple is a D3-based data vizualiza?on library built with the business-oriented analyst in mind. It has a shallow learning curve, exposing as li4le code as sible to get you slicing and dicing your informa?on faster.
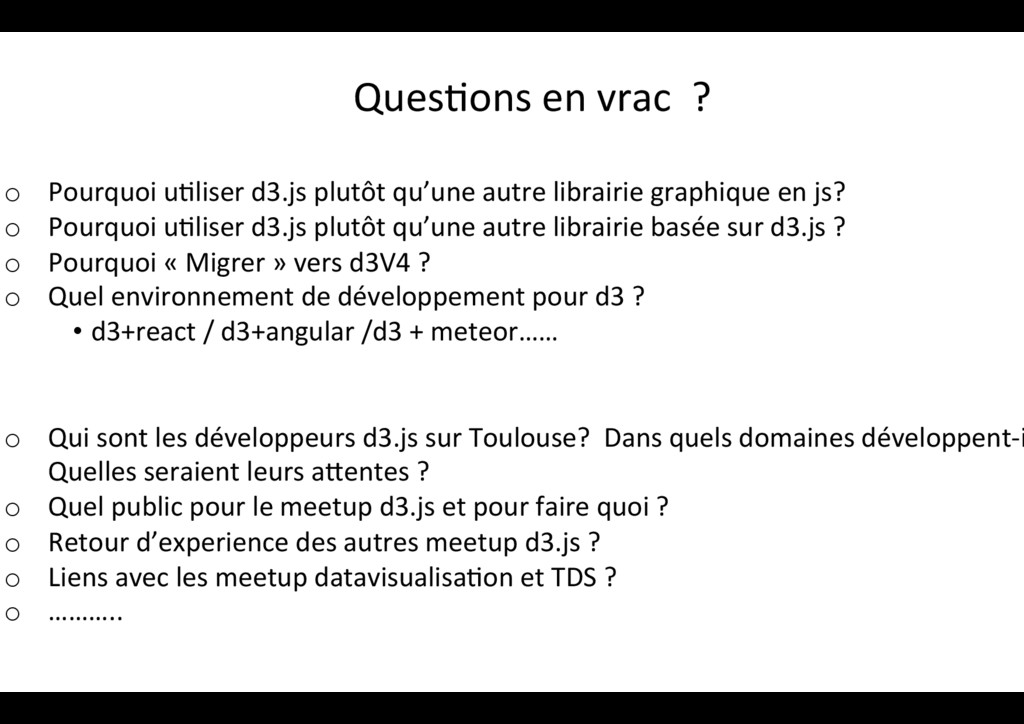
autre librairie graphique en js? o Pourquoi u?liser d3.js plutôt qu’une autre librairie basée sur d3.js ? o Pourquoi « Migrer » vers d3V4 ? o Quel environnement de développement pour d3 ? • d3+react / d3+angular /d3 + meteor…… o Qui sont les développeurs d3.js sur Toulouse? Dans quels domaines développent-i Quelles seraient leurs a4entes ? o Quel public pour le meetup d3.js et pour faire quoi ? o Retour d’experience des autres meetup d3.js ? o Liens avec les meetup datavisualisa?on et TDS ? o ………..
![ao#[email protected]](https://files.speakerdeck.com/presentations/669b8dc71be94839896c919ea398ae5a/slide_0.jpg)