Upgrade to Pro
— share decks privately, control downloads, hide ads and more …
Speaker Deck
Features
Speaker Deck
PRO
Sign in
Sign up for free
Search
Search
Plotting choropleth maps with Cartopy @ PyData ...
Search
alinagator
November 03, 2015
Programming
1.5k
2
Share
Embed
Copy iframe code
Copy JS code
Copy link
Start on current slide
Plotting choropleth maps with Cartopy @ PyData London
alinagator
November 03, 2015
Other Decks in Programming
See All in Programming
型も通る、synthも通る、それでも危ない 〜AIのCDKの権限とコストを機械で検証する〜 / It Passes Type Checks, It Passes Synth Checks, but It’s Still Risky — Automatically Verifying Permissions and Costs in AI’s CDK —
seike460
PRO
1
390
作るコストが小さくなった時代 幸せに働くために改めて考えたいこと 〜エンジニアとして価値を出し続けるために注視している二分野〜
yuppeeng
0
120
symfony/aiとlaravel/boost
77web
0
140
ランチタイムLT会3周年!ランチタイムLT会を3年間続けられたお話
y0hgi
1
150
php-fpmのプロセスが枯渇した日-調査・対処・そして本当にやるべきだったこと-
shibuchaaaan
0
110
Go言語とトイモデルで学ぶTransformerの気持ち / fukuokago23-transformer
monochromegane
0
140
琵琶湖の水は止められてもNet--HTTPのリトライは止められない / You might be able to stop the water flow of Lake Biwa but you can't stop Net::HTTP retries
luccafort
PRO
0
420
LaravelLive Japan の裏方のすべて — 第188回 PHP勉強会@東京 (2026-06-24)
suguruooki
2
150
Generative UI & AI-Assistants for Your Angular Solutions
manfredsteyer
PRO
1
210
Welcome to the "Parametricity" 🏙️ − Generic だけど Specific な世界 −
guvalif
PRO
1
180
AIキャラアプリkaiwaの低遅延音声通話基盤をどう作ったか - AWS Gravitonで支える低遅延・低コストAI Agent基盤
mogamit
0
180
yield再入門 #phpcon
o0h
PRO
0
690
Featured
See All Featured
Taking LLMs out of the black box: A practical guide to human-in-the-loop distillation
inesmontani
PRO
3
2.3k
Why You Should Never Use an ORM
jnunemaker
PRO
61
9.9k
SEOcharity - Dark patterns in SEO and UX: How to avoid them and build a more ethical web
sarafernandez
0
220
How to build a perfect <img>
jonoalderson
1
5.8k
Applied NLP in the Age of Generative AI
inesmontani
PRO
4
2.4k
Evolution of real-time – Irina Nazarova, EuRuKo, 2024
irinanazarova
9
1.4k
The innovator’s Mindset - Leading Through an Era of Exponential Change - McGill University 2025
jdejongh
PRO
1
220
Pawsitive SEO: Lessons from My Dog (and Many Mistakes) on Thriving as a Consultant in the Age of AI
davidcarrasco
0
190
Visual Storytelling: How to be a Superhuman Communicator
reverentgeek
2
590
Navigating Algorithm Shifts & AI Overviews - #SMXNext
aleyda
1
1.5k
Product Roadmaps are Hard
iamctodd
55
12k
GraphQLの誤解/rethinking-graphql
sonatard
75
12k
Transcript
Plotting choropleth maps with Cartopy Alina Solovjova
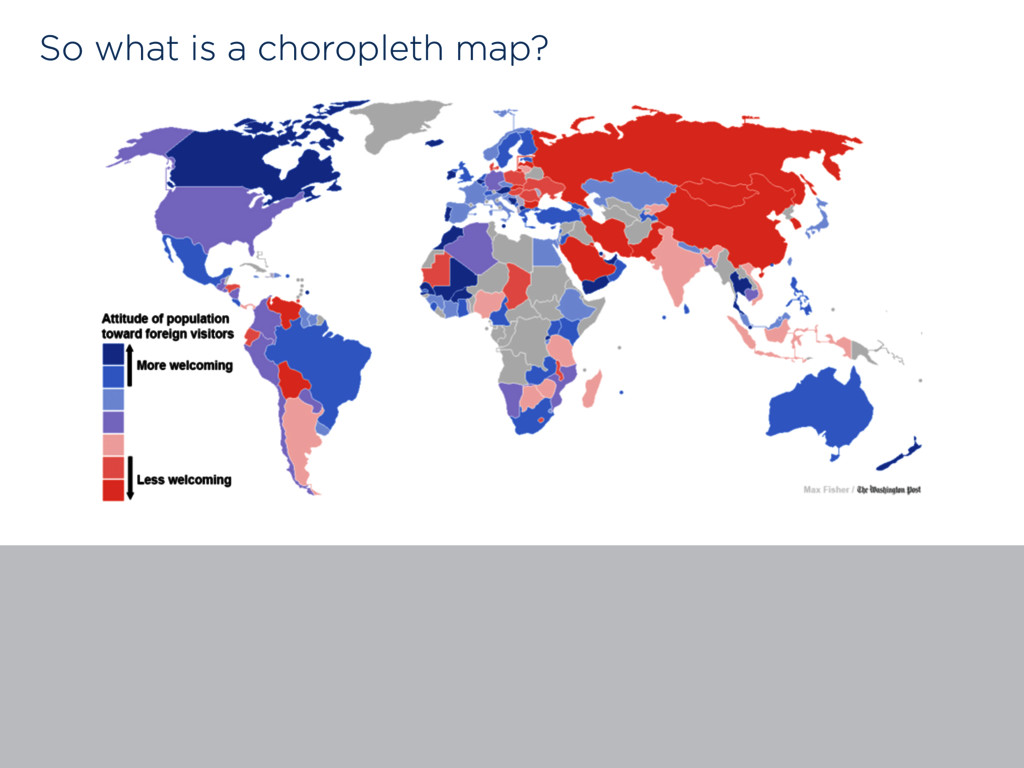
So what is a choropleth map?
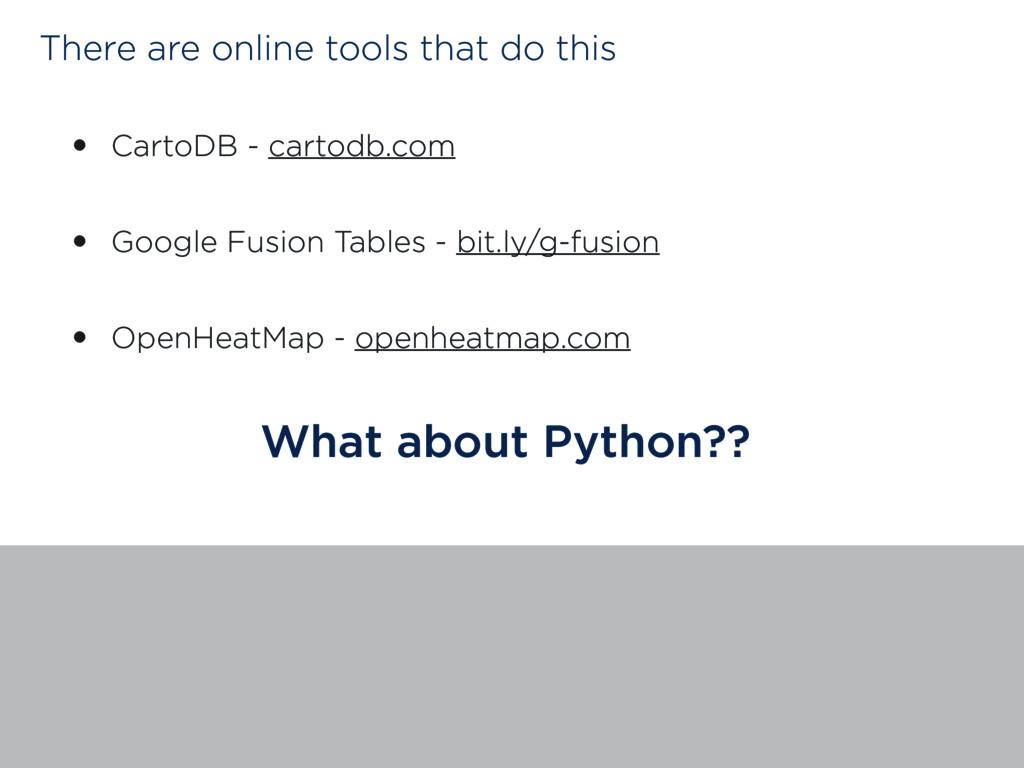
There are online tools that do this • CartoDB -
cartodb.com • Google Fusion Tables - bit.ly/g-fusion • OpenHeatMap - openheatmap.com What about Python??
pip install cartopy
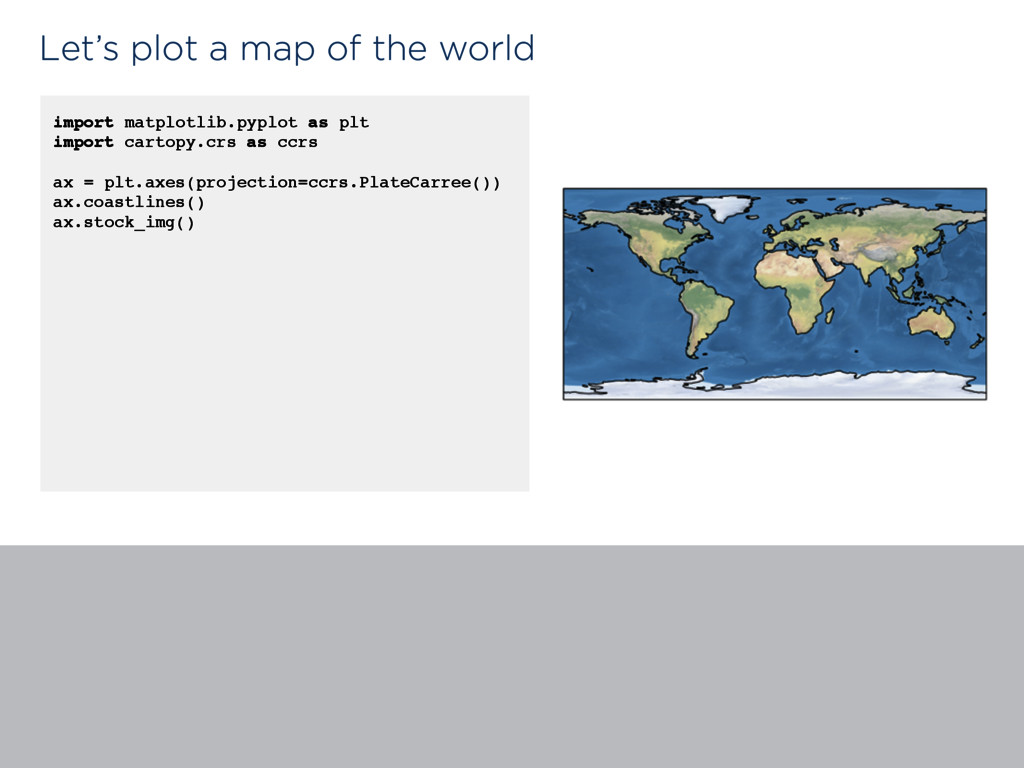
Let’s plot a map of the world import matplotlib.pyplot as
plt import cartopy.crs as ccrs ax = plt.axes(projection=ccrs.PlateCarree()) ax.coastlines() ax.stock_img()
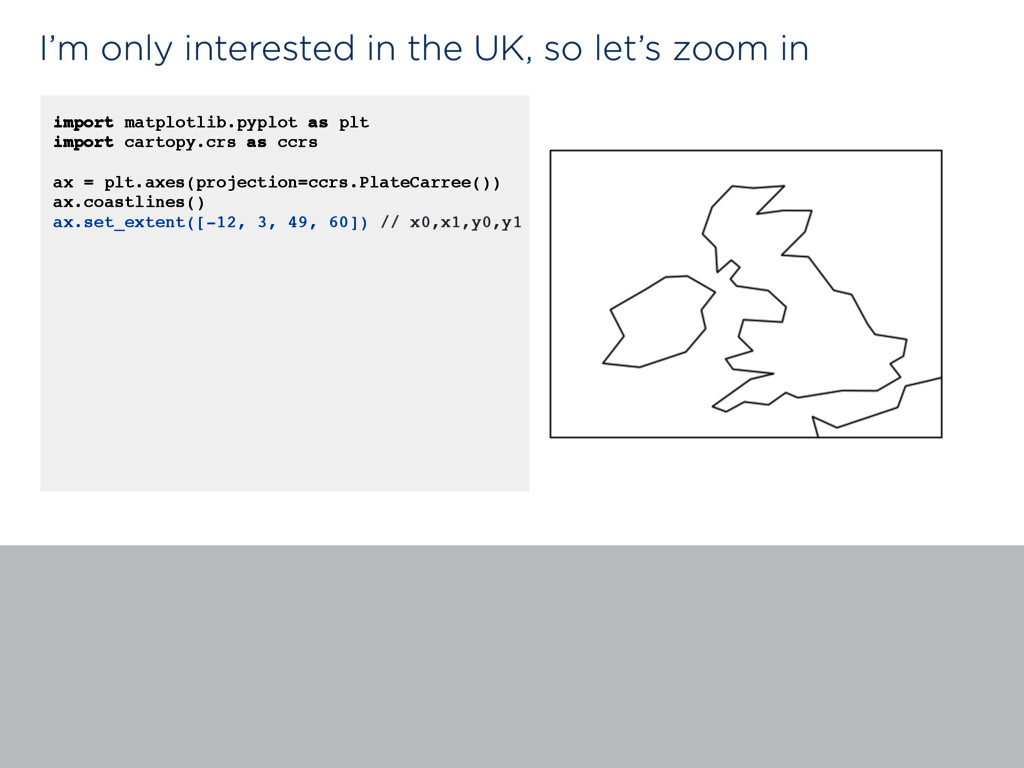
I’m only interested in the UK, so let’s zoom in
import matplotlib.pyplot as plt import cartopy.crs as ccrs ax = plt.axes(projection=ccrs.PlateCarree()) ax.coastlines() ax.set_extent([-12, 3, 49, 60]) // x0,x1,y0,y1
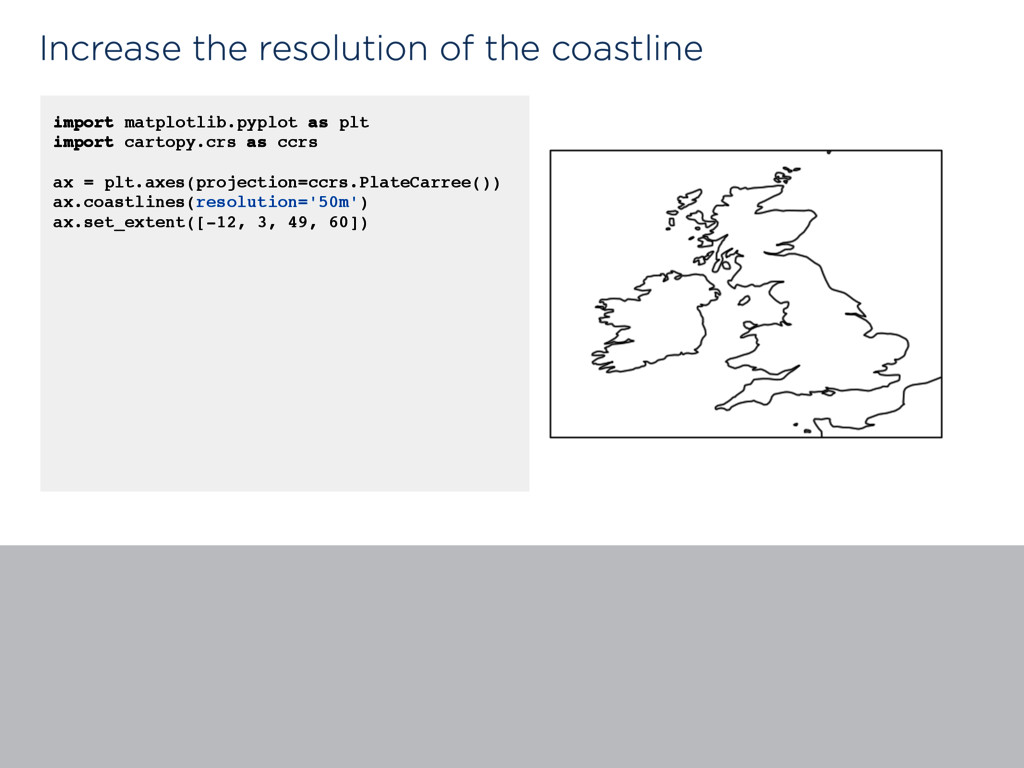
Increase the resolution of the coastline import matplotlib.pyplot as plt
import cartopy.crs as ccrs ax = plt.axes(projection=ccrs.PlateCarree()) ax.coastlines(resolution='50m') ax.set_extent([-12, 3, 49, 60])
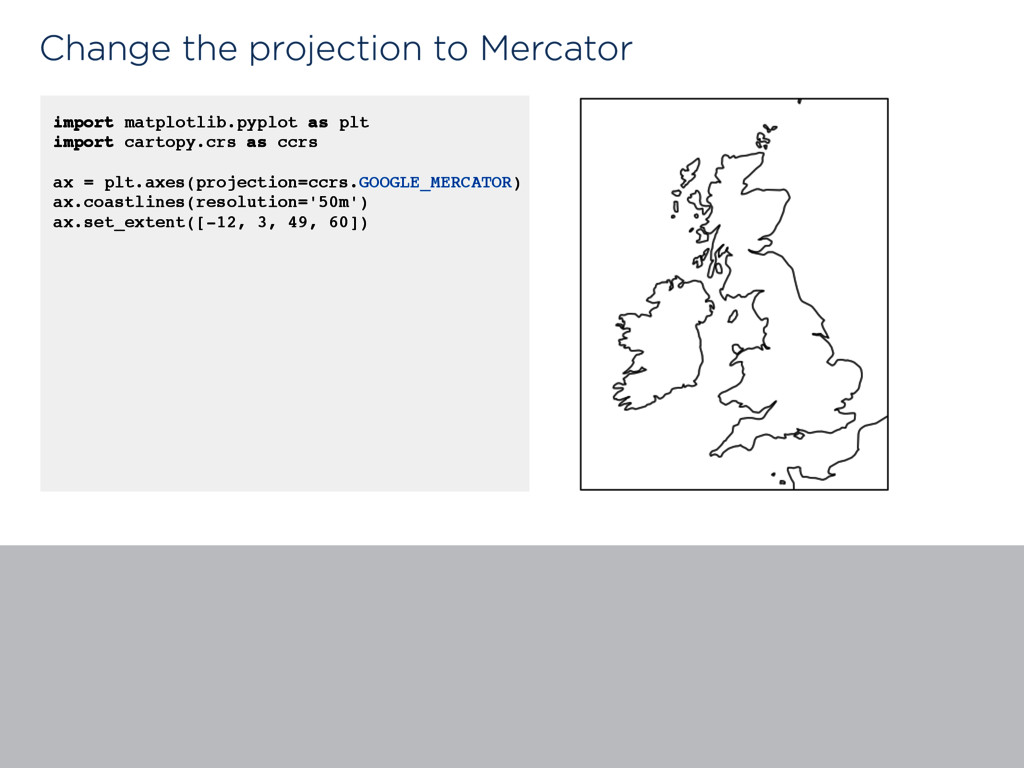
Change the projection to Mercator import matplotlib.pyplot as plt import
cartopy.crs as ccrs ax = plt.axes(projection=ccrs.GOOGLE_MERCATOR) ax.coastlines(resolution='50m') ax.set_extent([-12, 3, 49, 60])
None
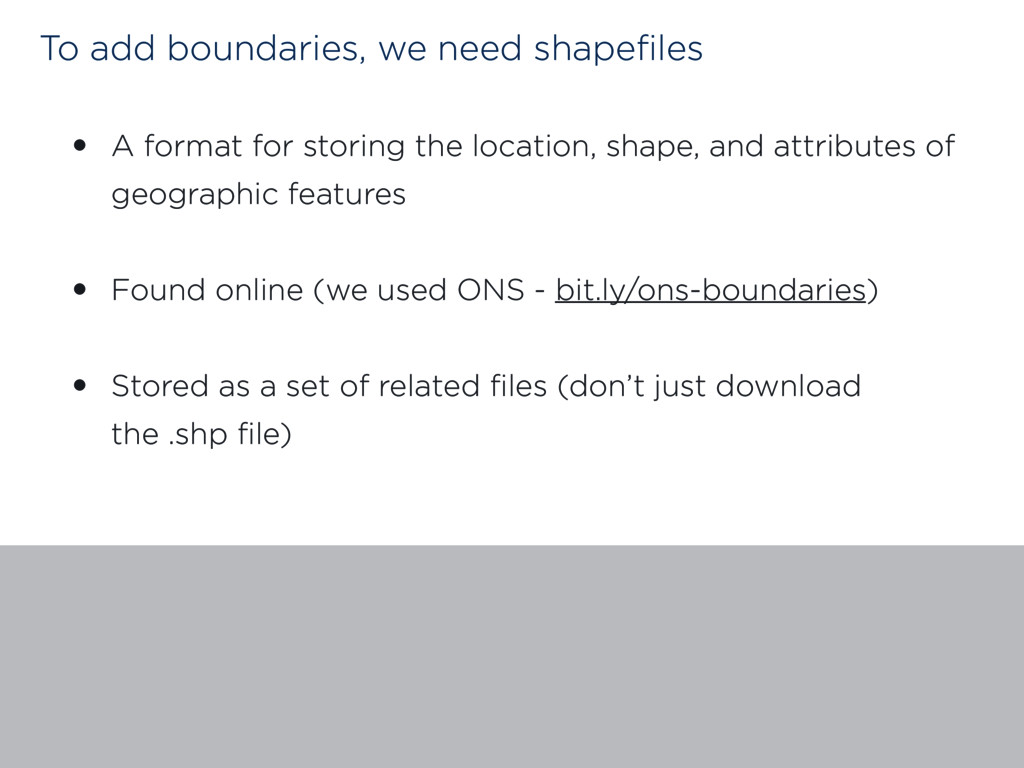
To add boundaries, we need shapefiles • A format for
storing the location, shape, and attributes of geographic features • Found online (we used ONS - bit.ly/ons-boundaries) • Stored as a set of related files (don’t just download the .shp file)
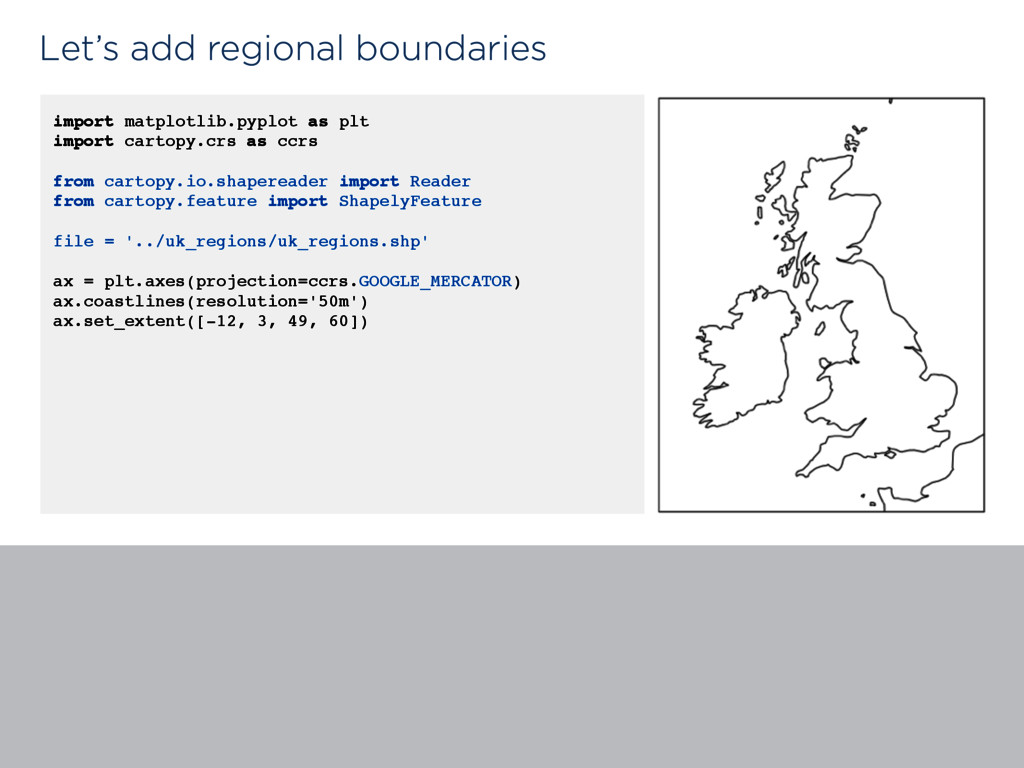
Let’s add regional boundaries import matplotlib.pyplot as plt import cartopy.crs
as ccrs from cartopy.io.shapereader import Reader from cartopy.feature import ShapelyFeature file = '../uk_regions/uk_regions.shp' ax = plt.axes(projection=ccrs.GOOGLE_MERCATOR) ax.coastlines(resolution='50m') ax.set_extent([-12, 3, 49, 60])
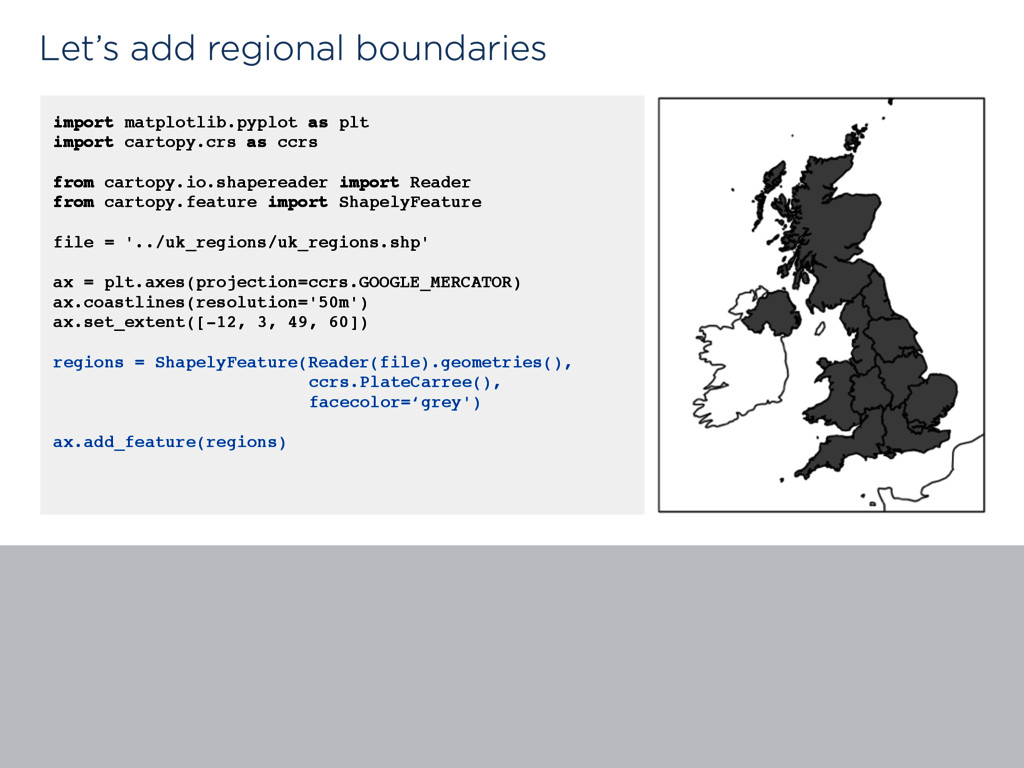
Let’s add regional boundaries import matplotlib.pyplot as plt import cartopy.crs
as ccrs from cartopy.io.shapereader import Reader from cartopy.feature import ShapelyFeature file = '../uk_regions/uk_regions.shp' ax = plt.axes(projection=ccrs.GOOGLE_MERCATOR) ax.coastlines(resolution='50m') ax.set_extent([-12, 3, 49, 60]) regions = ShapelyFeature(Reader(file).geometries(), ccrs.PlateCarree(), facecolor=‘grey') ax.add_feature(regions)
Merge data + region shapes {region.attributes['name_small']: region.geometry for region in
Reader(file).records()}
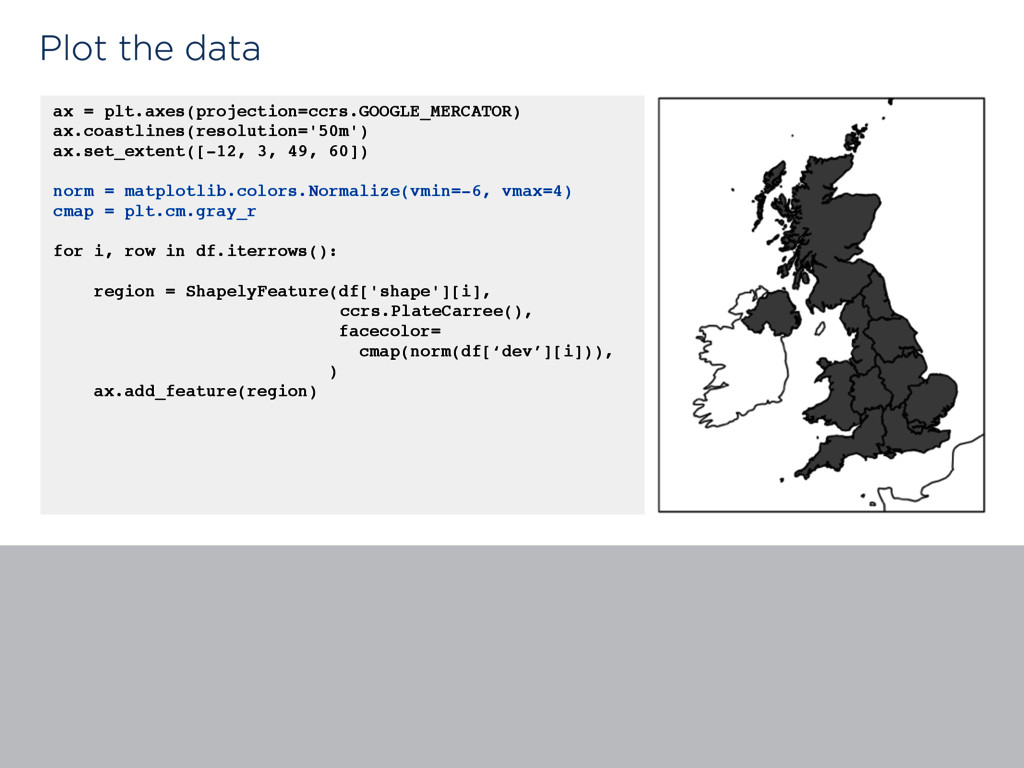
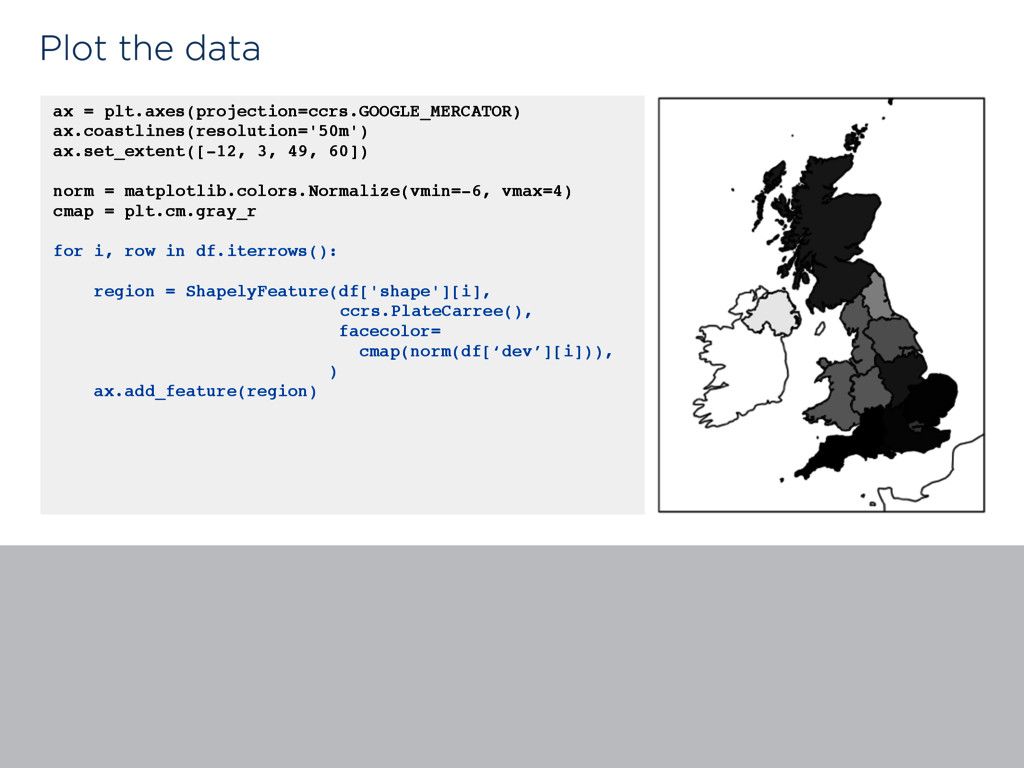
Plot the data ax = plt.axes(projection=ccrs.GOOGLE_MERCATOR) ax.coastlines(resolution='50m') ax.set_extent([-12, 3, 49,
60]) norm = matplotlib.colors.Normalize(vmin=-6, vmax=4) cmap = plt.cm.gray_r for i, row in df.iterrows(): region = ShapelyFeature(df['shape'][i], ccrs.PlateCarree(), facecolor= cmap(norm(df[‘dev’][i])), ) ax.add_feature(region)
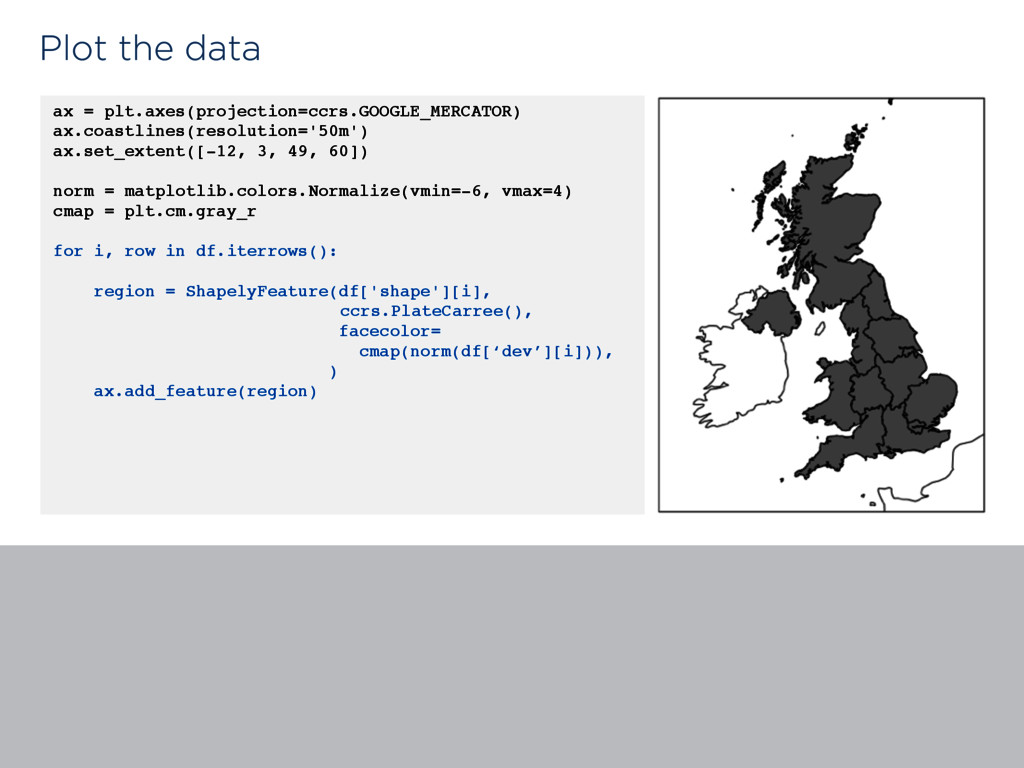
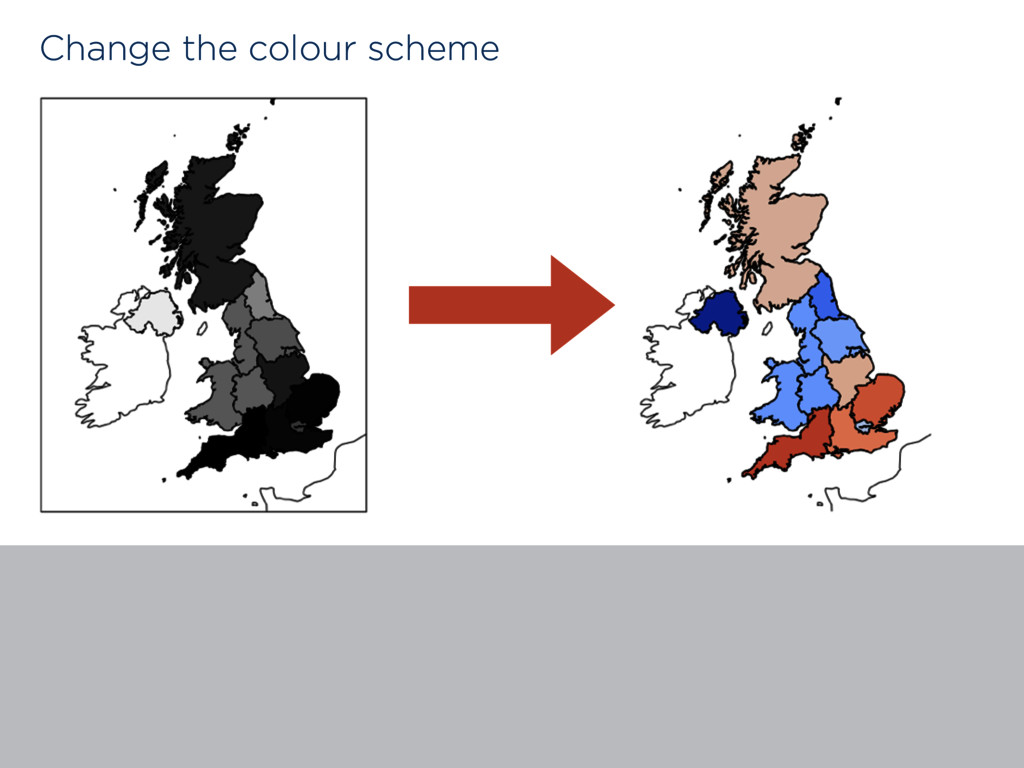
Change the colour scheme
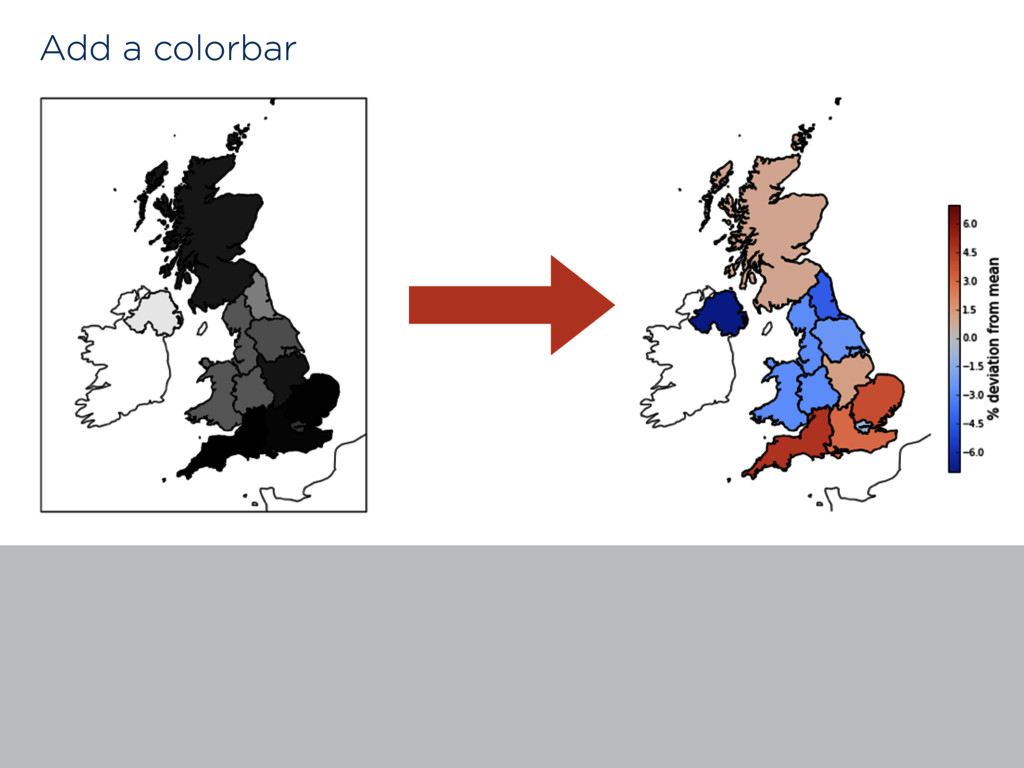
Add a colorbar
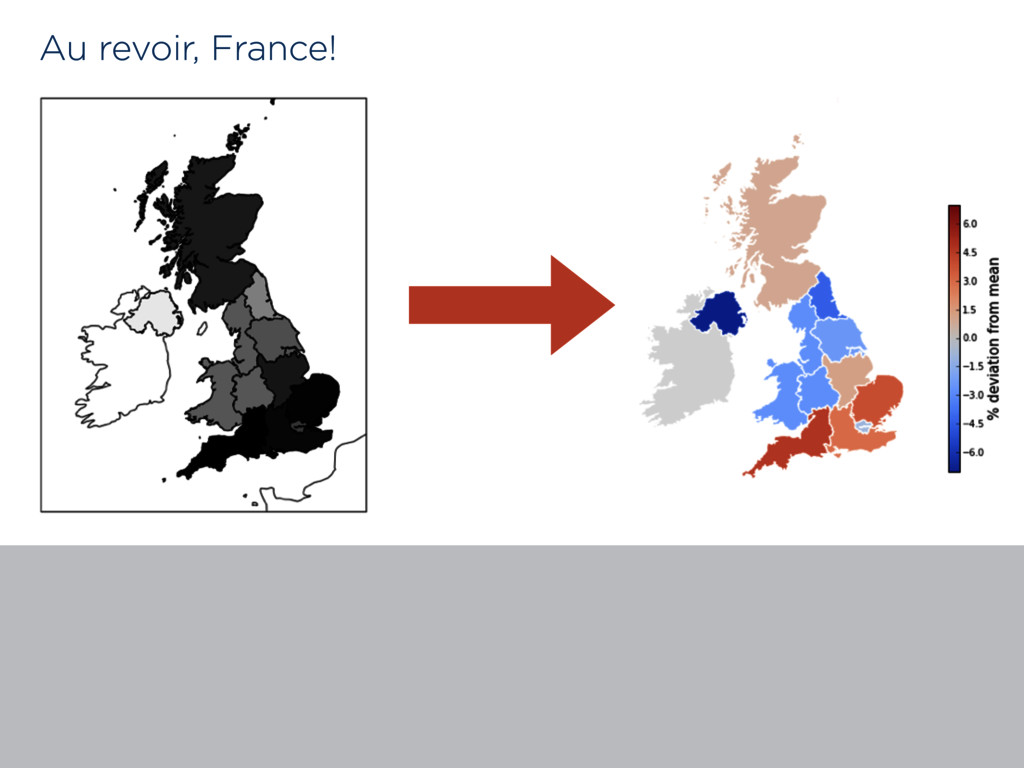
Au revoir, France!
We’re looking for a data engineer!
[email protected]
![Merge data + region shapes {region.attributes['name_small']: region.geometry for region in](https://files.speakerdeck.com/presentations/76046503f2a64725b461d29429da6943/slide_12.jpg)
![We’re looking for a data engineer! [email protected]](https://files.speakerdeck.com/presentations/76046503f2a64725b461d29429da6943/slide_19.jpg)