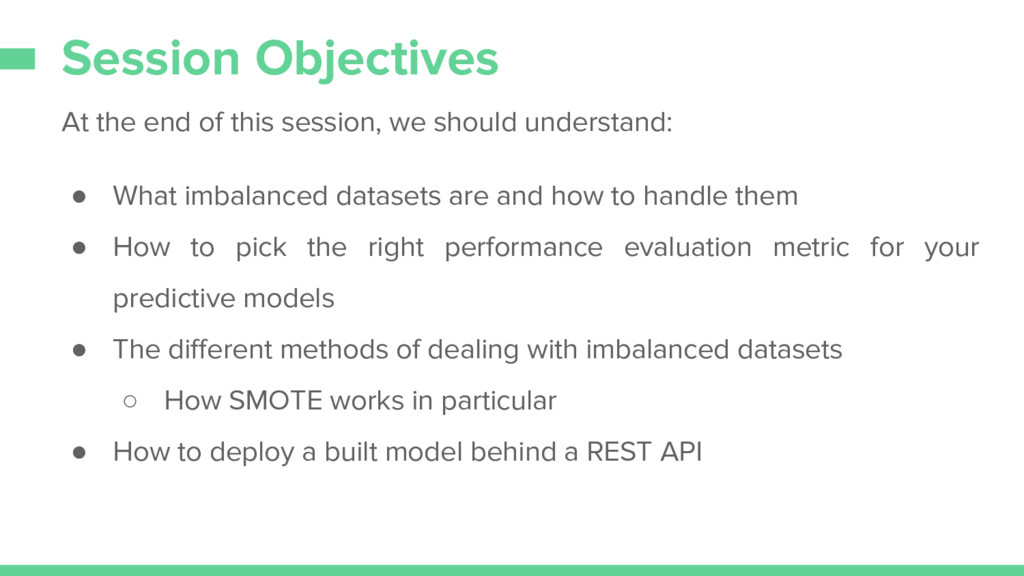
understand: • What imbalanced datasets are and how to handle them • How to pick the right performance evaluation metric for your predictive models • The different methods of dealing with imbalanced datasets ◦ How SMOTE works in particular • How to deploy a built model behind a REST API
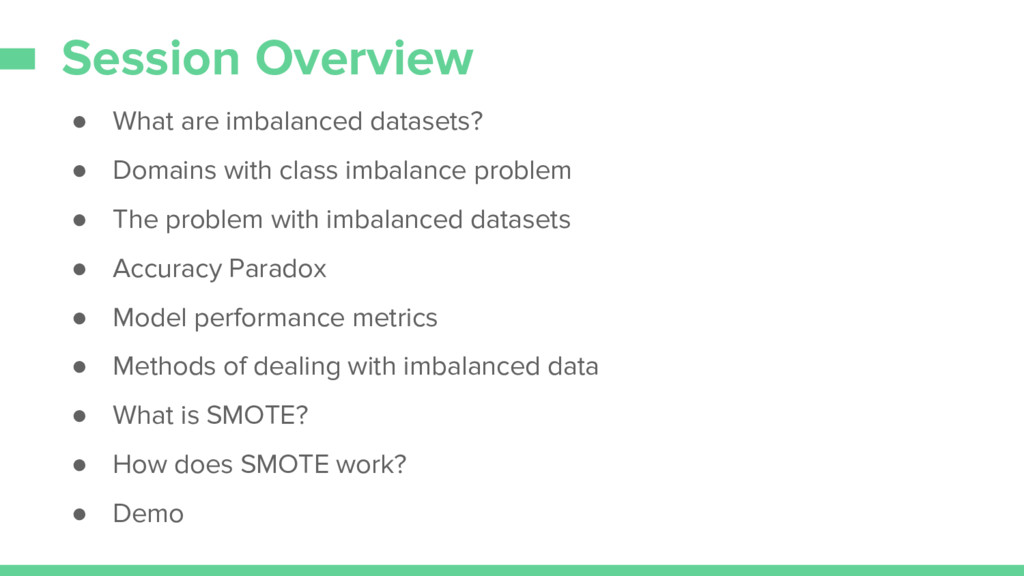
class imbalance problem • The problem with imbalanced datasets • Accuracy Paradox • Model performance metrics • Methods of dealing with imbalanced data • What is SMOTE? • How does SMOTE work? • Demo
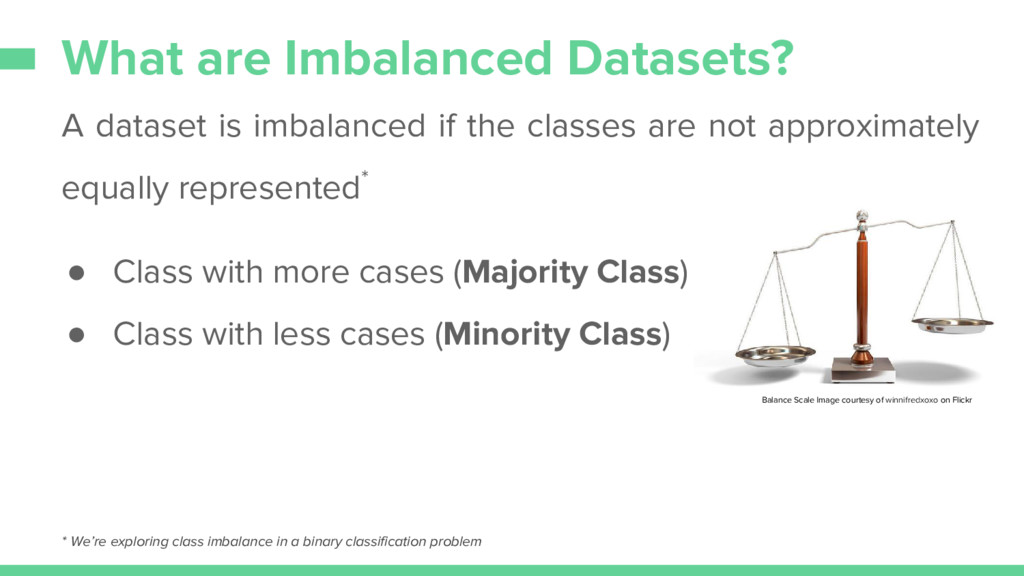
classes are not approximately equally represented* • Class with more cases (Majority Class) • Class with less cases (Minority Class) * We’re exploring class imbalance in a binary classification problem Balance Scale Image courtesy of winnifredxoxo on Flickr
detect/predict the rare but very important cases of the minority class. • We require a high rate of correct prediction in the minority class (the critical class). • When ML algorithms are trained on imbalanced datasets, they give biased predictions and misleading accuracy scores.
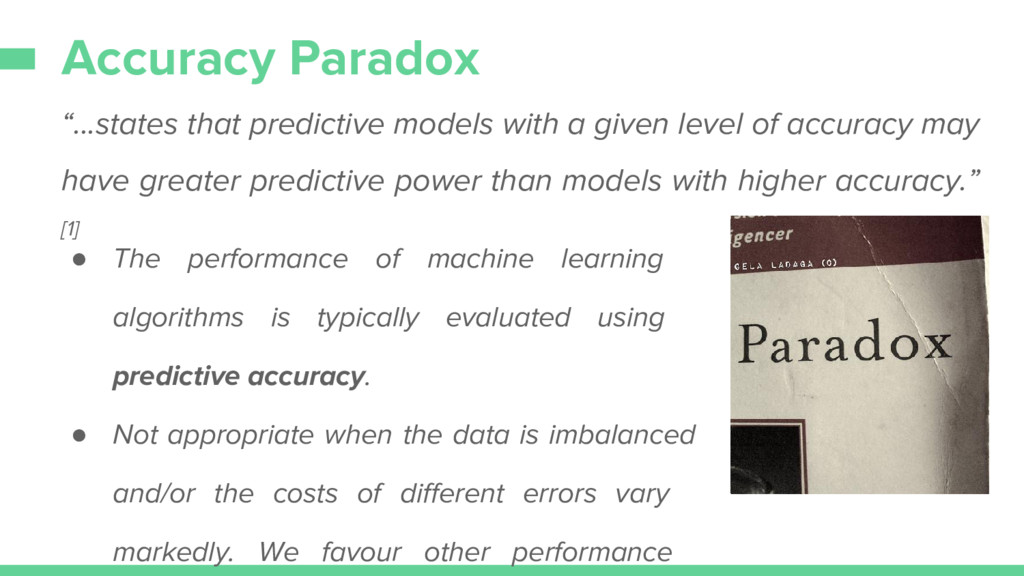
of accuracy may have greater predictive power than models with higher accuracy.” [1] • The performance of machine learning algorithms is typically evaluated using predictive accuracy. • Not appropriate when the data is imbalanced and/or the costs of different errors vary markedly. We favour other performance
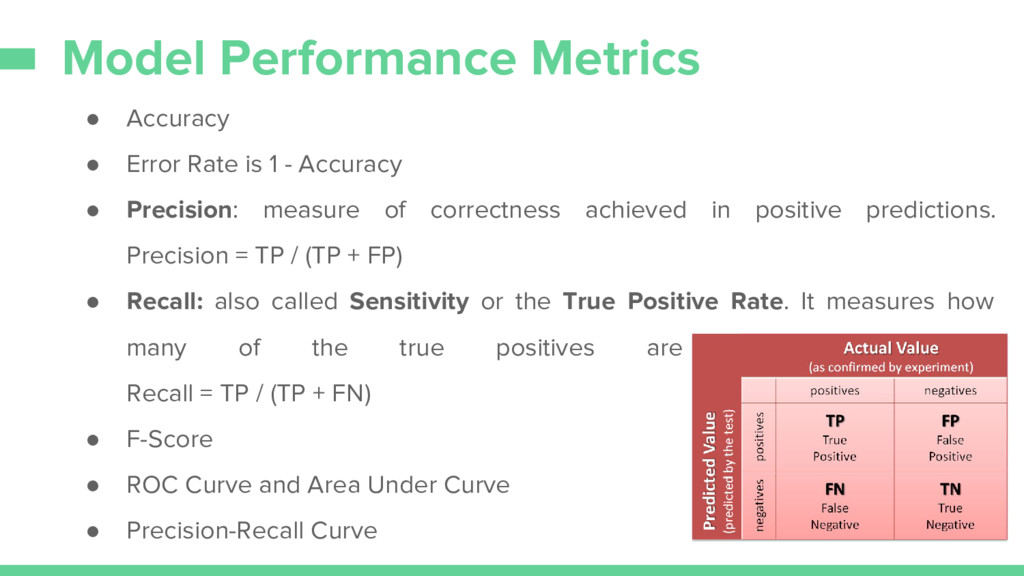
- Accuracy • Precision: measure of correctness achieved in positive predictions. Precision = TP / (TP + FP) • Recall: also called Sensitivity or the True Positive Rate. It measures how many of the true positives are predicted correctly. Recall = TP / (TP + FN) • F-Score • ROC Curve and Area Under Curve • Precision-Recall Curve
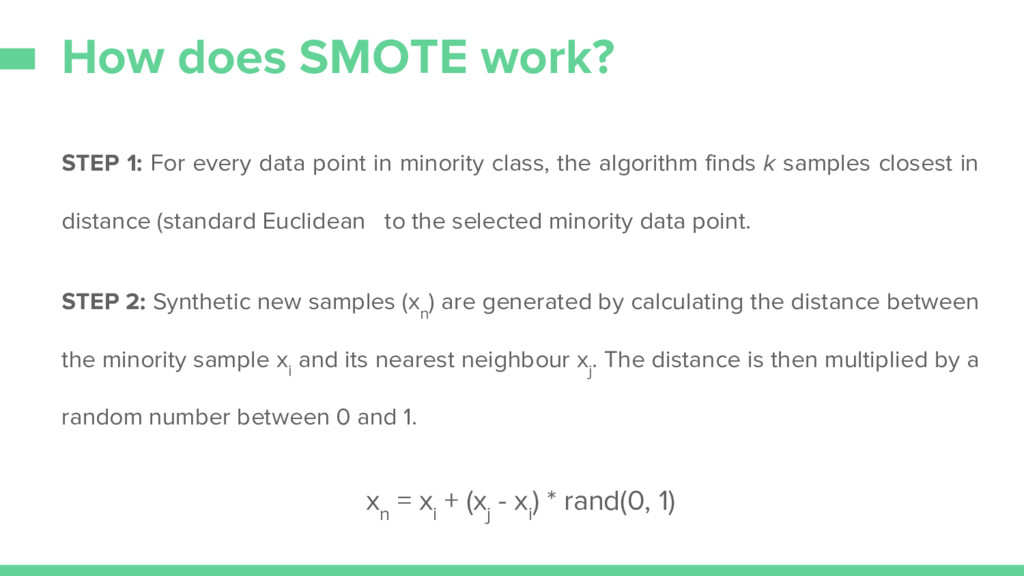
algorithm finds k samples closest in distance (standard Euclidean to the selected minority data point. STEP 2: Synthetic new samples (x n ) are generated by calculating the distance between the minority sample x i and its nearest neighbour x j . The distance is then multiplied by a random number between 0 and 1. x n = x i + (x j - x i ) * rand(0, 1) How does SMOTE work?