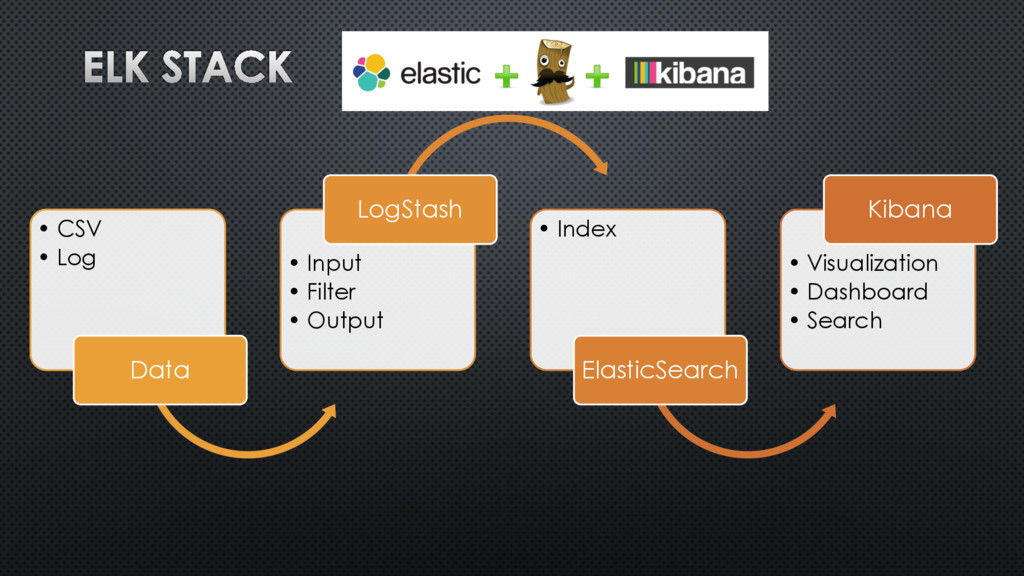
During this talk the attendees will have an opportunity to use the ELK(Elasticsearch, Logstash, Kibana) stack to visualize their complex log data.
Abstract
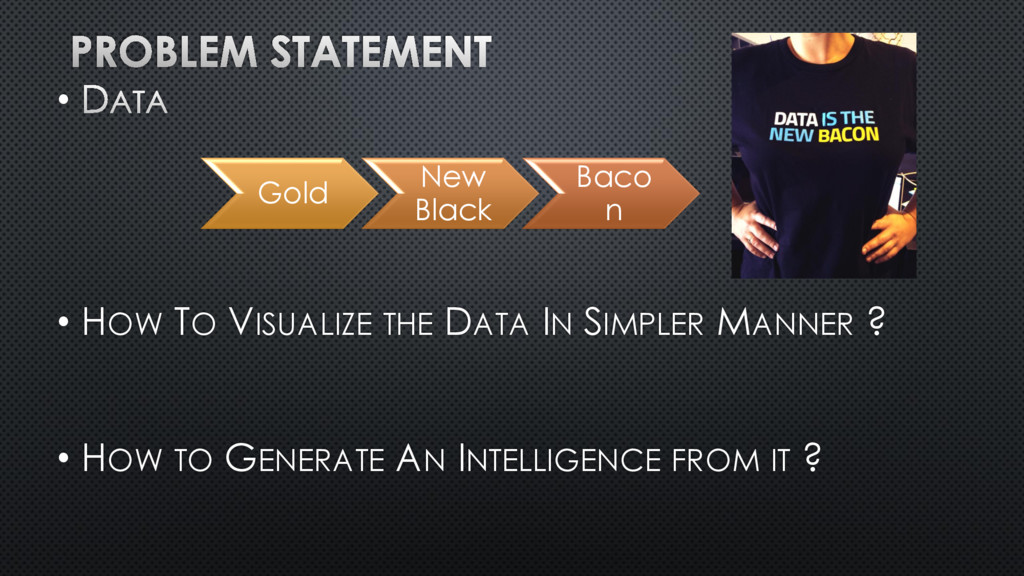
Data is the new bacon. For all industries, including health, security, entertainment, etc., it is impossible for anyone to store and analyze data without using an automated platform. A unified platform is needed to provide data visualization and extract intelligence.
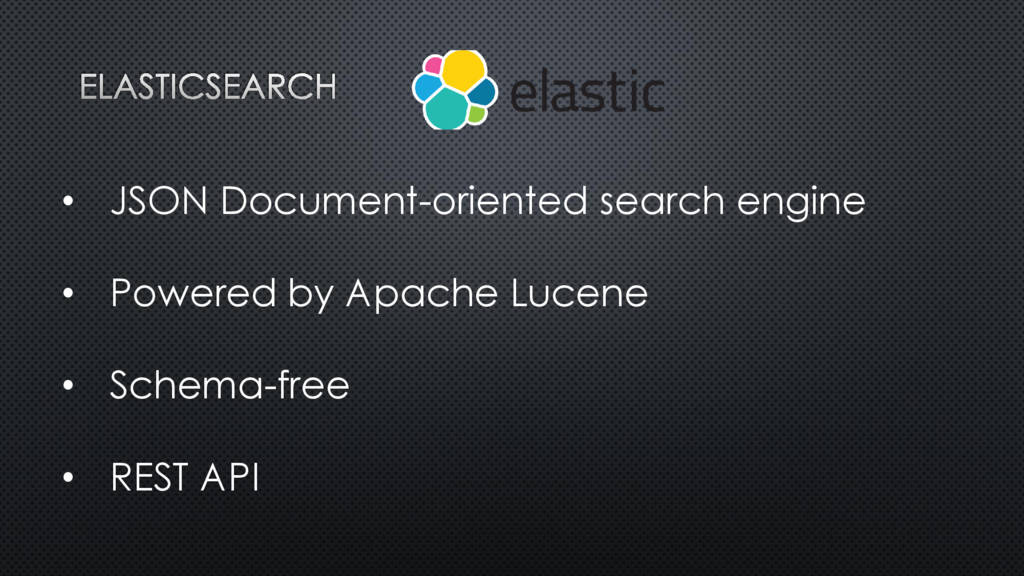
Elasticsearch is a distributed, real-time, search and analytics platform. With the help of a restful API, Elasticsearch saves data and auto indexes the parsed data.
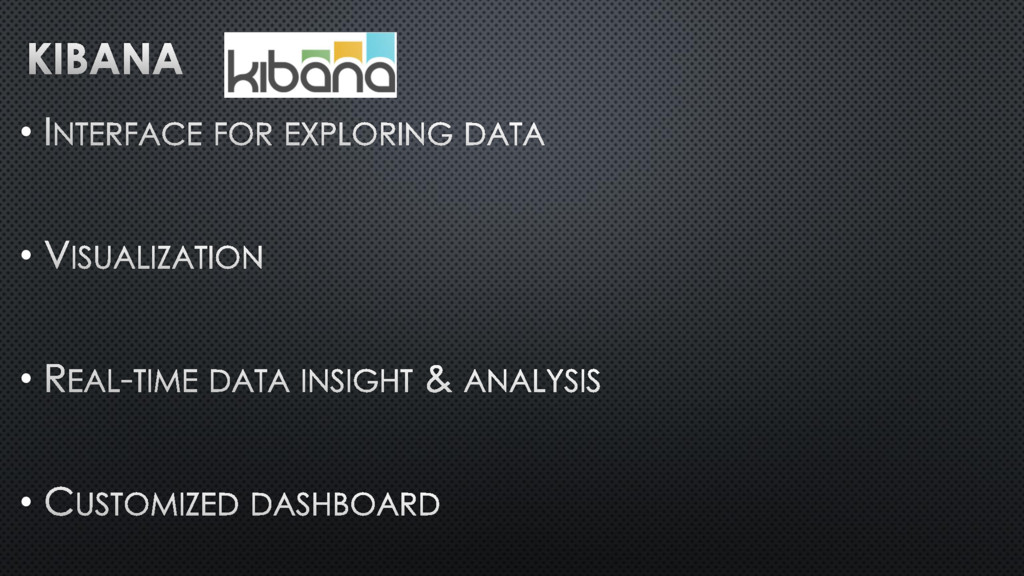
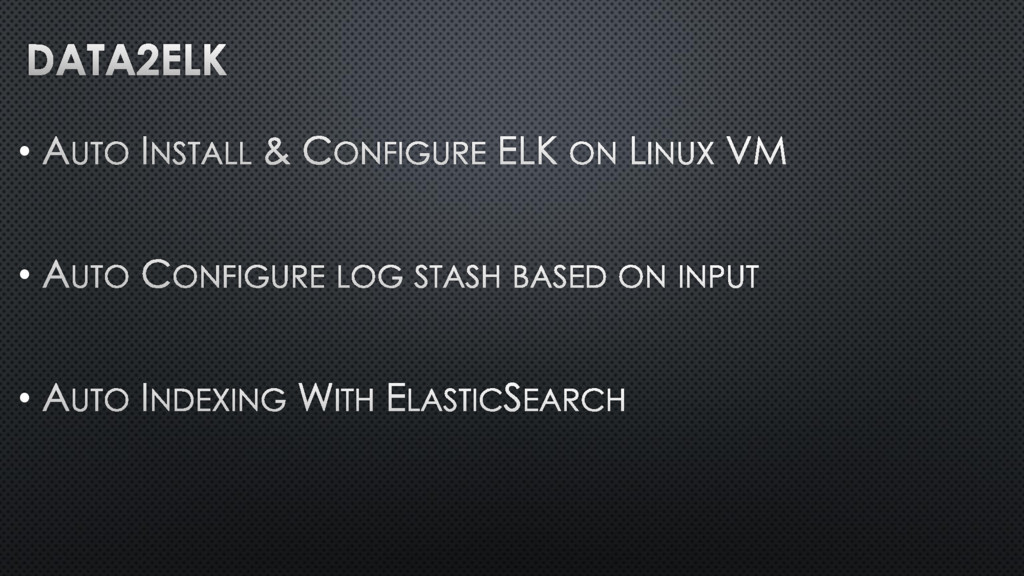
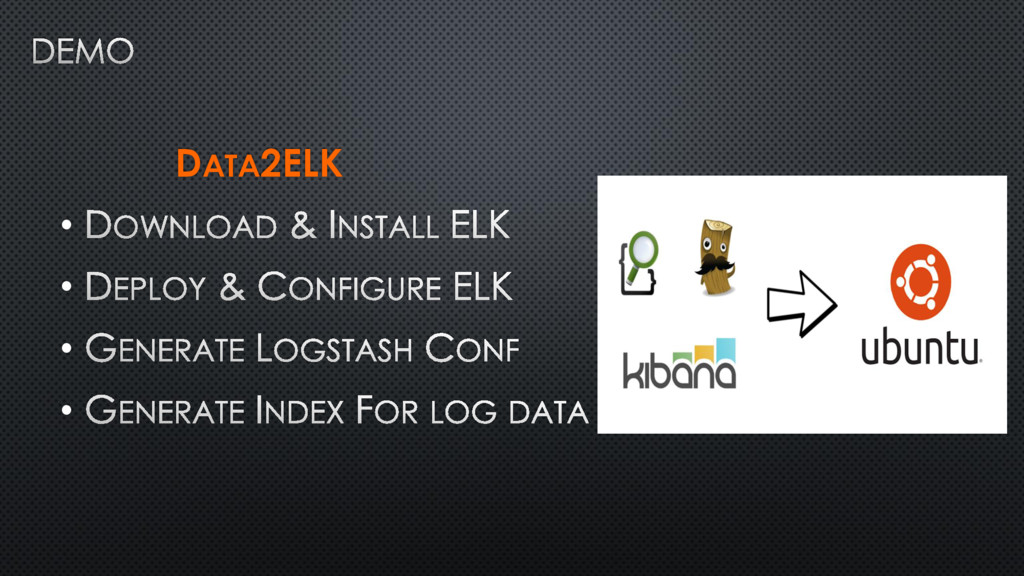
During our talk, we will walk attendees through configuring the ELK stack and visualize datasets on Kibana.