Upgrade to Pro — share decks privately, control downloads, hide ads and more …

Defcon - Deploying TBATS Machine Learning Algorithm to Detect Security Events

Defcon - Deploying TBATS Machine Learning Algorithm to Detect Security Events

https://www.amirootyet.com/

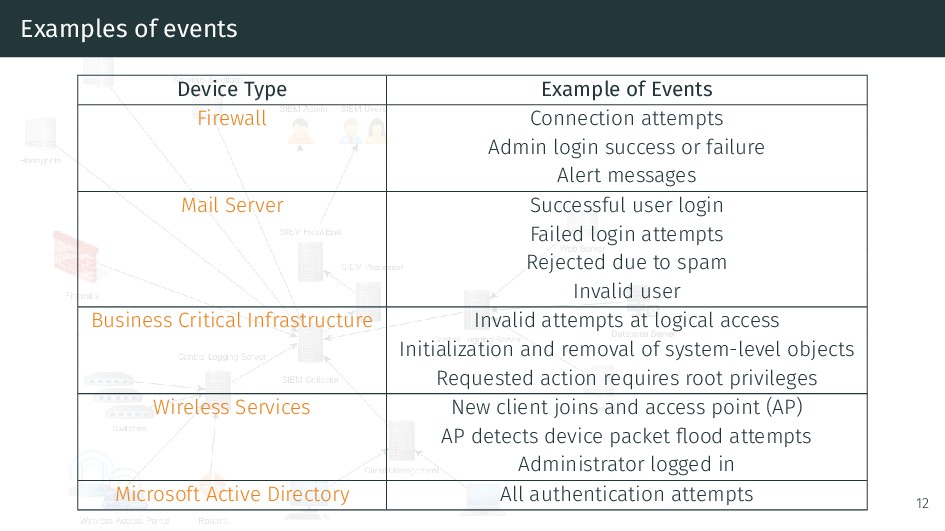
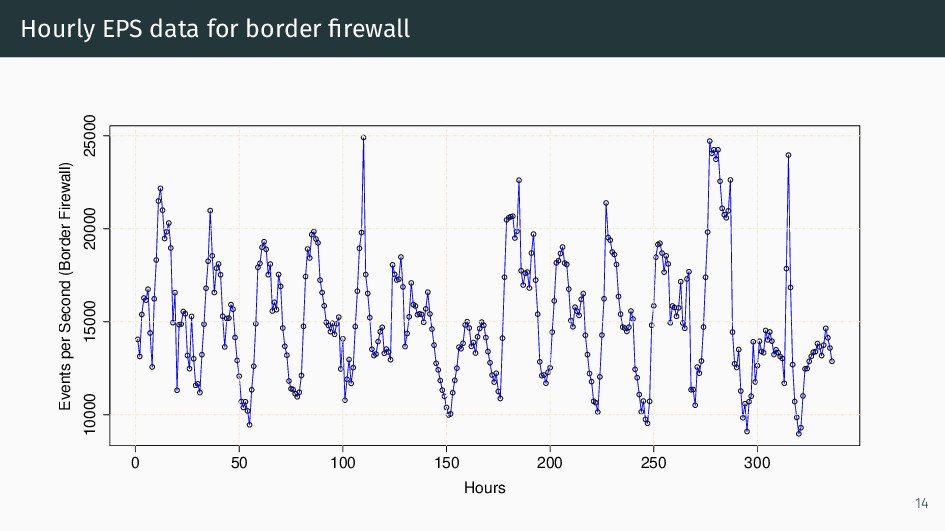
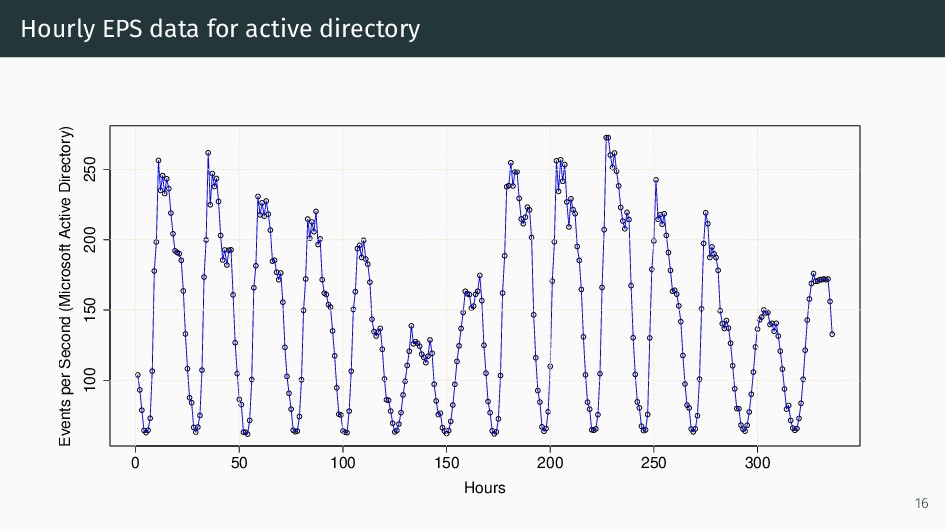
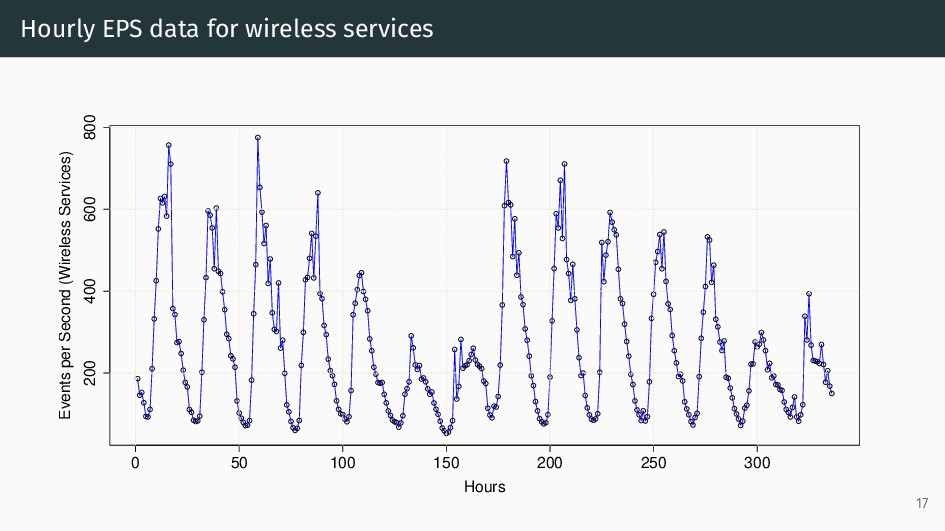
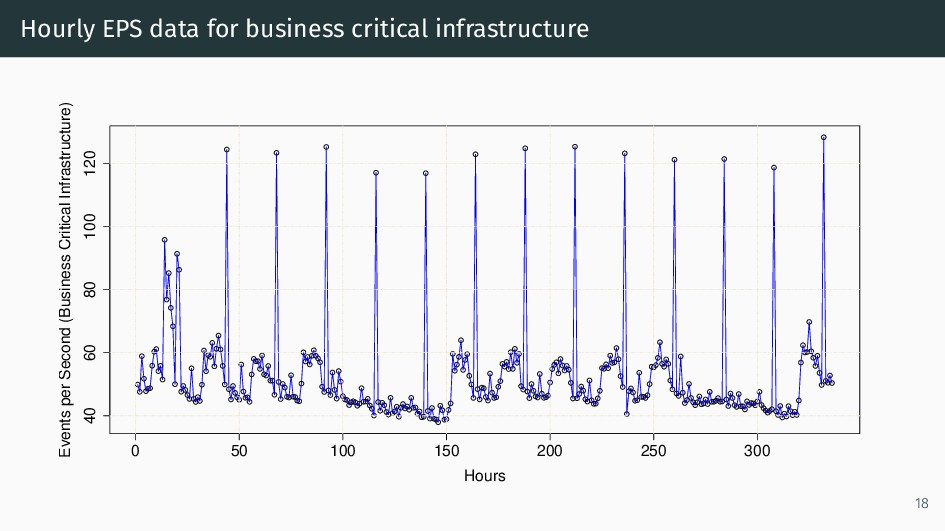
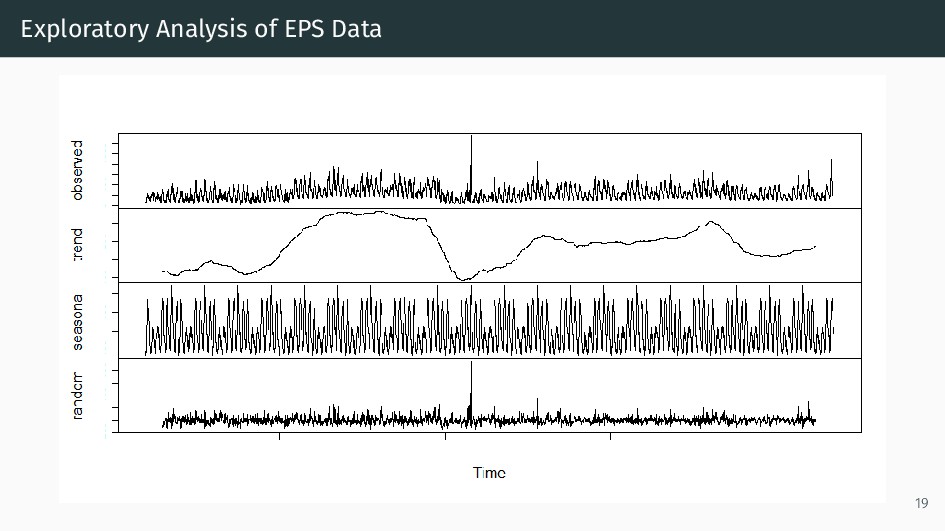
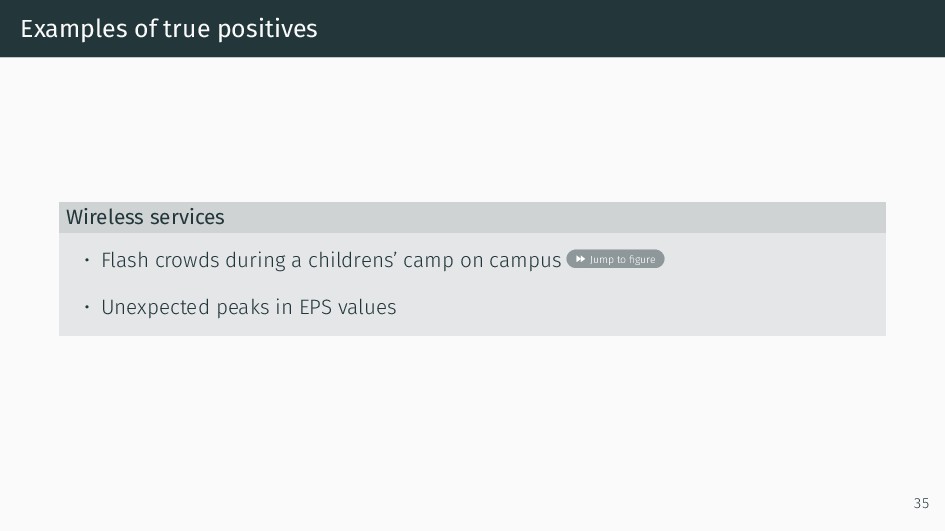
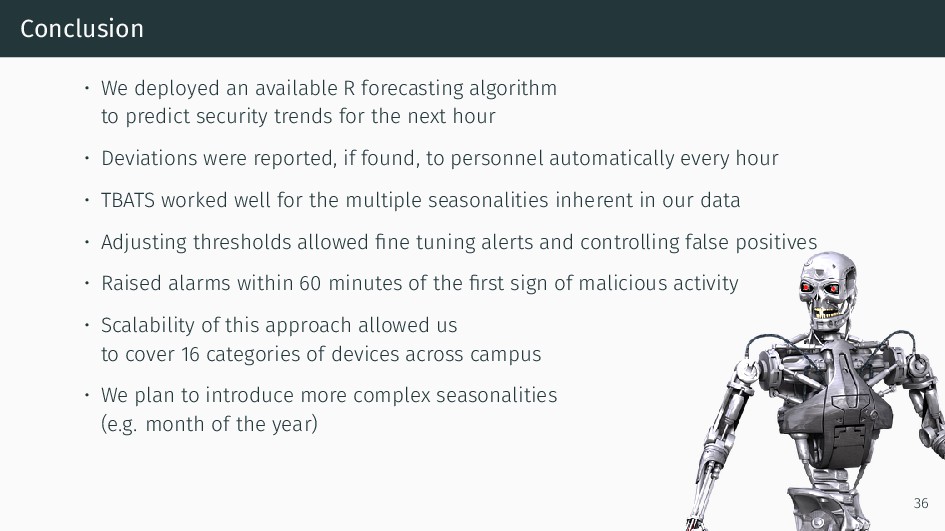
Our “BATSense” security event detection methodology has been running at Michigan State University’s campus for a year and is successfully detecting security anomalies across 300k devices. In this presentation, we will describe the use machine learning, specifically the TBATS forecasting algorithm, to predict future trends for the number of events per second for a variety of device types. The forecasted values are compared against actual observations to alert security personnel of significant deviations. Anomalies are detected based on logs relevant to security events; they may be system modifications, system failures or a football game. Forecasts are never perfect, but when measured over extended use, we have shown that false positives are manageable (1 per week) for true positives of 1 per day. The result a methodology that has been developed and tweaked over time to effectively detect security events, and lessons learned over a year. All arguments presented in this talk will be backed by real world (anonymized) data collected at our university shared with the audience.

Pranshu Bajpai

August 16, 2018
Tweet

More Decks by Pranshu Bajpai

Other Decks in Technology

Transcript

  1. Holy BATSense! Deploying TBATS Machine Learning Algorithm to Detect Security

    Events Pranshu Bajpai (@amirootyet) August 16, 2018 AI Village @ DEF CON 26 1
  2. Agenda 1. Introduction 2. Background 3. Data Collection 4. Data

    plots 5. The forecasting algorithm: TBATS 6. Methodology 7. Results 8. Investigating Anomalous Events Examples of true positives 9. Conclusion 2
  3. About us Pranshu Bajpai • PhD candidate at Michigan State

    University • Previously worked as an independent penetration tester • Security researcher at Security Research Group, MSU • Active speaker at security conferences: DEF CON, GrrCon, ToorCon, BSides, APWG eCrime ...  http://cse.msu.edu/~bajpaipr/  https://twitter.com/amirootyet  https://www.linkedin.com/in/pranshubajpai/ Dr. Richard Enbody • Associate Professor at Michigan State University • Teaching computer architecture, security, programming • Books: Targeted Cyber Attacks, The Practice of Computing using Python 3
  4. Disclaimer! The views expressed in this presentation are based entirely

    on my research efforts and do not relate to any of my present or previous employers! I assume basic knowledge of anomaly detection and artificial intelligence during this presentation! 4
  5. The problem • Organizations are constantly targeted by attackers •

    Barrage of targeted and general reconnaissance attacks • Small ratio of security personnel to devices being monitored • Need of an assisting application that identifies events of interest • Raise alarms as security events happen while pruning off noise • Be “intelligent” enough to identify changing patterns based on past data and suppress noise 5
  6. Challenges • Overwhelming amounts of information contributed by an amalgam

    of devices across the organization • Maintain a balance between false positives and true positives lest employees experience alert fatigue • Need for dynamic correlations that constantly adjust according to recent data observed in environment 6
  7. Anomalies Point Anomalies Individual data point considered anomalous with respect

    to the rest of the data points Example: exceptionally high number of login attempts 7
  8. Anomalies Contextual Anomalies Data point considered anomalous in a specific

    context, but not otherwise Example: exceptionally high number of login attempts at 4 AM 7
  9. Anomalies Collective Anomalies Related data points are collectively anomalous with

    respect to the entire dataset Example: exceptionally high number of expensive purchases 7
  10. Related Work Anomaly detection approaches can be classified into: •

    Statistical • Static rule-based • Model-based • ... Specifically, the following forecasting methods have been popularly used in anomaly detection: • ARIMA • Holt-Winters • Neural networks 8
  11. Related Work We encountered the following issues while adapting these

    approaches in our environments: • high false positive rates causing alert fatigue • excessive resource consumption • requirement of prior knowledge of attack patterns • diversity of network traffic Can we write a simple script taking advantage of the seasonalities inherent in data to effectively detect coarse anomalies across 1000s of devices? 9
  12. The SIEM system • SIEM accumulates security event-related logs from

    critical sources within the organization • Examples: Qradar, LogRhythm, AlienVault, Splunk, ArcSight • SIEM system: • enables central storage and interpretation of logs • allows real time analysis for rapid incident handling • facilitates trend analysis and rapid reporting 10
  13. Understanding events per second • SIEM allows statistical analysis on

    the log data accumulated • We calculate events per second (EPS) as follows: EPS = Number of Events Recorded Time Period • We consider the following 5 types of devices during this presentation: • Firewalls • Mail servers • Business critical infrastructure • Wireless services • Active directory 11
  14. Examples of events Device Type Example of Events Firewall Connection

    attempts Admin login success or failure Alert messages Mail Server Successful user login Failed login attempts Rejected due to spam Invalid user Business Critical Infrastructure Invalid attempts at logical access Initialization and removal of system-level objects Requested action requires root privileges Wireless Services New client joins and access point (AP) AP detects device packet flood attempts Administrator logged in Microsoft Active Directory All authentication attempts 12
  15. About the plots... • Exact dates and times of events

    or incidents have been redacted throughout this document for operational security • Y-axis represents average events per second in an hour • Granularity of the collected EPS data is 60 minutes • Hourly EPS data exhibits multiple seasonal patterns • EPS data is expected to be of higher magnitude during hours of peak usage 13
  16. Hourly EPS data for border firewall 0 50 100 150

    200 250 300 10000 15000 20000 25000 Hours Events per Second (Border Firewall) 14
  17. Hourly EPS data for mail services 0 50 100 150

    200 250 300 400 600 800 1000 1400 Hours Events per Second (Mail Services) 15
  18. Hourly EPS data for active directory 0 50 100 150

    200 250 300 100 150 200 250 Hours Events per Second (Microsoft Active Directory) 16
  19. Hourly EPS data for wireless services 0 50 100 150

    200 250 300 200 400 600 800 Hours Events per Second (Wireless Services) 17
  20. Hourly EPS data for business critical infrastructure 0 50 100

    150 200 250 300 40 60 80 100 120 Hours Events per Second (Business Critical Infrastructure) 18
  21. What we were looking for? The algorithm should: • be

    able to handle complex seasonal patterns in the data: intra-daily and intra-weekly • complete predictive modeling within the time constraints on a production server • be able to accurately predict the next 24 hours based on limited past data (2 to 4 weeks) 20
  22. TBATS • Exponential smoothing state space model, Box-Cox ... •

    Developed by Hyndman et al. and available in the R forecast package • Handles complex seasonalities well • Fast in generating predictions for our data • Scalable 21
  23. Algorithm Input: 336 EPS values (each hour of last 14

    days) Output: 24 EPS predictions (each hour of next day) LOOP Process 1: for every 24 hours do 2: data = read (hourly EPS data for last 14 days) 3: if (missing data value in data) then 4: missing data value = 0 5: end if 6: seasonal periods = create seasons (data, seasonal periods = 24, 168) 7: model = tbats(seasonal periods) 8: forecasted values = forecast (model, next 24 values) 9: output (forecasted values) 10: end for 11: return 23
  24. Algorithm Input: Forecasted EPS values from algorithm 1 Output: Alerts

    LOOP Process 1: for every hour of day do 2: read (forecasted EPS value for that hour) 3: calculate thresholds on forecasted EPS value for that hour 4: if (observed EPS value > upper threshold on forecasted value) then 5: alert_personnel() 6: end if 7: if (observed EPS value < lower threshold on forecasted value) then 8: alert_personnel() 9: end if 10: end for 11: return 24
  25. Setting the alert threshold • Forecasted values are never perfect

    • Alert threshold keeps false positives in check (and avoid alert fatigue) • Function of the environment’s tolerance for number of alerts per day • Set by security personnel familiar with the environment • Tradeoff between false positives and false negatives depending on the threshold 25
  26. Actual observations against predictions - border firewall 0 200 400

    600 800 1000 1200 10000 20000 30000 Time (Hours) Events per Second (Border Firewall) Actual Predicted Case investigation 26
  27. Actual observations against predictions - critical infrastructure 0 200 400

    600 800 1000 1200 0 500 1000 1500 2000 2500 3000 Time (Hours) Events per Second (Business Critical Infrastructure) Actual Predicted 27
  28. Actual observations against predictions - mail services 0 200 400

    600 800 1000 1200 500 1000 2000 3000 Time (Hours) Events per Second (Mail Services) Actual Predicted 28
  29. Actual observations against predictions - wireless services 0 200 400

    600 800 1000 1200 0 200 400 600 800 Time (Hours) Events per Second (Wireless Services) Actual Predicted 29
  30. Actual observations against predictions - active directory 0 200 400

    600 800 1000 1200 200 300 400 500 600 700 Time (Hours) Events per Second (Microsoft Active Directory) Actual Predicted Case investigation 30
  31. Result • TBATS was able to accurately model our data

    with two inherent seasonalities • Forecasts were fairly accurate except for anomalous conditions that needed investigation Let us dive into these anomalous events! 31
  32. False positives • Scheduled activity that occurs every month •

    example: massive spike in EPS data pertaining to critical infrastructure • alerts can be suppressed for such days and times • sophisticated attackers could focus on such days and times to masquerade their attacks 32
  33. False negatives What did we miss? • Events have to

    be noisy enough to cause a spike at the macro level • This methodology will miss clever, quiet attacks! 33
  34. True positives We discovered a lot of interesting events! •

    These would otherwise be lost in the wires • Following anomalous activity counts as a true positive: • Errors, changes, failures, and performance issues • Special events or abnormal use (e.g. football game on campus causing flash crowds) • Measurement issues (problems with data collection) • Security incidents Each of these require a response! 34
  35. Examples of true positives Border Firewall • Notice the anomaly

    in the highlighted region Jump to figure • DDoS attack: send malicious packets to overload the border firewall’s session table • Firewall denies the traffic and logs events 35
  36. Examples of true positives Business Critical Infrastructure • Logging software

    suffered an error Jump to figure • Relentlessly contributed the same error message until restarted • Alerts sent by our model drew attention to the logging failure within an hour 35
  37. Examples of true positives Active Directory • Observed EPS values

    dropped significantly and surpassed the lower threshold causing an alert Jump to figure • One of the log agents in the SIEM architecture had stopped contributing logs 35
  38. Examples of true positives Wireless services • Flash crowds during

    a childrens’ camp on campus Jump to figure • Unexpected peaks in EPS values 35
  39. Conclusion • We deployed an available R forecasting algorithm to

    predict security trends for the next hour • Deviations were reported, if found, to personnel automatically every hour • TBATS worked well for the multiple seasonalities inherent in our data • Adjusting thresholds allowed fine tuning alerts and controlling false positives • Raised alarms within 60 minutes of the first sign of malicious activity • Scalability of this approach allowed us to cover 16 categories of devices across campus • We plan to introduce more complex seasonalities (e.g. month of the year) 36
  40. Thank you! • AI Village organizers • For the support!

    • Michigan State Infosec Team • Tyler Olsen • Nicholas Oas • Seth Edgar • Rob McCurdy  Questions  @amirootyet 37