• Identify and appraise technology and their impacts • HTA studies Individual, as well as population based outcomes • HTA is about both desired and adverse outcomes • Synthesise information to enable policy and regulatory approaches 2
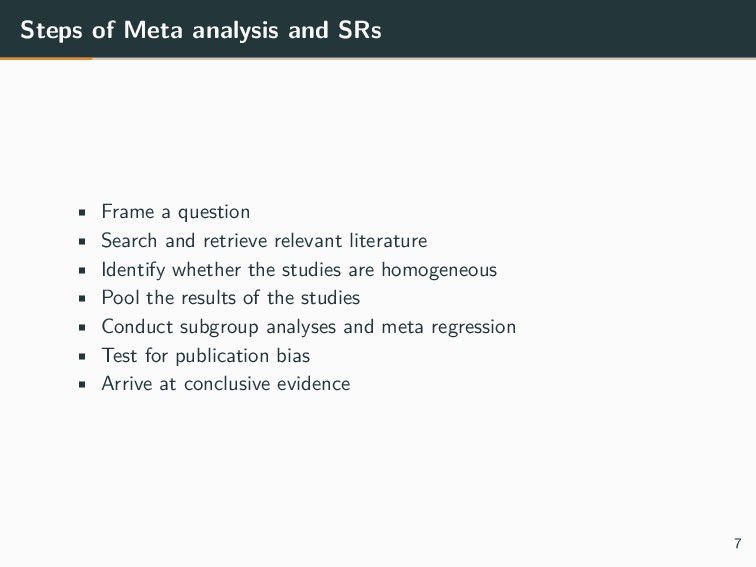
• Search and retrieve relevant literature • Identify whether the studies are homogeneous • Pool the results of the studies • Conduct subgroup analyses and meta regression • Test for publication bias • Arrive at conclusive evidence 7
that helps to manage evidence • Evidence Portfolio = Quality of Evidence + Summary of Findings • Use the Evidence Portolio to develop Recommendations 8
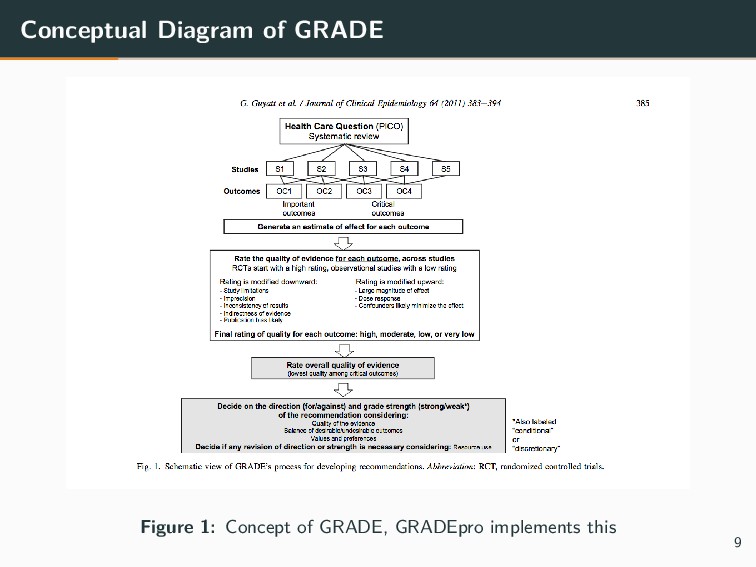
on outcomes across studies • Quality of evidence is for pairs of outcomes and interventions • We also use an intervention and an alternative (placebo?) 10
the outcome • Assign a score to the outcome from 0-9 • 0-3 = not important, 4-6=important, 7-9 = critical • Build a consensus among the team to assign importance scores • For each outcome, assimilate studies 11
an evidence profile • Evidence Profile = Appraise Quality of Evidence + Summary of Findings • Assess the Summary of Findings for the body of evidence • Assign an importance score • Assimilate these information for recommendation 14
• 4 pluses = Very high,3 pluses = High, 2 pluses = Moderate, 1 plus = Low • Very high = We have very high confidence that the results are true effects and additional studies will add little • High = We are confident that the results are true effects and further studies • Moderate = Additional studies may be needed • Low = Our confidence in the evidence is low and we need further evidence 15
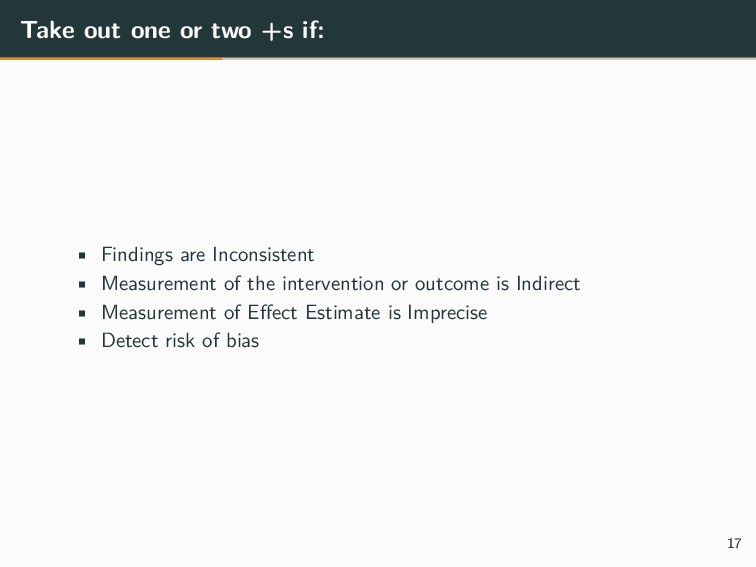
with the study design • If RCT or Experimental Study designs, we assign 4 + • If Observational Study designs, we assign 3 + to start with • We assign penalties (take out one or two +s) on 4 counts • We award points (add one or two +s) on 3 counts • If it is a meta analysis of RCTs, then we start with 4+s • If it is a systematic review or meta analysis of Observational study designs, we start with 3 +s 16
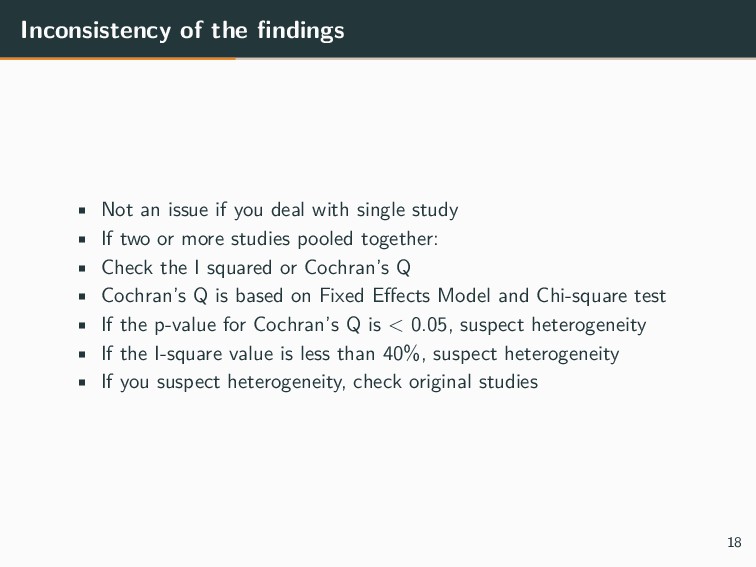
deal with single study • If two or more studies pooled together: • Check the I squared or Cochran’s Q • Cochran’s Q is based on Fixed Effects Model and Chi-square test • If the p-value for Cochran’s Q is < 0.05, suspect heterogeneity • If the I-square value is less than 40%, suspect heterogeneity • If you suspect heterogeneity, check original studies 18
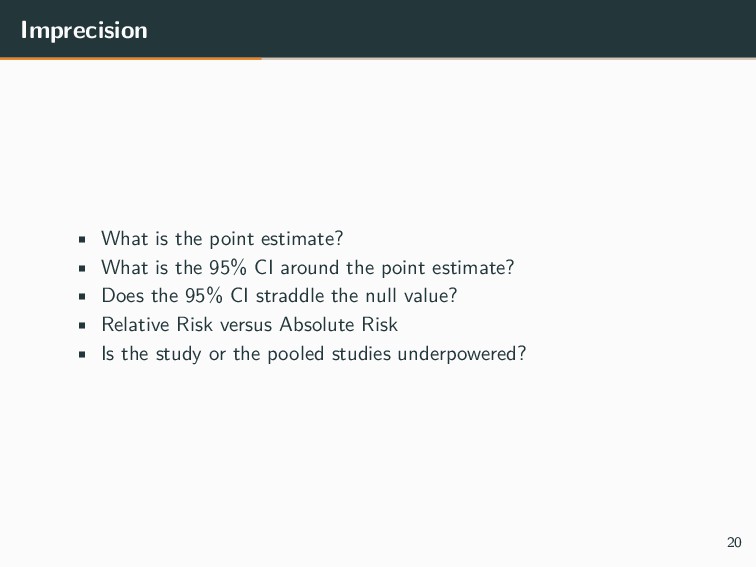
the 95% CI around the point estimate? • Does the 95% CI straddle the null value? • Relative Risk versus Absolute Risk • Is the study or the pooled studies underpowered? 20
the beginning of the study? • Did the authors use intention to treat analysis? • How did the authors select participants for observational studies? • How did the authors measure outcomes for observational studies? • Did they report publication bias for meta analysis? 21
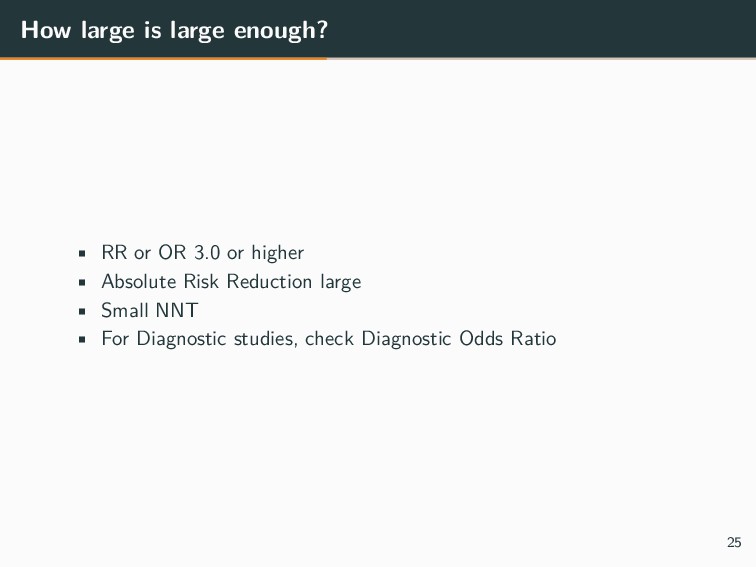
effect size is large enough • If you find the authors adjusted for all plausible confounding variables • If you find authors reported dose response effect 24
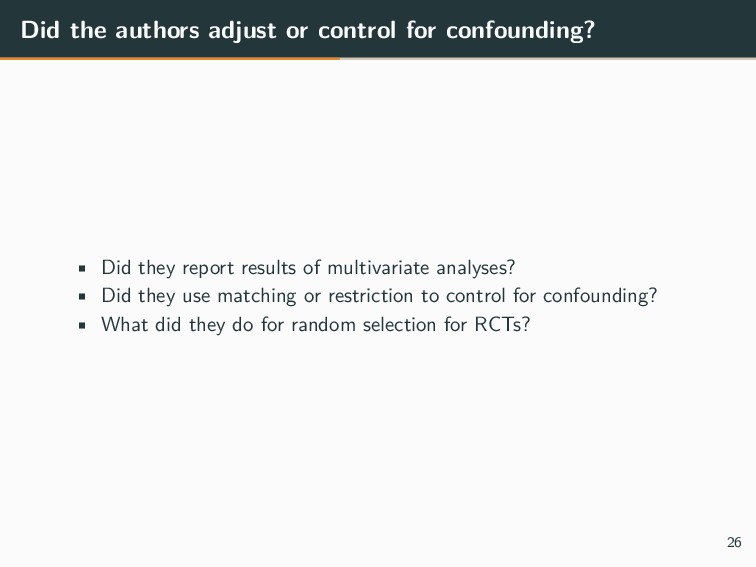
they report results of multivariate analyses? • Did they use matching or restriction to control for confounding? • What did they do for random selection for RCTs? 26
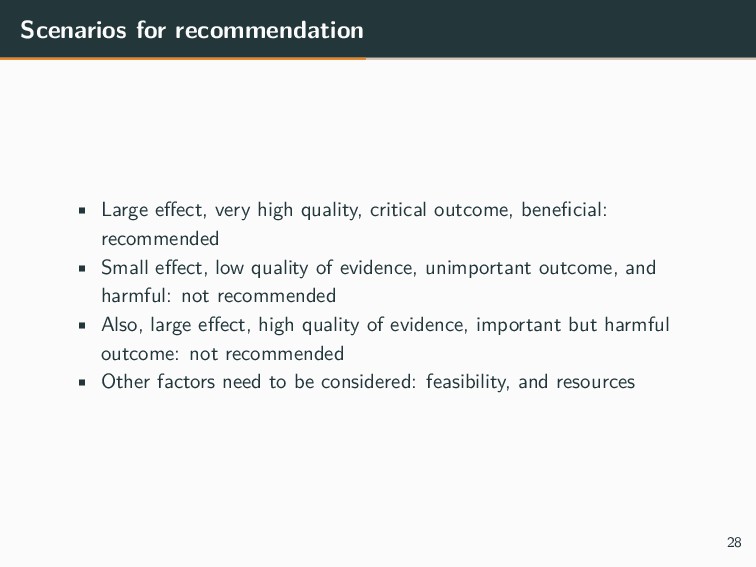
outcome, beneficial: recommended • Small effect, low quality of evidence, unimportant outcome, and harmful: not recommended • Also, large effect, high quality of evidence, important but harmful outcome: not recommended • Other factors need to be considered: feasibility, and resources 28
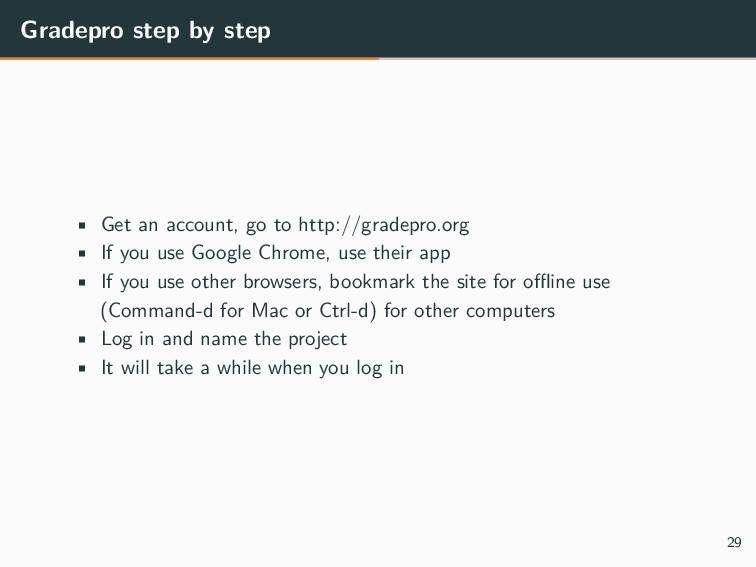
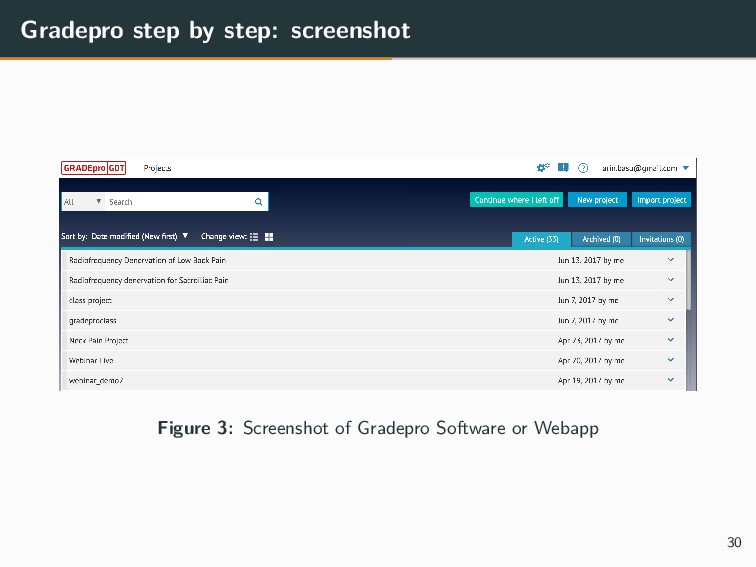
http://gradepro.org • If you use Google Chrome, use their app • If you use other browsers, bookmark the site for offline use (Command-d for Mac or Ctrl-d) for other computers • Log in and name the project • It will take a while when you log in 29
• Click Me to Download or view the Systematic Review for the HTA • Reference information: Piso B, Reinsperger I, Rosian K. Radiofrequency denervation for sacroiliac and facet joint pain. Decision Support Document No. 99; 2016. Vienna: Ludwig Boltzmann Institute for Health Technology Assessment. 34
on the box to start a new project • Type the name of the new project • We will type: “Radiofrequency denervation for Low Back Pain” • We will next select: “Evidence Profile” for the type of project • Hit Apply and it will bring up the next window 35
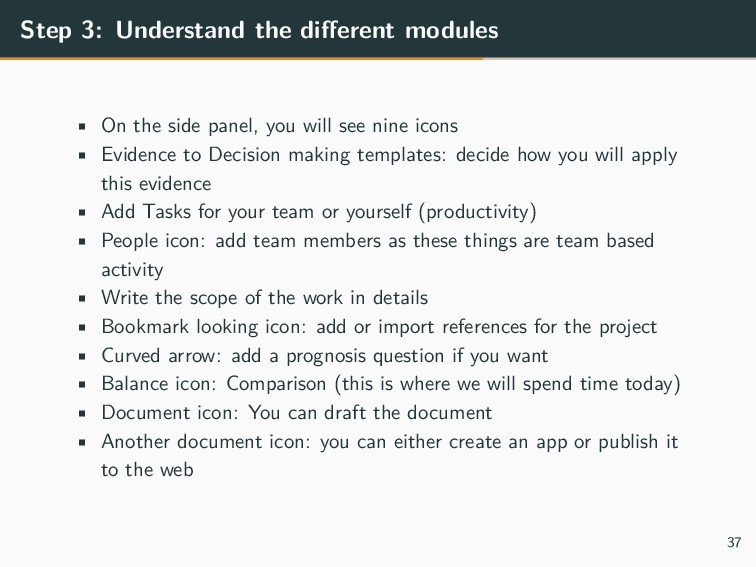
panel, you will see nine icons • Evidence to Decision making templates: decide how you will apply this evidence • Add Tasks for your team or yourself (productivity) • People icon: add team members as these things are team based activity • Write the scope of the work in details • Bookmark looking icon: add or import references for the project • Curved arrow: add a prognosis question if you want • Balance icon: Comparison (this is where we will spend time today) • Document icon: You can draft the document • Another document icon: you can either create an app or publish it to the web 37
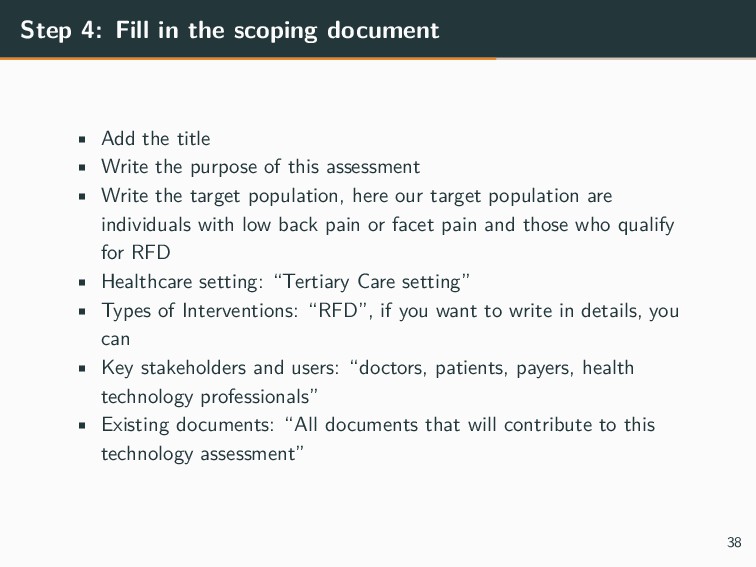
title • Write the purpose of this assessment • Write the target population, here our target population are individuals with low back pain or facet pain and those who qualify for RFD • Healthcare setting: “Tertiary Care setting” • Types of Interventions: “RFD”, if you want to write in details, you can • Key stakeholders and users: “doctors, patients, payers, health technology professionals” • Existing documents: “All documents that will contribute to this technology assessment” 38
Question • This is confined to comparison of two approaches only • If RFD versus Placebo, then that’s one • RFD versus standard treatment should be another • These would be two different management questions • You can add two questions • You can add more, depending on the outcomes as well • Skip the outcomes module at the moment 39
denervation” vs • “Placebo” for • “Low back pain” • Click on the “save” icon to save the question • You can add as many questions as you want • If we had a team that approved our questions, then they would show up here automatically, here we have to add them manually • Setting: “Private Practice” • If we have a list of articles to work from we add it here • Then we click on the save icon to save the question • You can drag the question to a Group so that if you have many groups e.g., for low back pain relief or quality of life, you can add many questions to these groups; depending on your concepts 41
This will bring up the Quality Assessment and Summary of Findings panels • Click on Add Outcome to Add Outcome Manually • If you have another GRADEpro project or if you use Revman5, the Cochrane Collaboration Meta Analysis, you can import outcomes from these sources • You can add as many outcomes as you want, but Gradepro authors insist at most adding seven outcomes (I do not know the reason why) 42
Name the outcome: “Pain Relief” • Short Name: “Pain Relief”, if you have longer name, this is the place to make it short • Assessed or Measured with: “Visual Analog Scale” • Length of Follow up: this is optional 43
you will only include follow up studies, either RCTs or Cohort Studies or Other follow up studies • You can add a single study or you can add a systematic review • You will work on the basis of outcomes, not on the basis of individual studies or collected group of studies • The last point is important • To keep things simple, for our rapid meta-analysis based appraisal, we leave this blank 44
this is for a single outcome, you have three choices - your outcome can be dichotomous, that is binary, yes or no • Dead/Alive, Recovered/Not, etc • It can be continuous, measured on a scale (it does not get finer in details than this) • It can be narrative for those cases where you do not have a number to report – qualitative • For us, we tick: “continuous” • Next six radio buttons: “pooled” if you deal with meta analysis, “not pooled” if you deal with many studies and you decide you will use Median or Mean or other measures yourself rather than statistical pooling, and the rest of the buttons are self explanatory • We select: “pooled” as we will work on the basis of this meta-analysis 45
of studies: depends on the outcome you study as even within a meta-analysis, you will see varying number of studies pooled together for a particular outcome • For us: “6”; refer to page 10 of the research paper • Study Design: refers to the type of study on which you base your evidence synthesis. Here, in the meta-analysis, we dealt with RCTs • Risk of Bias: If you work with meta-analysis, you will need to check whether the authors reported the risk of bias of individual studies on which the report is based. If they have done, OK, else, you will have to do them yourself • for us: “Half of the trials had high risk of bias”, so we will say, “serious” • It will ask you to add an explanation: add explanations but restrict to 1000 characters 46
“not serious”, if not: • for meta-analysis, check for heterogeneity statistics • Rule of thumb: heterogeneity measured by Q-statistics or I-square • If I-square is 0% or less than 30%, inconsistency is not serious; if not, read the original papers to decide for yourself • If it is not reported, you can conduct your own statistical procedures, or state, “serious” 47
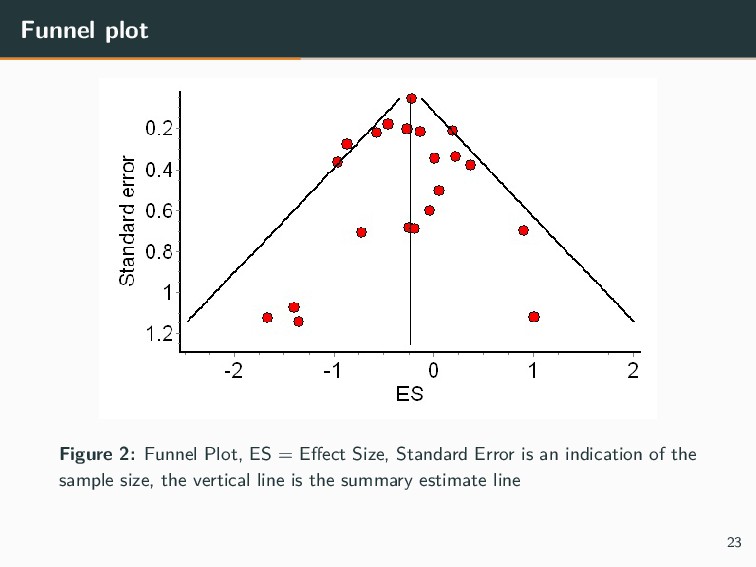
there publication bias? • Check if the authors have included a funnel plot • If they haven’t, then you will need to create your own funnel plot • Would confounding variables reduce the effect estimate? 50
number of participants in each arm • The effect estimate • Quality Score is already filled in • Fill in the level of importance of this particular outcome • For us: we will tabulate results till the one month of follow up 51
patients in the treatment arm: • Number of patients in the placebo arm: • As the measures were continuous, hence the programme selects “Absolute Measures of Risk” • Estimate of the Effect: “MD” of -1.47 • 95%CI confidence limits from -2.28 to 0.67 52
interventions or diagnostic tests • It only allows for head to head comparisons of two interventions • Lets you conduct part of a full HTA • You have to use other tools for cost effectiveness analysis 56
quality appraisal criteria • You can mix and match as many studies as you want • You can use different studies in the same scope • You can have different sets of outcomes 57