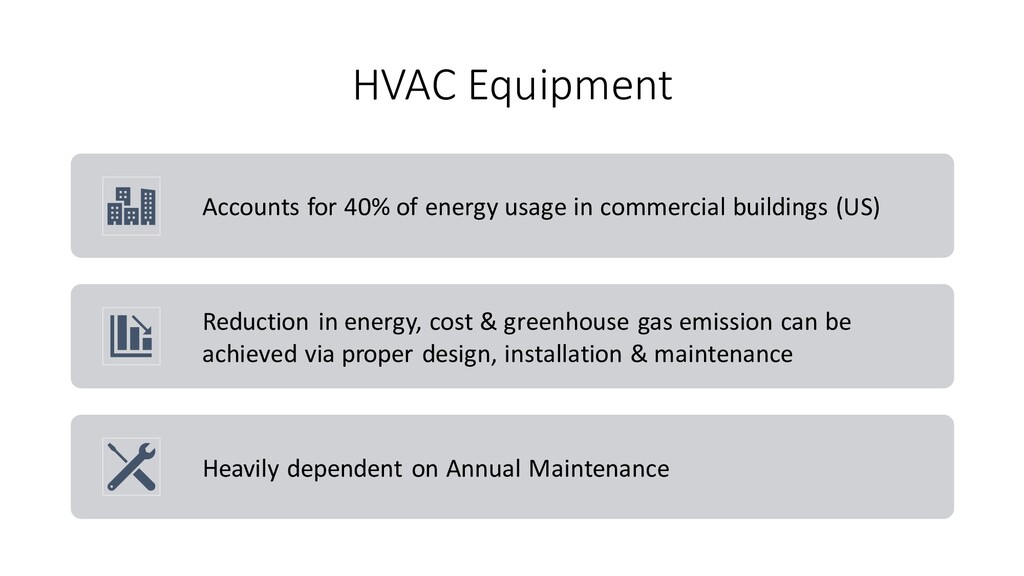
buildings (US) Reduction in energy, cost & greenhouse gas emission can be achieved via proper design, installation & maintenance Heavily dependent on Annual Maintenance
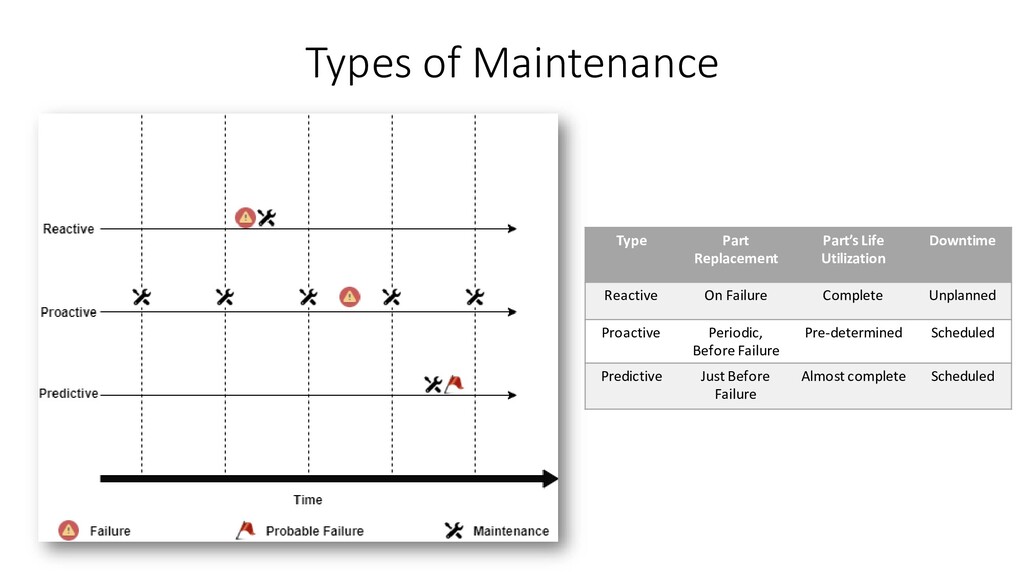
Reactive On Failure Complete Unplanned Proactive Periodic, Before Failure Pre-determined Scheduled Predictive Just Before Failure Almost complete Scheduled
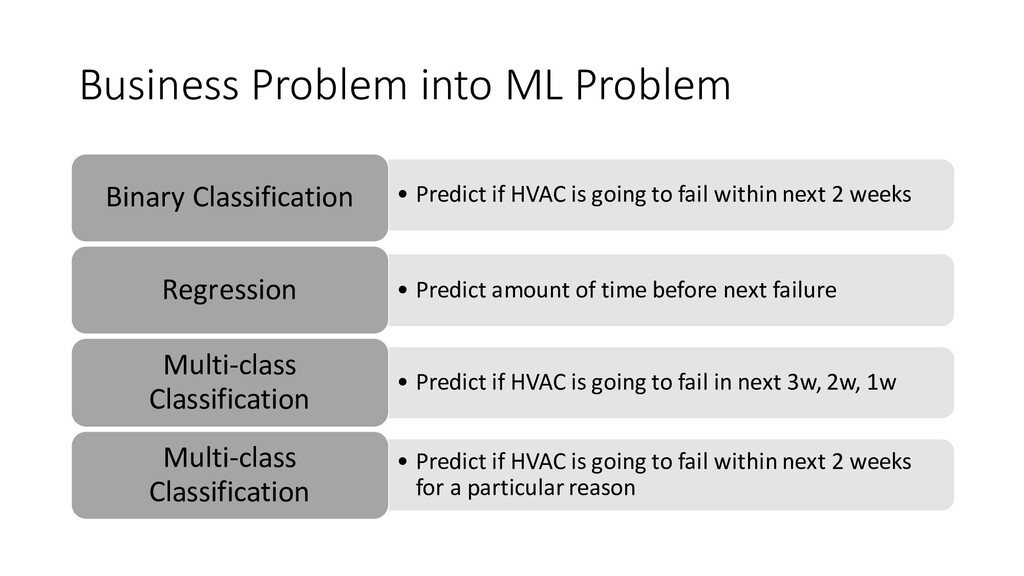
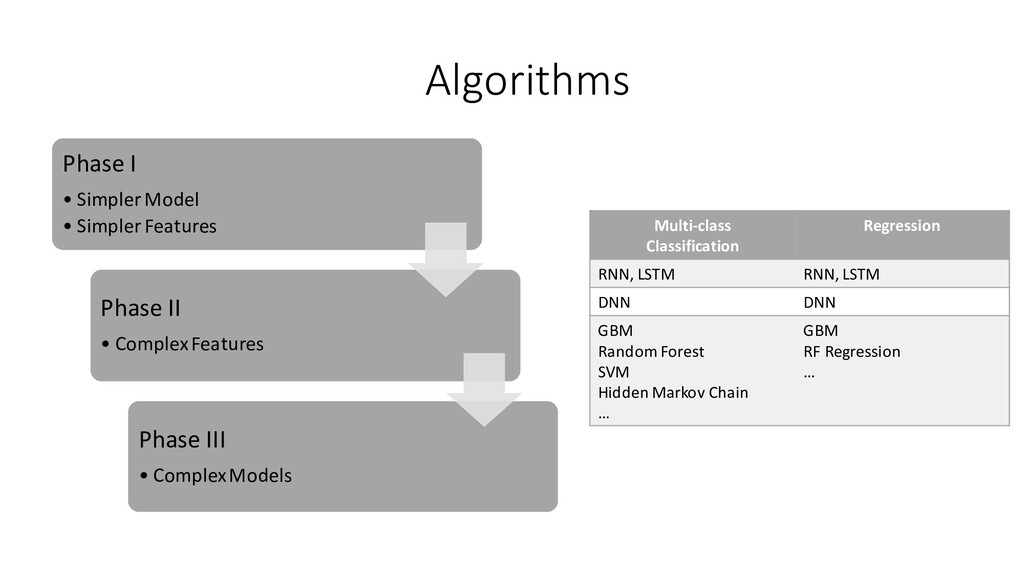
going to fail within next 2 weeks Binary Classification • Predict amount of time before next failure Regression • Predict if HVAC is going to fail in next 3w, 2w, 1w Multi-class Classification • Predict if HVAC is going to fail within next 2 weeks for a particular reason Multi-class Classification
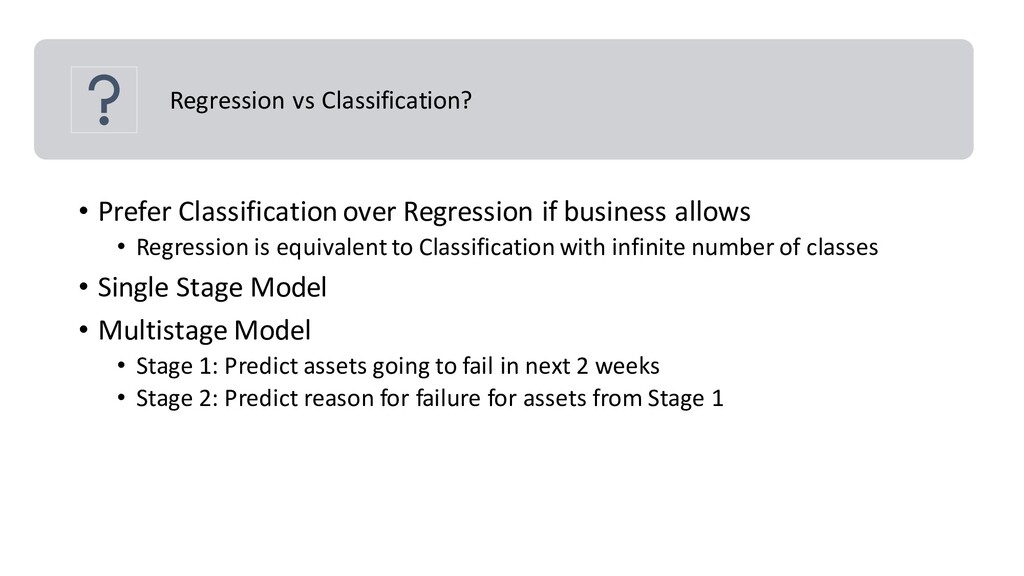
allows • Regression is equivalent to Classification with infinite number of classes • Single Stage Model • Multistage Model • Stage 1: Predict assets going to fail in next 2 weeks • Stage 2: Predict reason for failure for assets from Stage 1
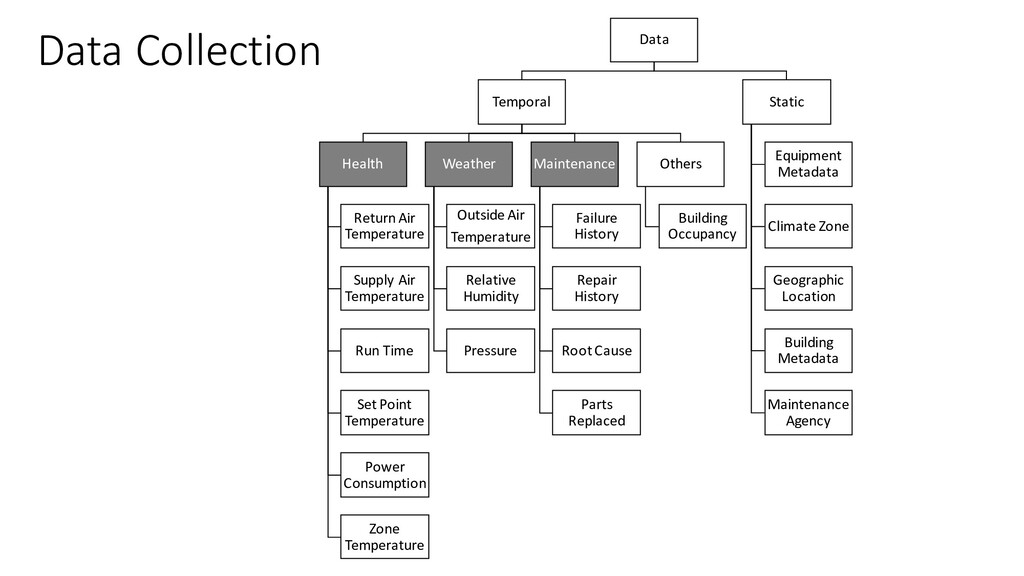
Time Set Point Temperature Power Consumption Zone Temperature Weather Outside Air Temperature Relative Humidity Pressure Maintenance Failure History Repair History Root Cause Parts Replaced Others Building Occupancy Static Equipment Metadata Climate Zone Geographic Location Building Metadata Maintenance Agency Data Collection
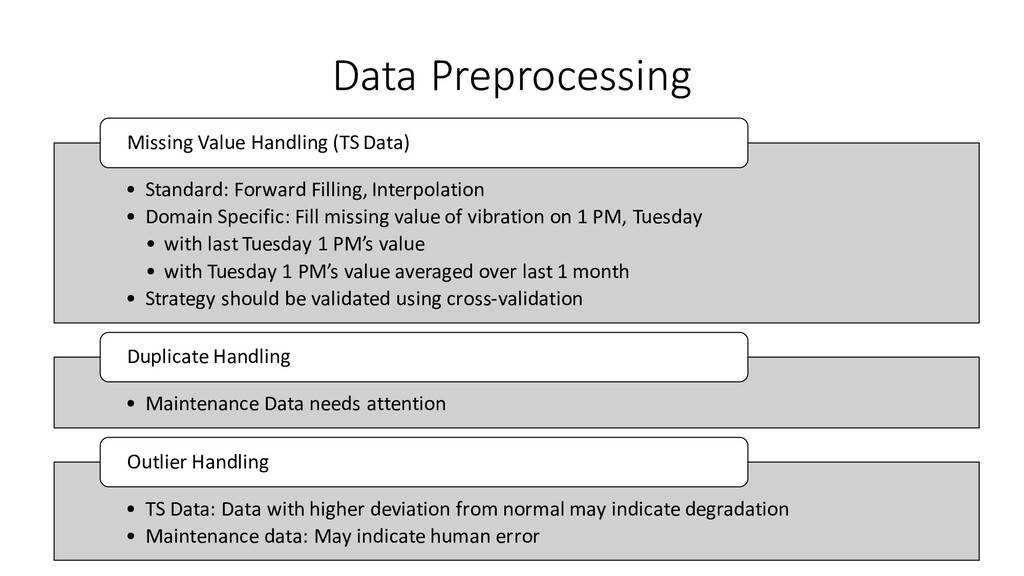
value of vibration on 1 PM, Tuesday • with last Tuesday 1 PM’s value • with Tuesday 1 PM’s value averaged over last 1 month • Strategy should be validated using cross-validation Missing Value Handling (TS Data) • Maintenance Data needs attention Duplicate Handling • TS Data: Data with higher deviation from normal may indicate degradation • Maintenance data: May indicate human error Outlier Handling Data Preprocessing
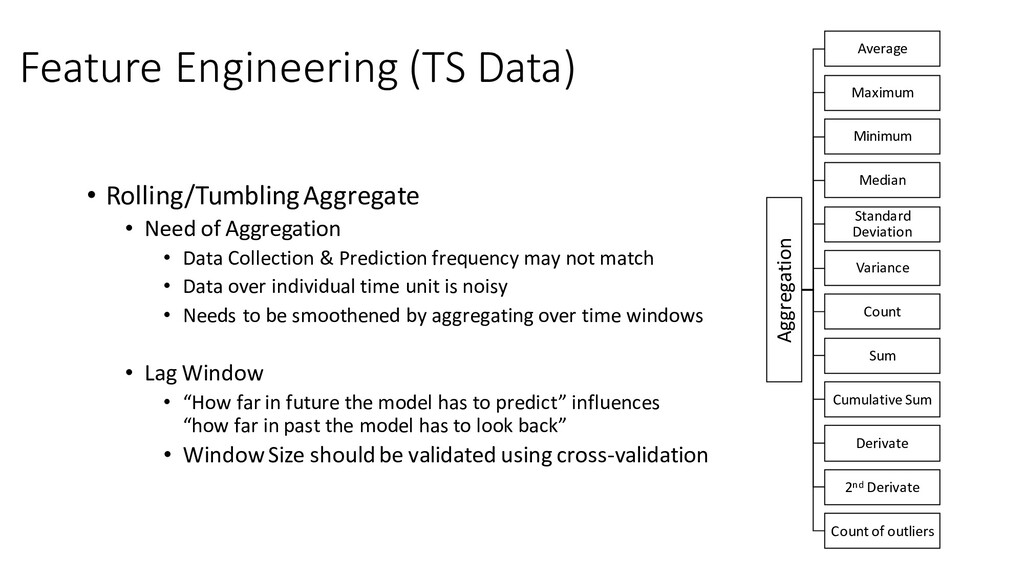
Aggregation • Data Collection & Prediction frequency may not match • Data over individual time unit is noisy • Needs to be smoothened by aggregating over time windows • Lag Window • “How far in future the model has to predict” influences “how far in past the model has to look back” • Window Size should be validated using cross-validation Aggregation Average Maximum Minimum Median Standard Deviation Variance Count Sum Cumulative Sum Derivate 2nd Derivate Count of outliers
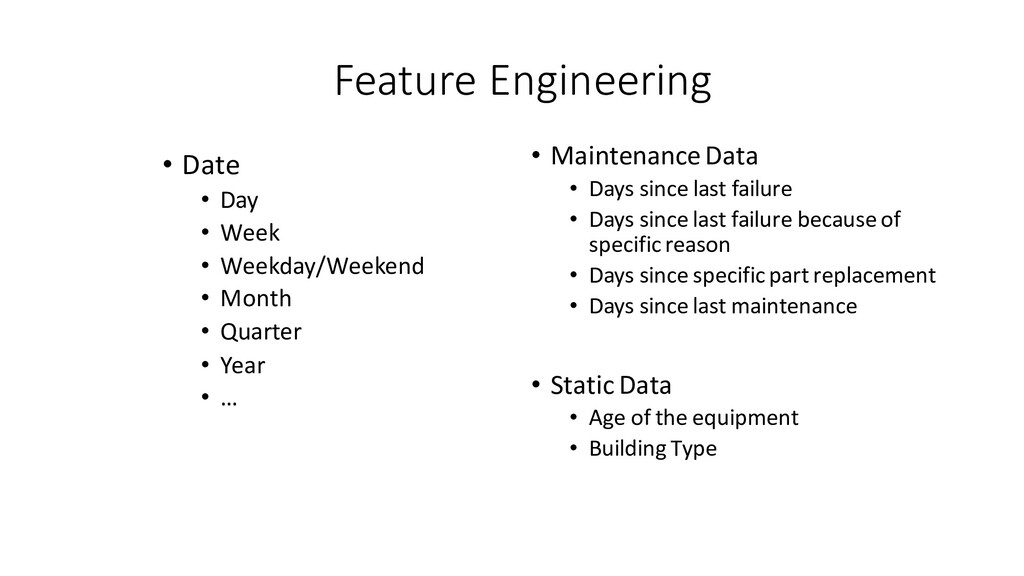
• Month • Quarter • Year • … • Maintenance Data • Days since last failure • Days since last failure because of specific reason • Days since specific part replacement • Days since last maintenance • Static Data • Age of the equipment • Building Type
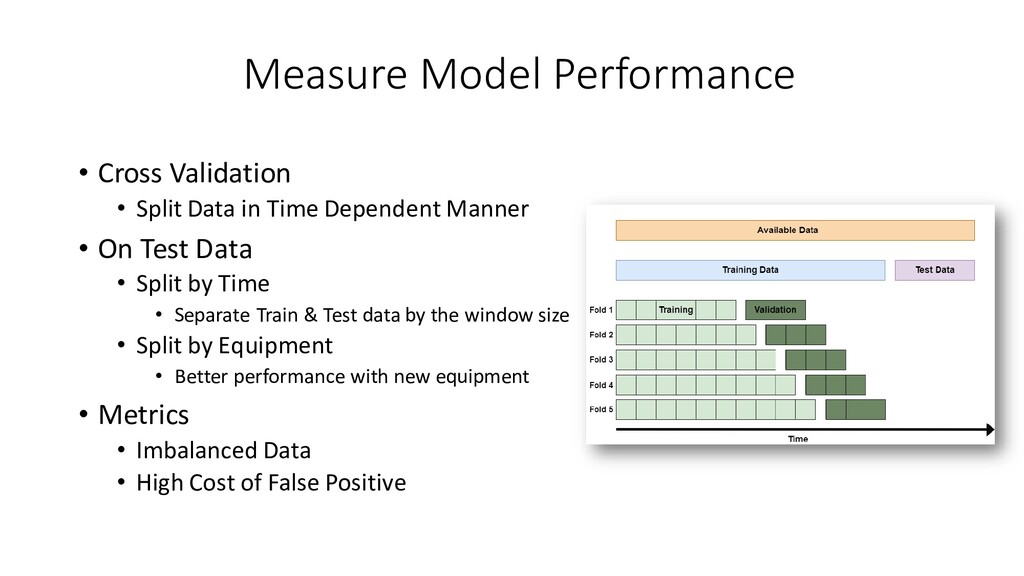
• On Test Data • Split by Time • Separate Train & Test data by the window size • Split by Equipment • Better performance with new equipment • Metrics • Imbalanced Data • High Cost of False Positive Measure Model Performance
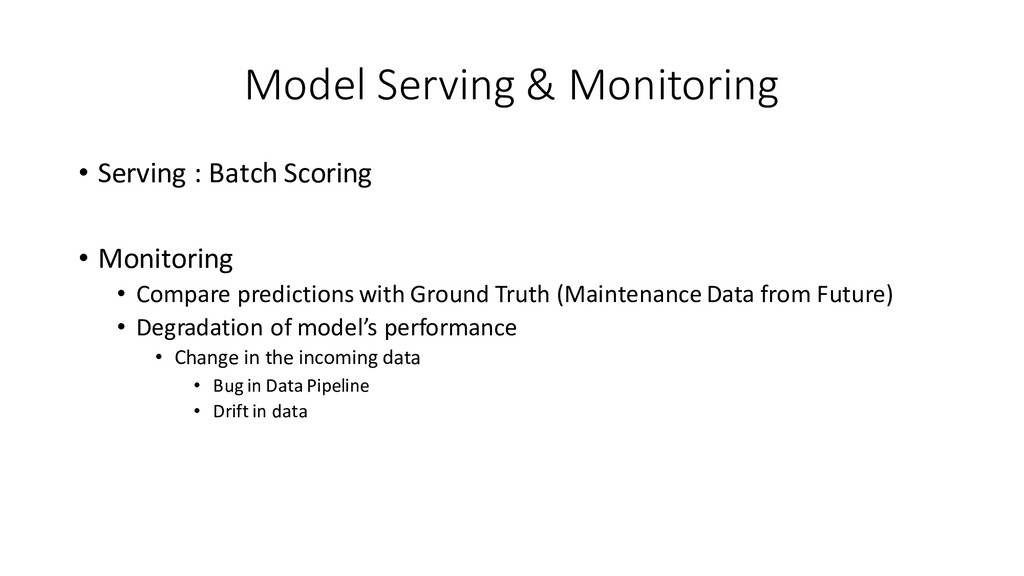
Monitoring • Compare predictions with Ground Truth (Maintenance Data from Future) • Degradation of model’s performance • Change in the incoming data • Bug in Data Pipeline • Drift in data