Upgrade to Pro — share decks privately, control downloads, hide ads and more …

A Comparison of Three Algorithms for Computing Truck Factors (ICPC 2017)

A Comparison of Three Algorithms for Computing Truck Factors (ICPC 2017)

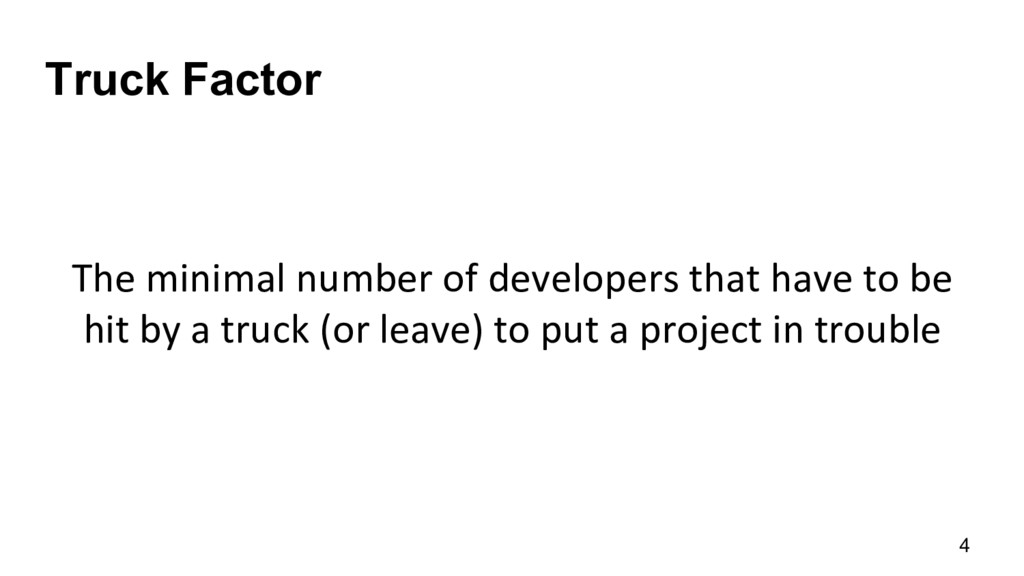
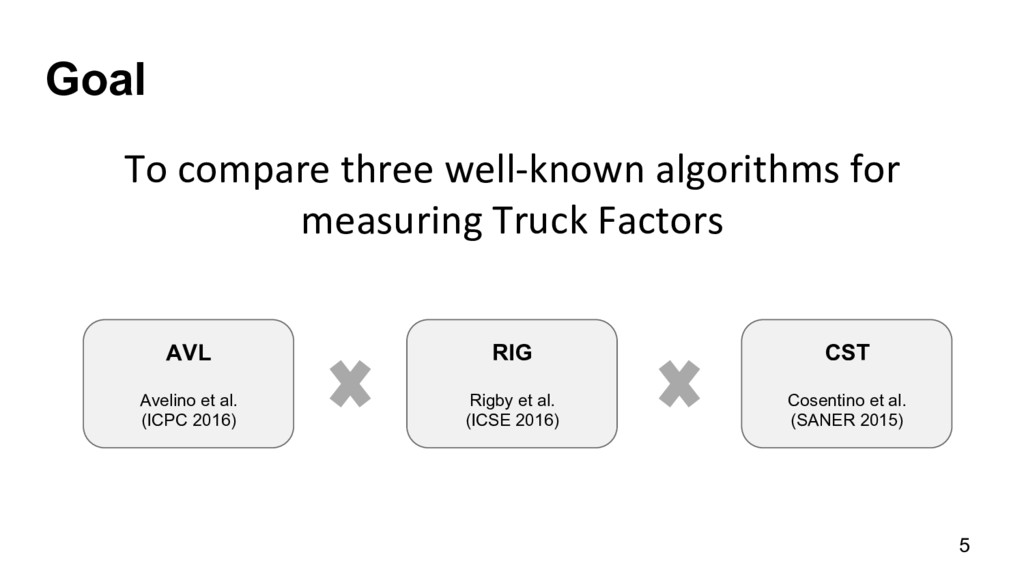
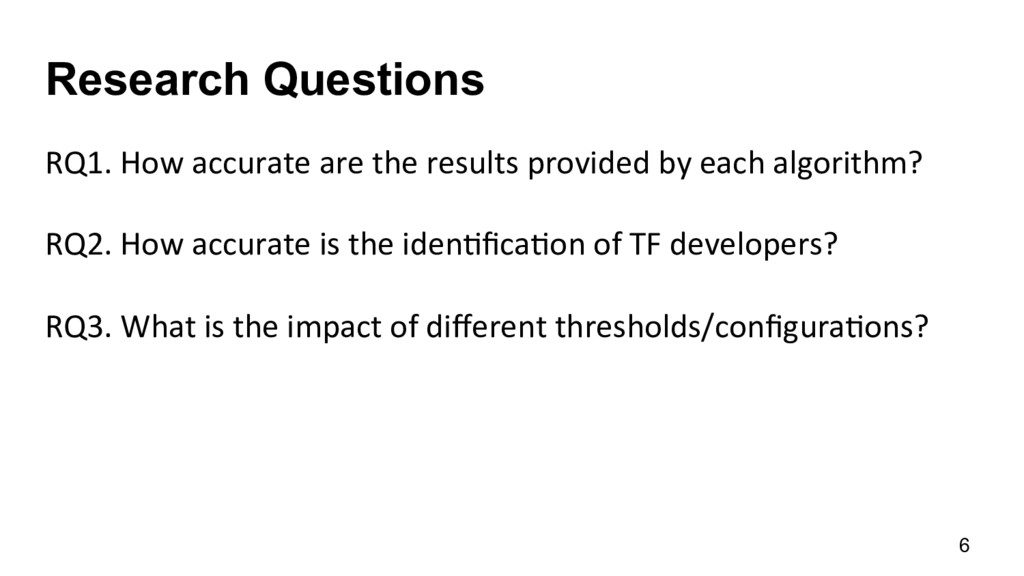
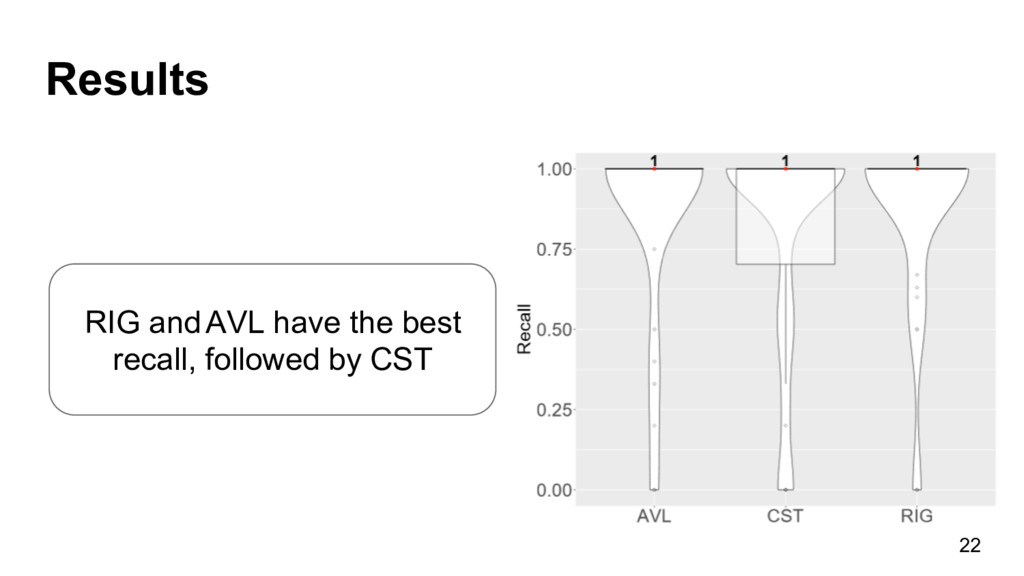
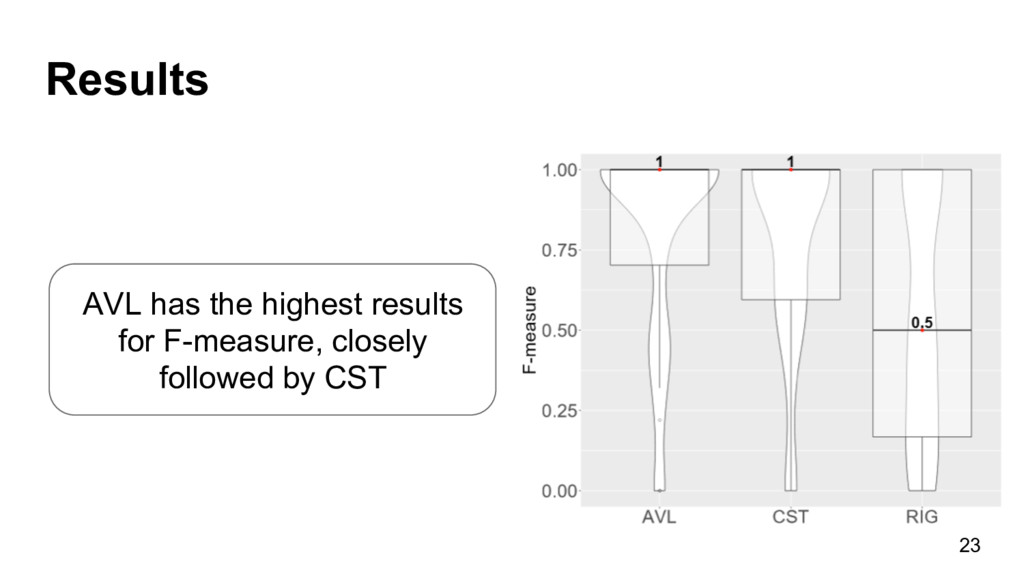
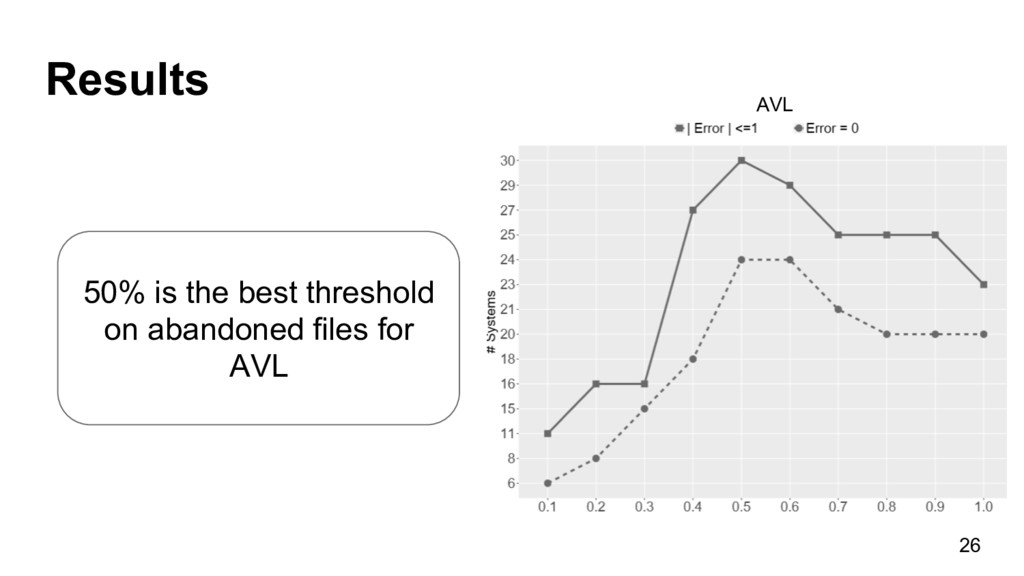
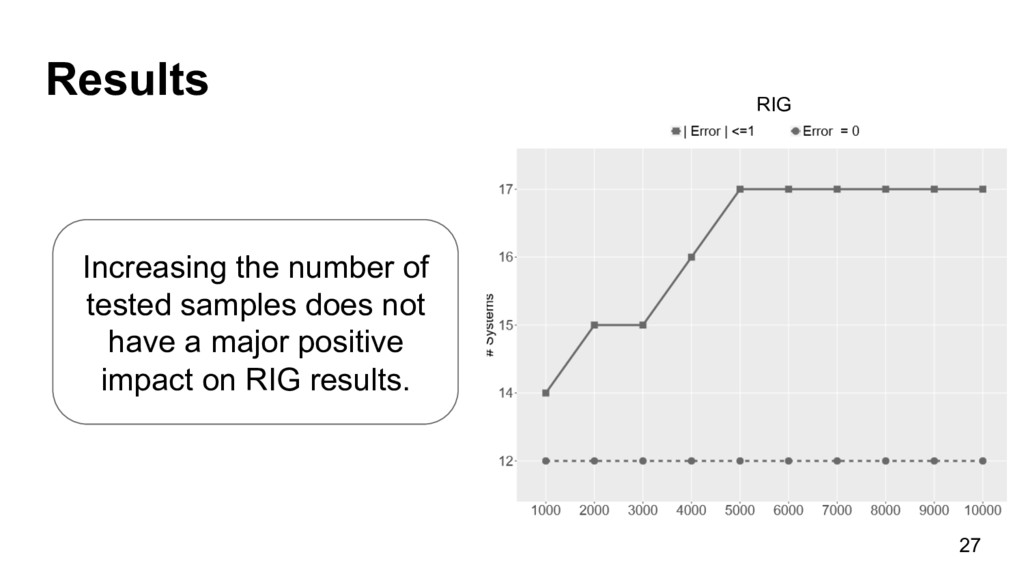
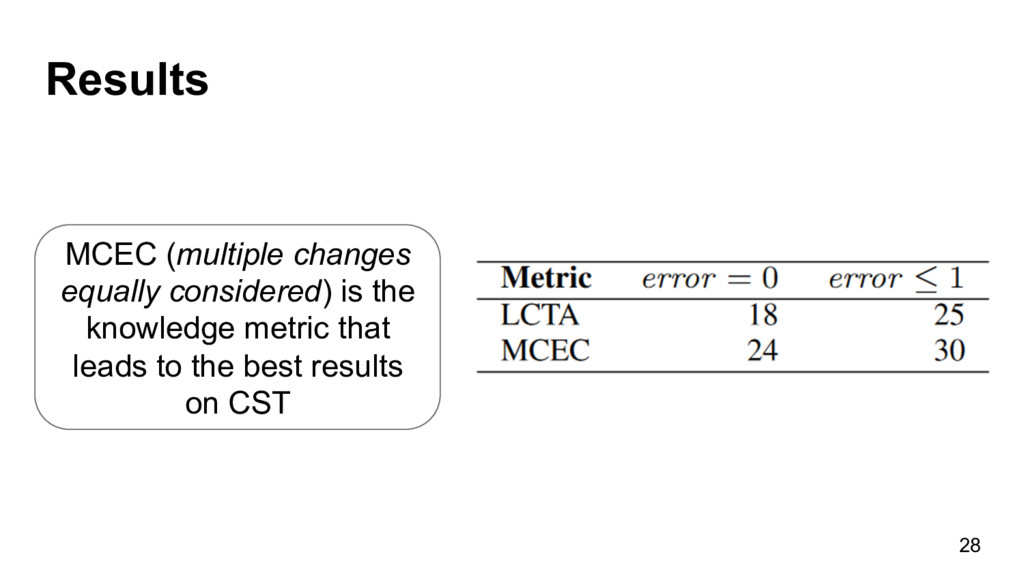
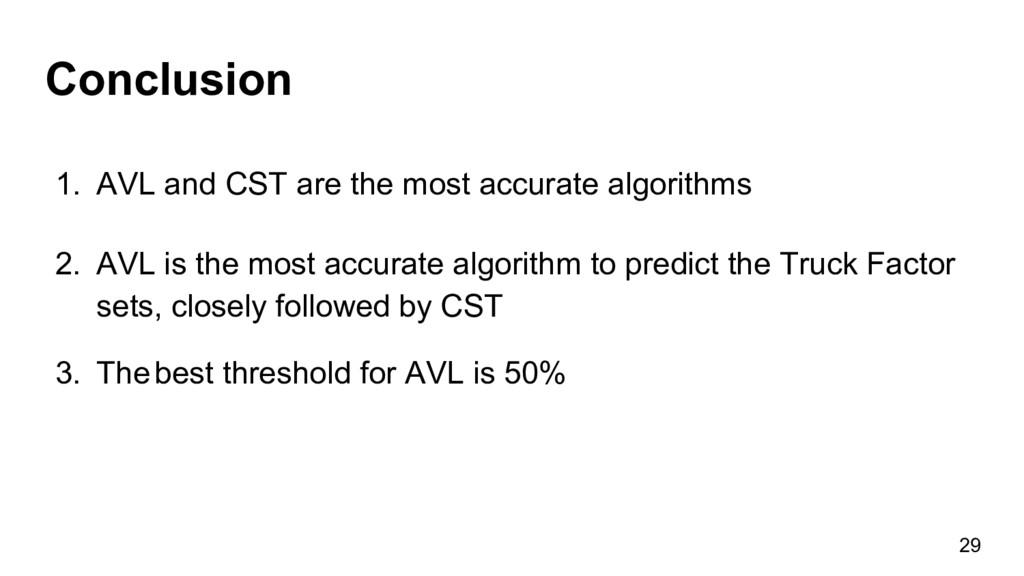
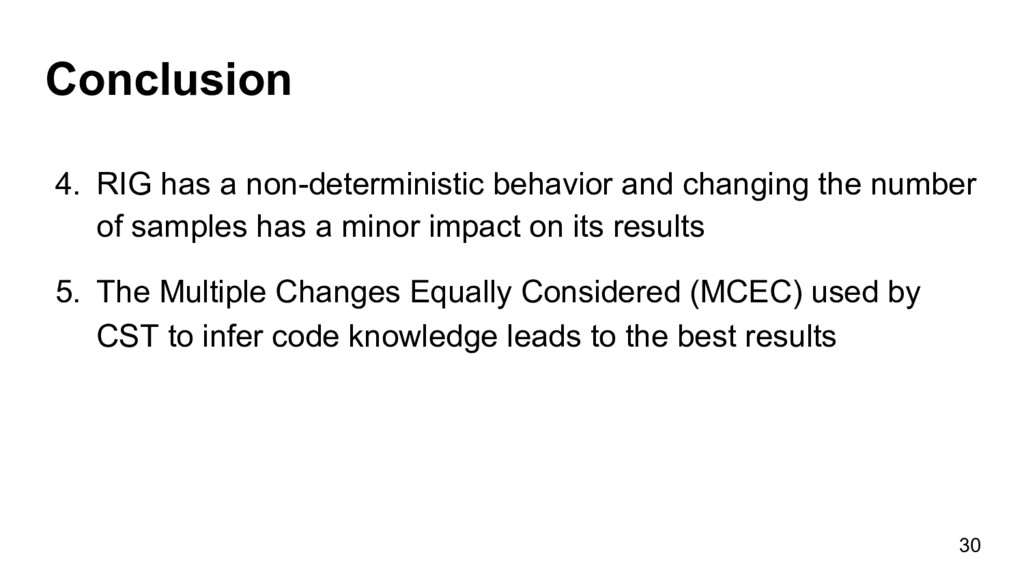
Truck Factor (also known as Bus Factor or Lottery Number) is the minimal number of developers that have to be hit by a truck (or leave) before a project is incapacitated. Therefore, it is a measure that reveals the concentration of knowledge and the key developers in a project. Due to the importance of this information to project managers, algorithms were proposed to automatically compute Truck Factors, using maintenance activity data extracted from version control systems. However, to the best of our knowledge, we still lack studies that compare the accuracy of the results produced by such algorithms. Therefore, in this paper, we evaluate and compare the results of three Truck Factor algorithms. To this end, we empirically determine the truck factors of 35 open-source systems by consulting their developers. Our results show that two algorithms are very accurate, especially when the systems have a small Truck Factor. We also evaluate the impact of different thresholds and configurations in algorithm results.

ASERG, DCC, UFMG

May 23, 2017
Tweet

More Decks by ASERG, DCC, UFMG

Other Decks in Research

Transcript

  1. A Comparison of Three Algorithms for
    Computing Truck Factors
    Mívian Ferreira¹, Marco Tulio Valente¹ and Kecia Ferreira²
    ¹UFMG, Belo Horizonte - Brazil
    ²CEFET-MG, Belo Horizonte - Brazil
    ICPC 2017

    View Slide

  2. “No man is an island ...”
    John Donne, 1623
    2

    View Slide

  3. How to measure knowledge
    distribution in software projects?
    3

    View Slide

  4. Truck Factor
    The  minimal  number  of  developers  that  have  to  be  
    hit  by  a  truck  (or  leave)  to  put  a  project  in  trouble  
    4

    View Slide

  5. Goal
    To  compare  three  well-­‐known  algorithms  for  
    measuring  Truck  Factors  


    5
    AVL
    Avelino et al.
    (ICPC 2016)
    RIG
    Rigby et al.
    (ICSE 2016)
    CST
    Cosentino et al.
    (SANER 2015)

    View Slide

  6. Research Questions
    RQ1.  How  accurate  are  the  results  provided  by  each  algorithm?  
     
    RQ2.  How  accurate  is  the  idenEficaEon  of  TF  developers?    
     
    RQ3.  What  is  the  impact  of  different  thresholds/configuraEons?    
    6

    View Slide

  7. AVL
    •  Greedy  heurisEc  
    •  Commit-­‐based  
    •  Uses  DOA  (Degree-­‐of-­‐Authorship)  (Fritz  et  al.  ICSE  2010,  TOSEM  2014)  
    •  Simulates  the  removal  of  the  top-­‐authors  unEl  50%  of  the  files  
    become  abandoned  
    “A Novel Approach for Estimating Truck Factors”, Avelino et al. ICPC 2016
    7

    View Slide

  8. AVL
    8

    View Slide

  9. RIG
    •  Blame  approach:  considers  the  author  who  last  changed  a  line  
    •  Abandoned  line:  a  line  last  changed  by  a  developer  who  le]  
    •  Abandoned  file:  at  least  90%  of  its  lines  are  abandoned  
     
    9
    “Quantifying and mitigating turnover-induced knowledge loss: case studies of
    Chrome and a project at Avaya”, Rigby et al. ICSE 2016

    View Slide

  10. RIG
    •  Non-­‐determinisEc  algorithm  
    •  Randomly  simulates  several  Truck  Factor  scenarios  
    10

    View Slide

  11. RIG
    11

    View Slide

  12. CST
    •  CST’s  authors  do  not  provide  a  detailed  algorithm,  but  a  tool  
    •  CST  first  computes  the  Truck  Factor  at  the  file  level  
    •  The  final  result  combines  the  Truck  Factor  of  each  file  
    12
    “Assessing the bus factor of Git repositories”, Cosentino et al. SANER 2015

    View Slide

  13. CST
    •  To compute knowledge on a file, CST considers 2 metrics:
    •  Last change takes it all (LCTA): authorship on a file is
    assigned to the last developer who modified it
    •  Multiple changes equally considered (MCEC):
    authorship on a file is assigned to the author with the
    highest number of commits
    13
    “Assessing the bus factor of Git repositories”, Cosentino et al. SANER 2015

    View Slide

  14. Dataset
    •  35 GitHub systems:
    •  6 most popular languages
    •  27 systems from AVL dataset
    •  8 new systems
    14

    View Slide

  15. Oracle of Truck Factors
    •  Survey with the main developers of the systems
    •  We only accepted responses from top 10 developers
    •  Truck Factor number and Truck Factor sets
    15

    View Slide

  16. RQ1. How accurate are the results
    provided by each algorithm?
    16

    View Slide

  17. How...
    17
    Error of TF estimated by each algorithm, compared to oracle
    values
    | Error | = TFalgorithm
    - TForacle

    View Slide

  18. Results
    18
    AVL  and  CST  are  the  
    most  accurate  
    algorithms  

    View Slide

  19. RQ2. How accurate is the identification of
    TF developers by each algorithm?
     
    19

    View Slide

  20. How...
    20
    Analysis of True Positives (TP), False Positives (FP) and
    False Negatives (FN)
    Precision = TP / (TP U FP) Recall = TP / (TP U FN)
    F-measure = (2 * P * R) / (P+R)

    View Slide

  21. Results
    21
    AVL has the highest
    precision

    View Slide

  22. Results
    22
    RIG and AVL have the best
    recall, followed by CST

    View Slide

  23. Results
    23
    AVL has the highest results
    for F-measure, closely
    followed by CST

    View Slide

  24. RQ3. What is the impact of different
    thresholds and configurations in the
    results of each algorithm?
     
    24

    View Slide

  25. How...
    •  AVL: variation of threshold on abandoned file (0.1 to 1.0)
    •  RIG: variation of the number of random samples of
    developers (1,000 to 10,000)
    •  CST: change the knowledge metrics (LCTA and MCEC)
    25

    View Slide

  26. Results
    26
    50% is the best threshold
    on abandoned files for
    AVL
    AVL

    View Slide

  27. Results
    27
    Increasing the number of
    tested samples does not
    have a major positive
    impact on RIG results.
    RIG

    View Slide

  28. Results
    28
    MCEC (multiple changes
    equally considered) is the
    knowledge metric that
    leads to the best results
    on CST

    View Slide

  29. Conclusion
    29
    1.  AVL and CST are the most accurate algorithms
    2.  AVL is the most accurate algorithm to predict the Truck Factor
    sets, closely followed by CST
    3.  The best threshold for AVL is 50%

    View Slide

  30. Conclusion
    30
    4.  RIG has a non-deterministic behavior and changing the number
    of samples has a minor impact on its results
    5.  The Multiple Changes Equally Considered (MCEC) used by
    CST to infer code knowledge leads to the best results

    View Slide

  31. Thanks for your attention!
    A Comparison of Three Algorithms for Computing Truck Factors
    Mívian Ferreira¹, Marco Tulio Valente¹ and Kecia Ferreira²
    [email protected]
    ICPC 2017

    View Slide