Upgrade to Pro — share decks privately, control downloads, hide ads and more …

Android Graphics Overview

Android Graphics Overview

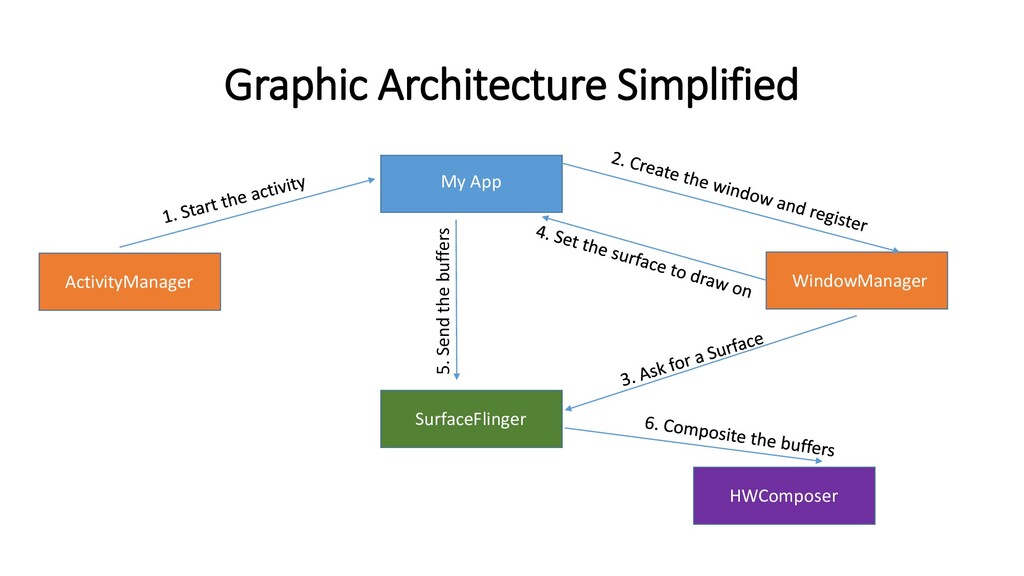
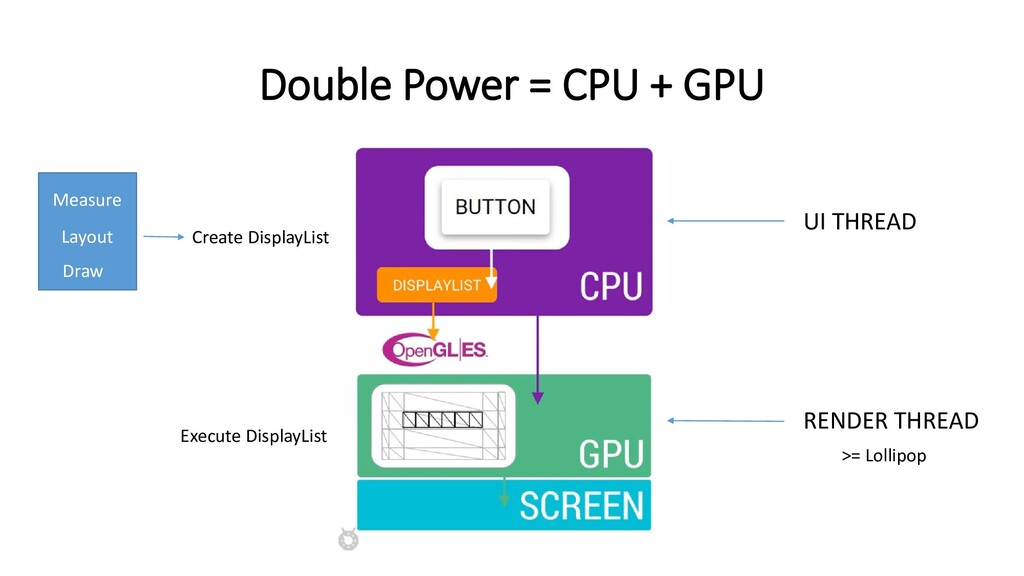
We develop Android apps keeping the one thing in mind, providing the best experience to users. Apart from the features, it's important we provide a buttery interaction to the user via display. For this reason it's important that we know how graphics work in Android.

Avatar for Ashesh Bharadwaj

Ashesh Bharadwaj

November 04, 2017
Tweet

More Decks by Ashesh Bharadwaj

Other Decks in Programming

Transcript

  1. PART I – Device Display Overview PART II – Android

    Graphic Architecture PART III – Analyze & Improve Graphics
  2. Refresh Rate (Hz) • The number of times per second

    a display redraw its screen. • It’s measured in Hz.
  3. Frame Rate (FPS) • Frame is an image shown on

    a device display. • FPS is number of frames that are generated per second. • Frames are generated by the system (CPU/GPU etc.) and the FPS may vary depending on the work load.
  4. The Importance of 16ms • Android framework assumes a device

    display has refresh rate of 60Hz • 60 frames in 1 second = 60 frames in 1000ms = 1 frame in 16ms (1000/60) • 16ms is the time we have, to generate a frame for buttery experience.
  5. Adaptive Sync • Adaptive sync, make the display refresh rate

    match the FPS • If system is generating 54 FPS then the refresh rate becomes 54Hz • FreeSync (AMD) and G-Sync (Nvidia) • Qualcomm, Snapdragon 835 supports Q-Sync
  6. Native Libraries + Runtime Application Framework Hardware Abstraction Layer (HAL)

    Apps Kernel ActivityManager WindowManager SurfaceFlinger HWComposer Gralloc
  7. Activity, Window, Surface and Buffer • Every Activity has a

    window where it displays the content. • The window needs a surface to draw on. • A Surface has a buffer queue. Status Bar App Window Navigation Bar Surface Surface Surface
  8. SurfaceFlinger Status Bar App Window Navigation Bar SurfaceFlinger Surface •

    SurfaceFlinger is a service which provides the Surface. • Each Surface holds a BufferQueue configured for triple buffering. • SurfaceFlinger take the buffers, composite them (with help of HWComposer) and send to device display.
  9. UI Thread - Rendering Process Measure Layout Draw DisplayList •

    Size, position and then drawing • Each View has corresponding onMeasure(), onLayout(), onDraw() method • Each View has a DisplayList
  10. Role of View Hierarchy in Rendering Process LinearLayout TextView LinearLayout

    TextView TextView • Views are interdependent • Traversed from top to bottom in view hierarchy • Each parent manage its children
  11. Double Power = CPU + GPU Measure Layout Draw UI

    THREAD RENDER THREAD Create DisplayList Execute DisplayList >= Lollipop
  12. VSync in Android ViewRoot DecorView Choreographer 3. scheduleTraversals() SurfaceFlinger HWComposer

    Display 7. performTraversals() LinearLayout 6. VSync 5. VSync 4. VSync 1. Invalidate 2. Invalidate 8. Measure/Layout/Draw
  13. Areas to Improve • Code executed in UI thread •

    Layouts • Resources, mostly images
  14. UI Thread • Offload any work that can be, to

    another thread • Database access, File access, Network access • Any computations which can take time
  15. Layouts • Reduce Nesting • Use ConstraintLayout for flat hierarchy

    • ViewStub • Merge tag • Careful of the “background” attribute
  16. Images • Size, size and size • Caching • Use

    robust and efficient third party libraries
  17. Profile GPU Rendering • A quick way to see how

    your app is performing. • Horizontal green line is 16ms mark. • Colors on the bar represent a stage in rendering. • Don’t look for perfection AKA over optimization.
  18. Debug GPU Overdraw • A good way to take off

    unnecessary load. • Various colors denote the number of times overdraw. • Don’t look for perfection AKA over optimization.
  19. Hierarchy Viewer • Easily accessed from Android Device Monitor •

    Analyze the complexity of layout • Analyze the bottlenecks in Measure/Layout/Draw • Layout Inspector now favored although no profiling yet
  20. TraceView • Analyze how methods are performing • Easily accessed

    from Android Device Monitor • Trace can be started from code • Find the bottlenecks in call stack • View time taken by methods • View method call count
  21. Systrace • Overall analysis of the system • Easily accessed

    from Android Device Monitor • Choose which sections of system to analyze. • Analyze the slow frames • View alert for issues
  22. SysTrace – Rendering process 1. Choreographer#doFrame 2. traversal 3. measure

    4. layout 5. draw 6. Record View#draw() 7. DrawFrame 8. syncFrameState 9. dequeueBuffer 10. flush drawing commands 11. queueBuffer
  23. Take care of the UX and everything else shall fall

    in line • Memory optimization • Network optimization • Battery optimization