Upgrade to Pro — share decks privately, control downloads, hide ads and more …

A Pragmatic Perspective on Software Visualization

A Pragmatic Perspective on Software Visualization

Slides of the keynote presentation at the 5th International IEEE/ACM Symposium on Software Visualization, SoftVis 2010. Salt Lake City, USA, October 2010.

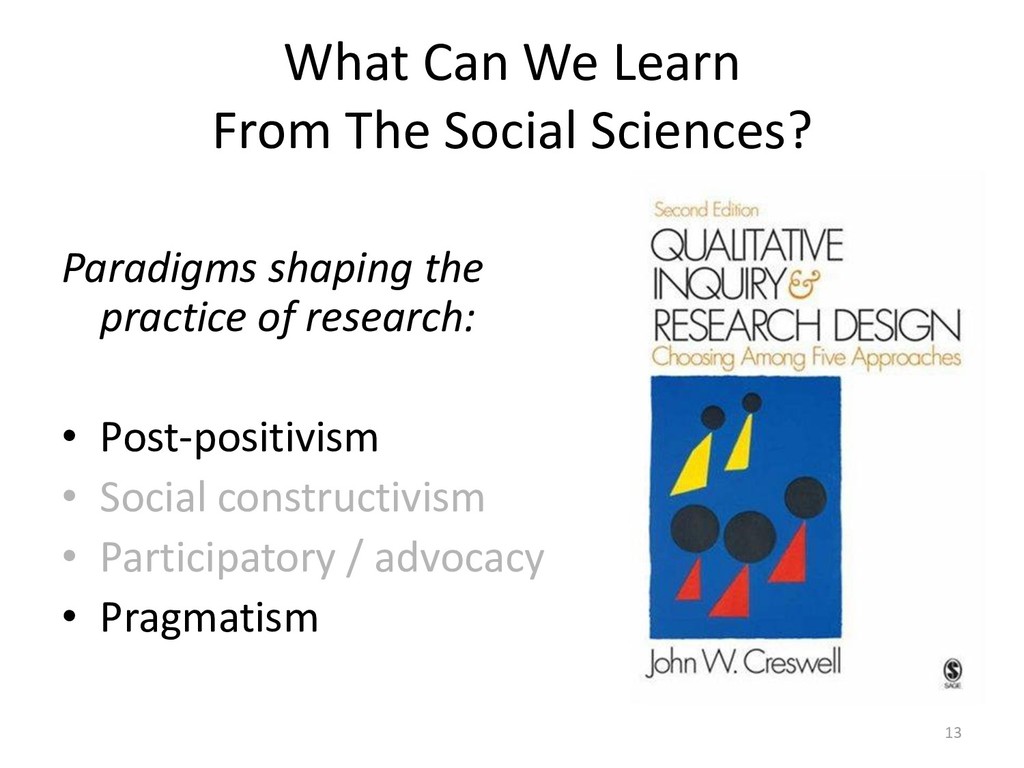
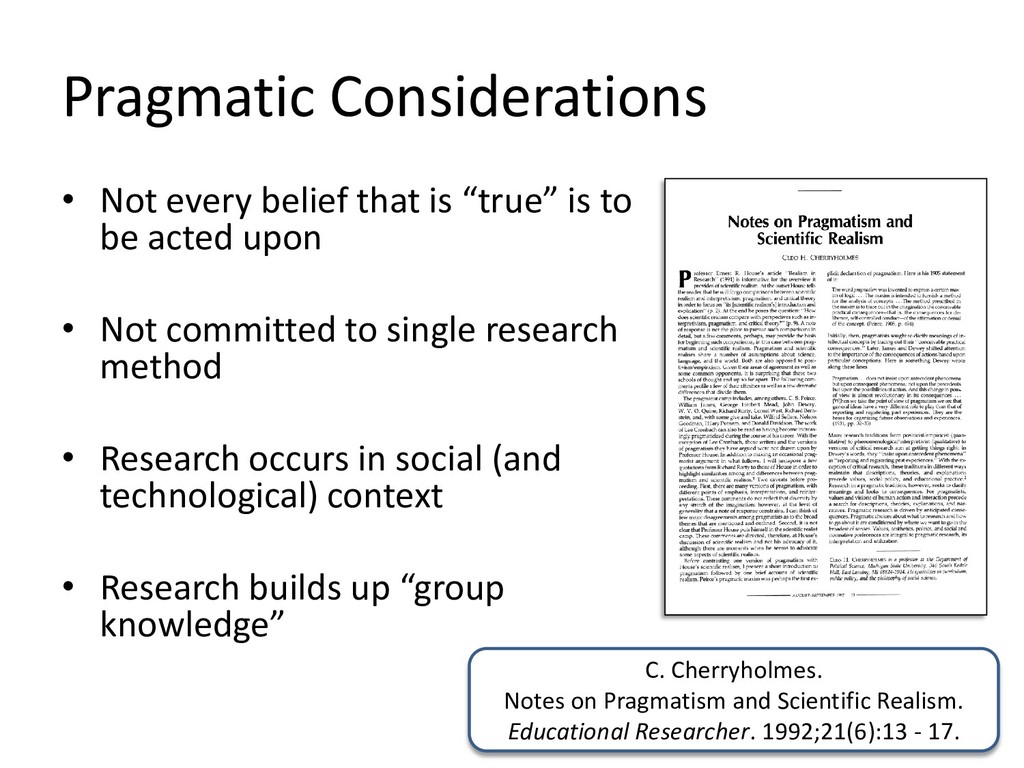
For software visualization researchers taking the pragmatic philosophical
stance, the ultimate measure of success is adoption in industry.
For you as researcher, what can be more satisfying than enthusiastic
developers being able to work better and more efficiently
thanks to your beautiful visualization of their software?
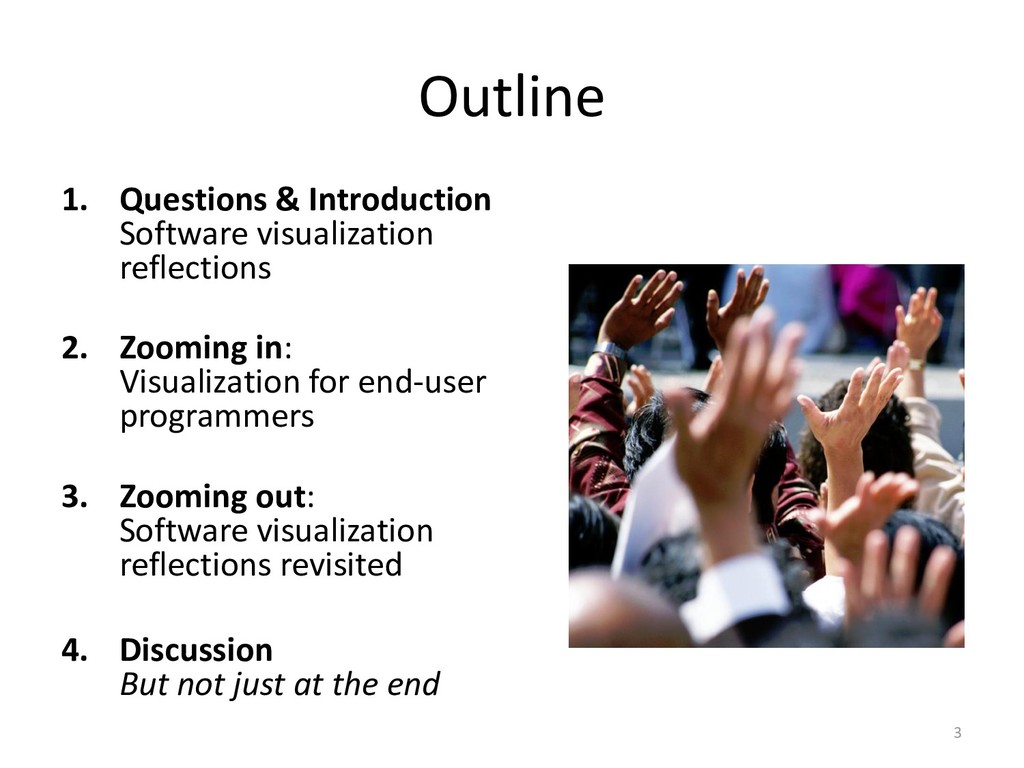
One of the aims of this talk is to reflect on factors affecting impact
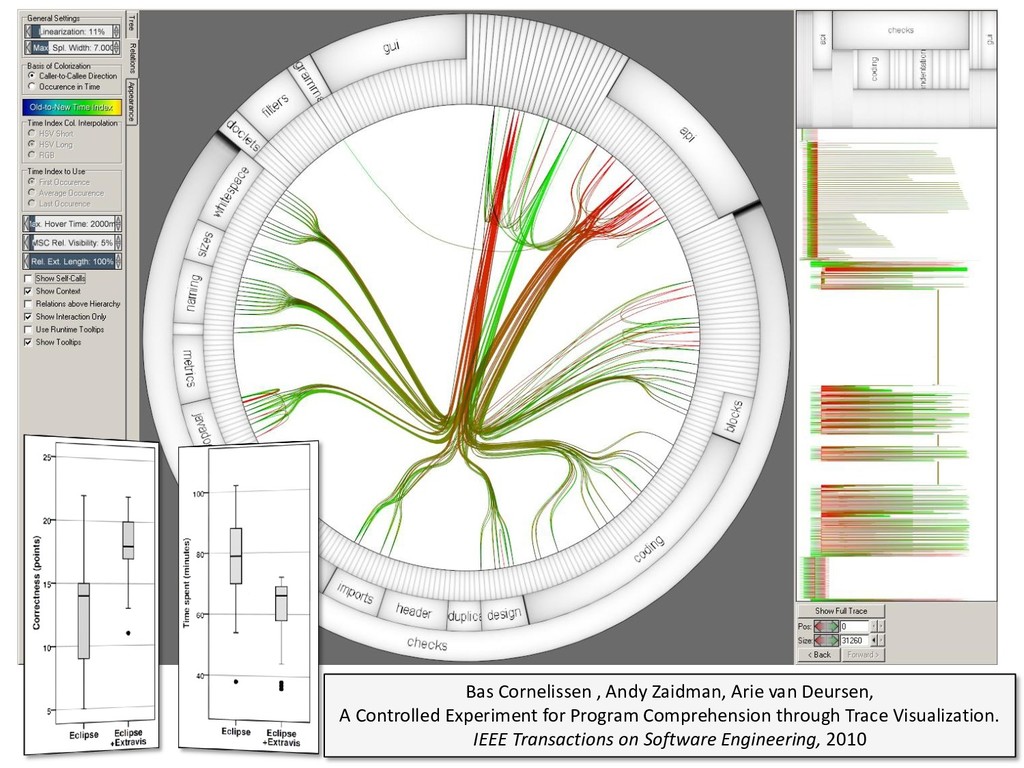
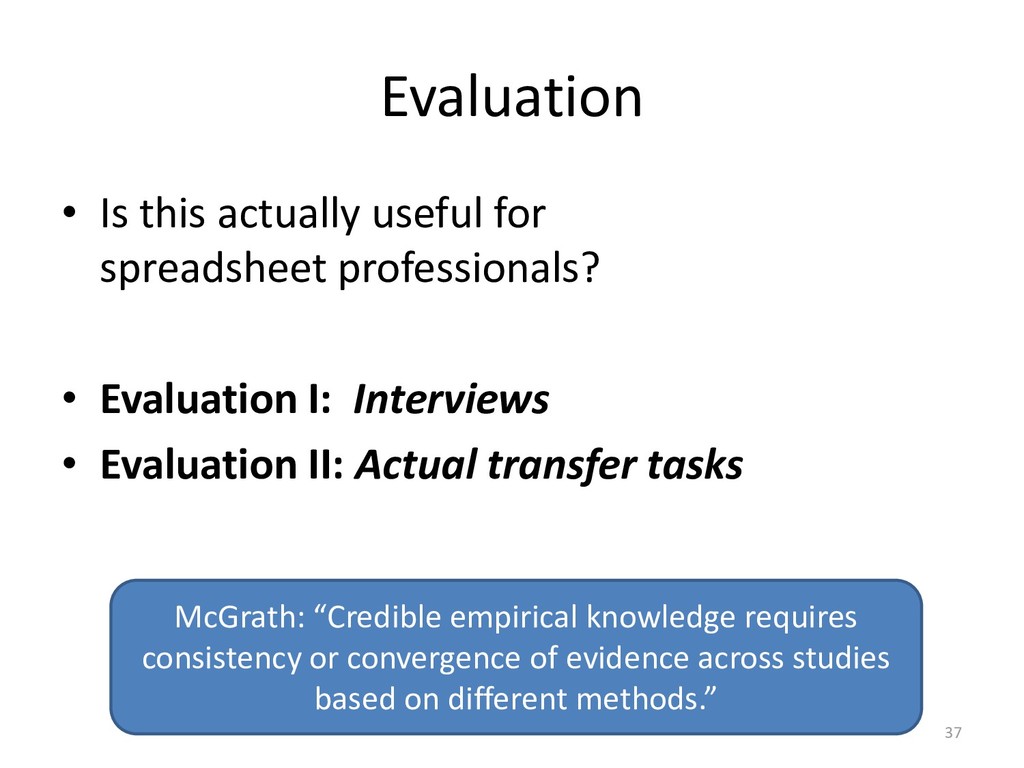
in practice of software visualization research. How does rigorous
empirical evaluation matter? What is the role of foundational
research that does not subscribe to the philosophy of pragmatism?
Can we make meaningful predictions of adoption in practice if this
takes 10 years or more?

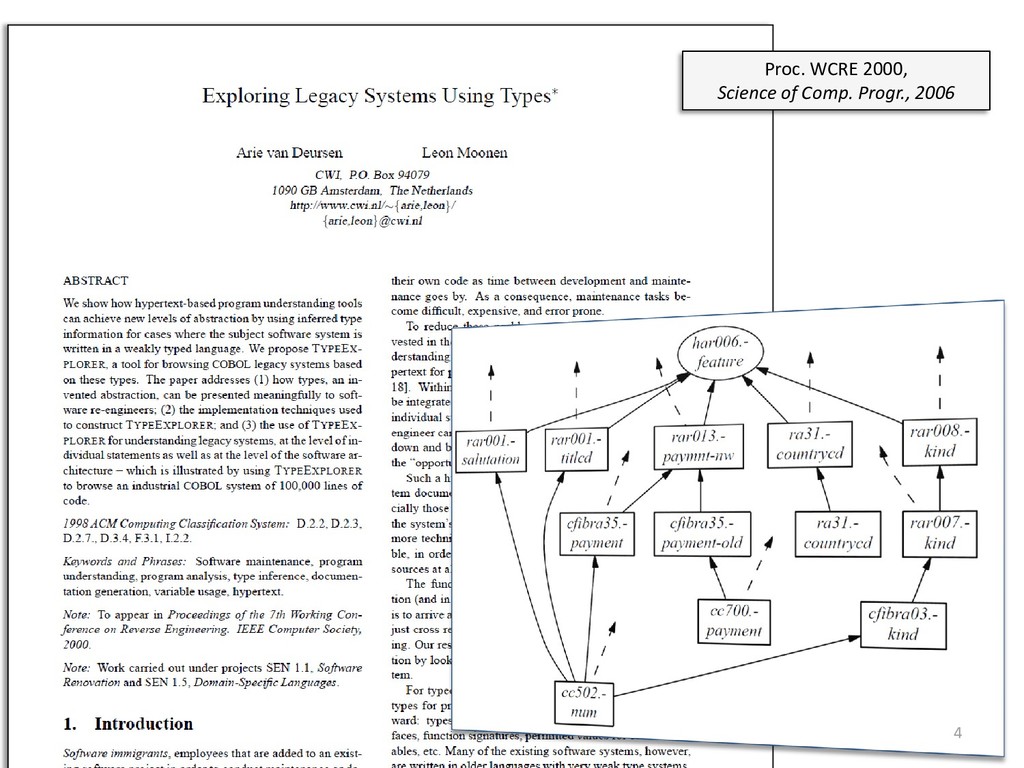
During the talk, I will illustrate the dilemmas, opportunities, and
frustrations involved in trying to achieve practical impact with examples
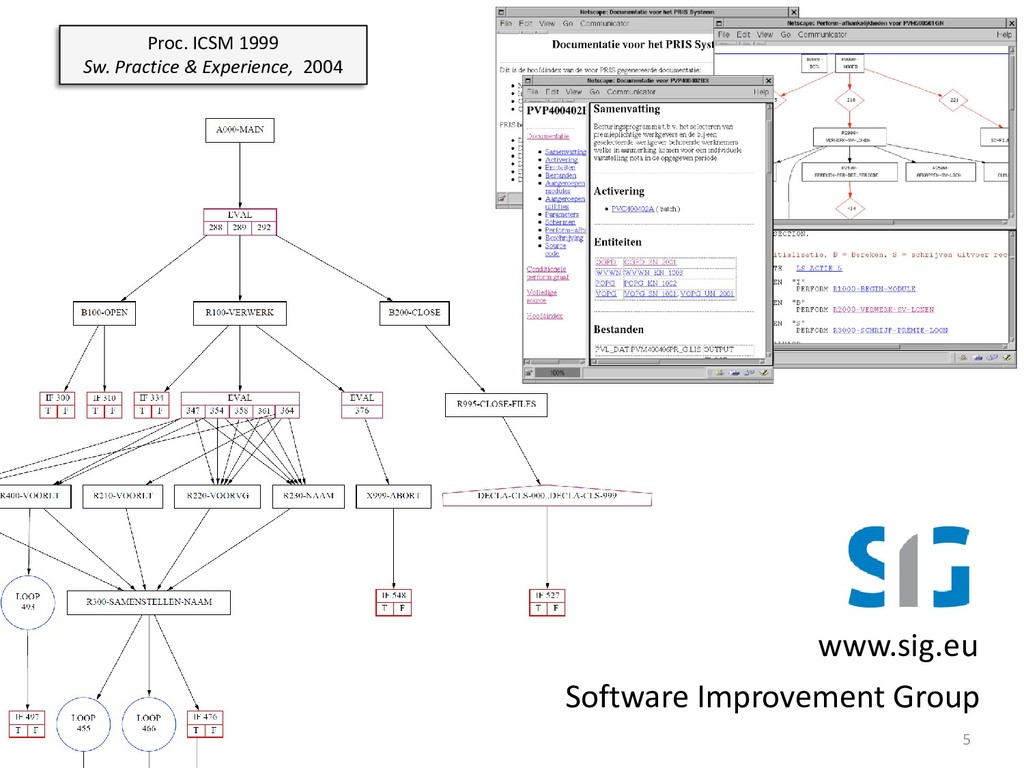
drawn from my own research in such areas as software architecture
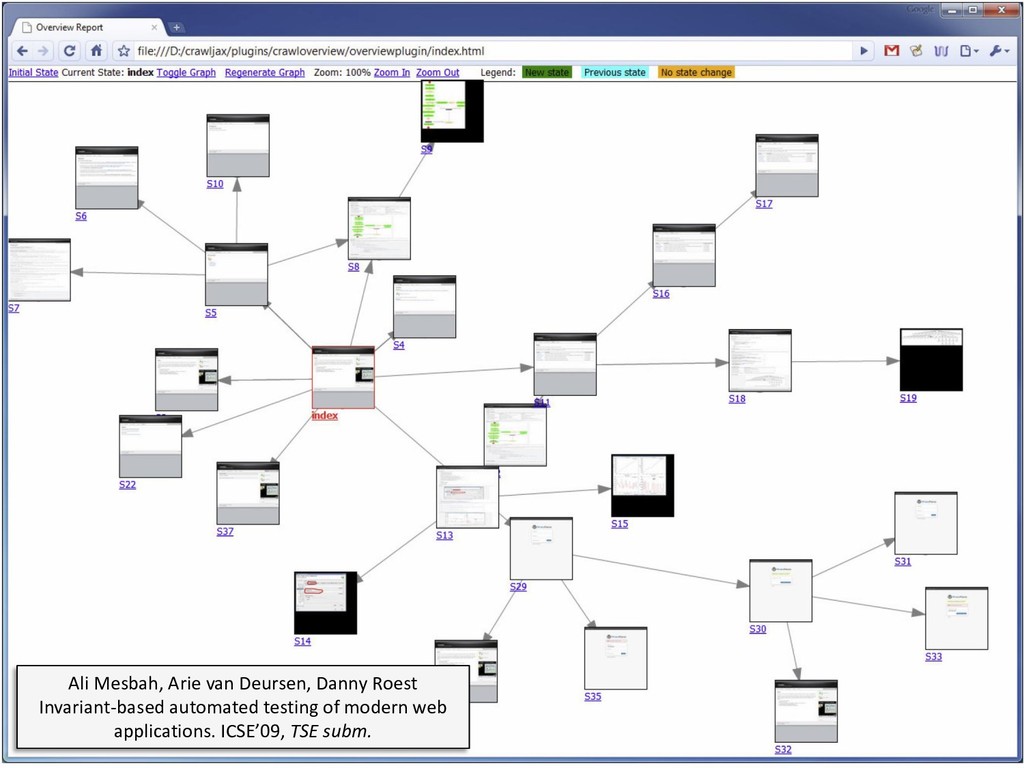
analysis, documentation generation, and Web 2.0 user
interface reverse engineering.

I will also shed light on some of my most recent research activities,
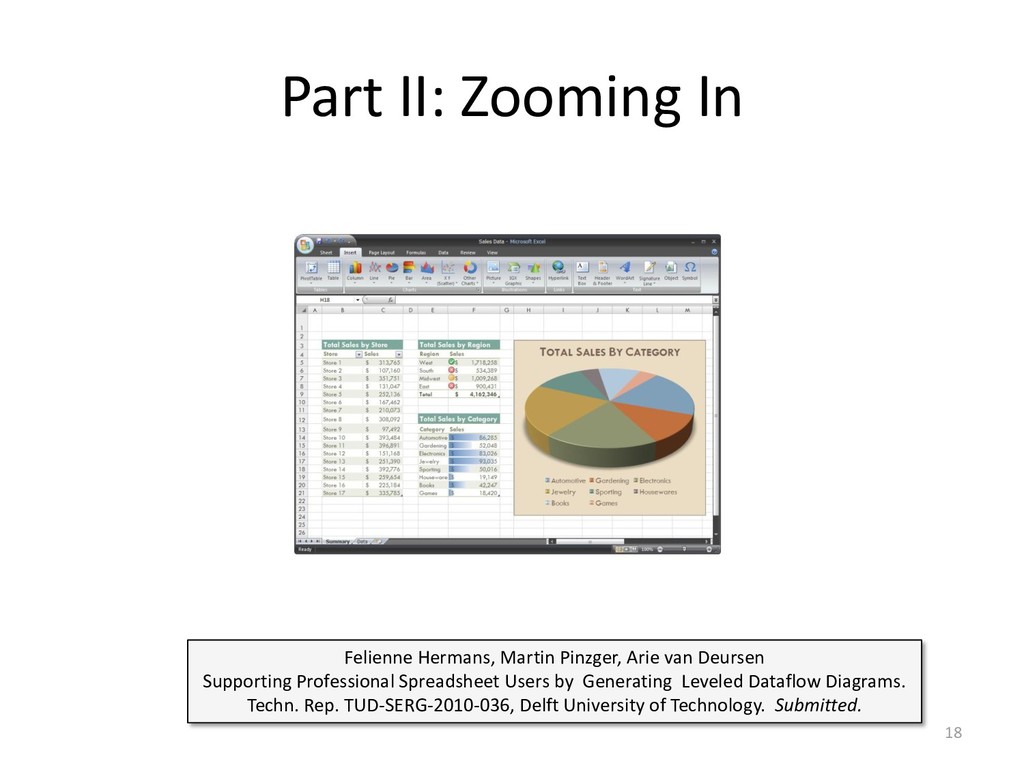
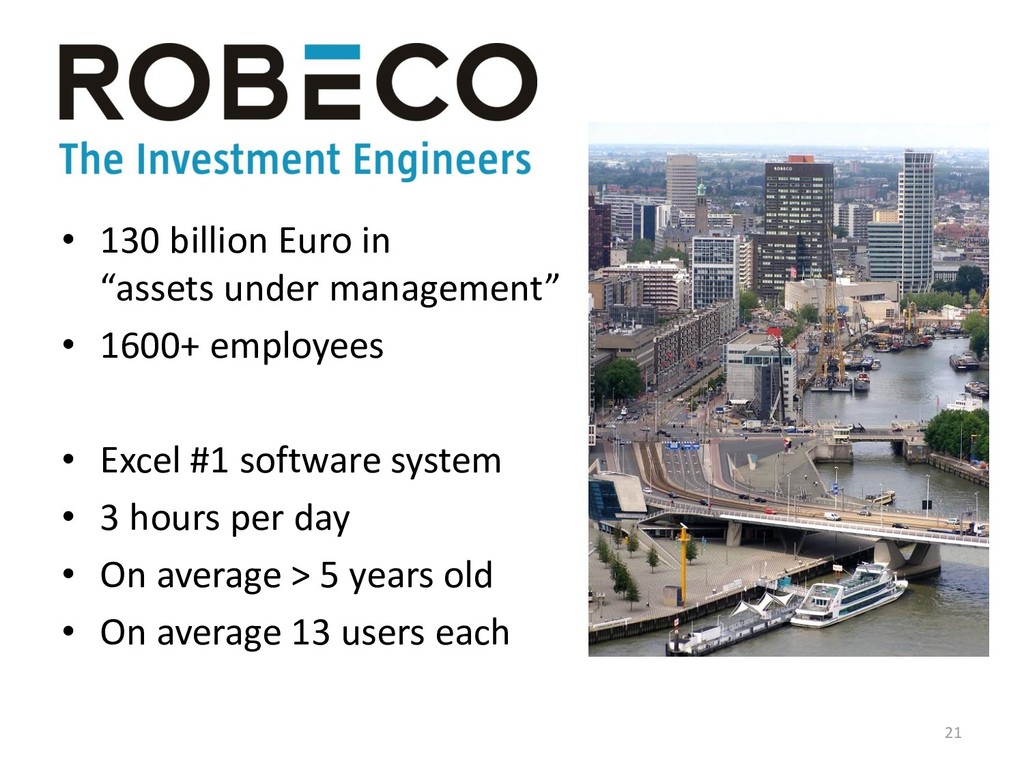
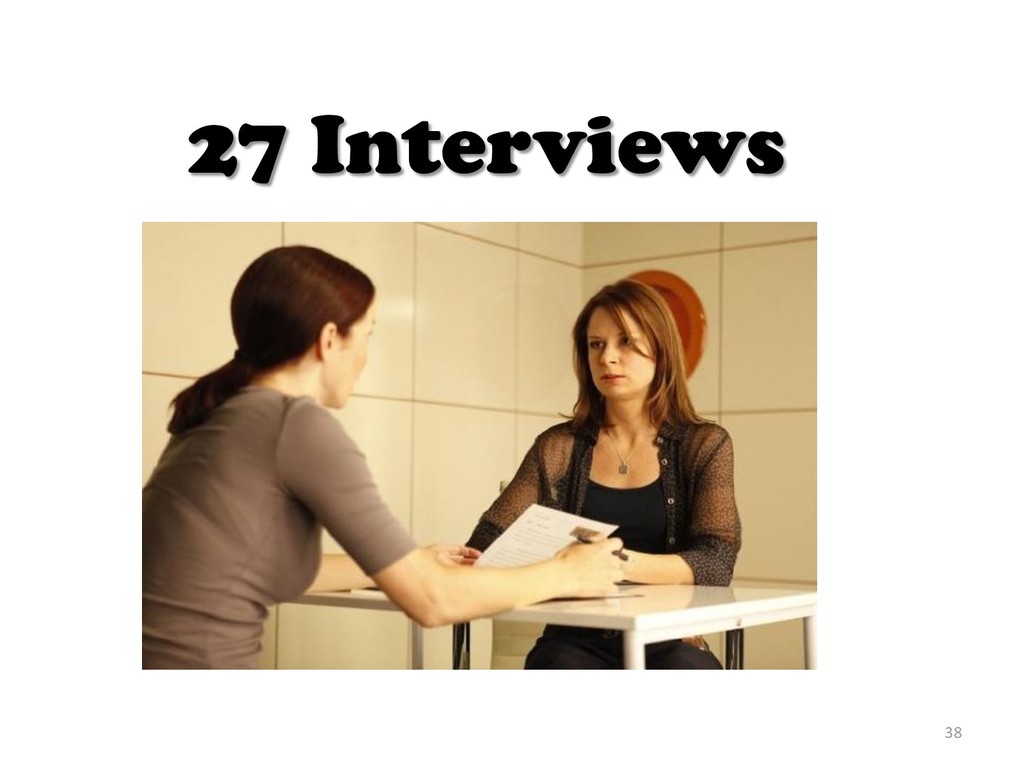
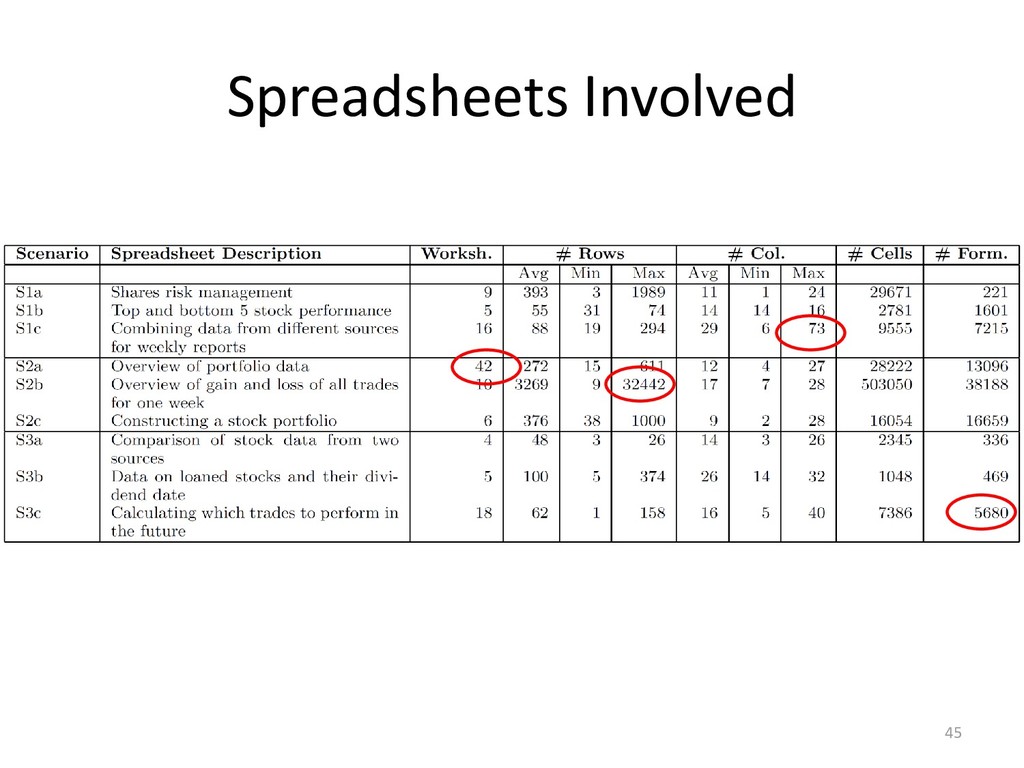
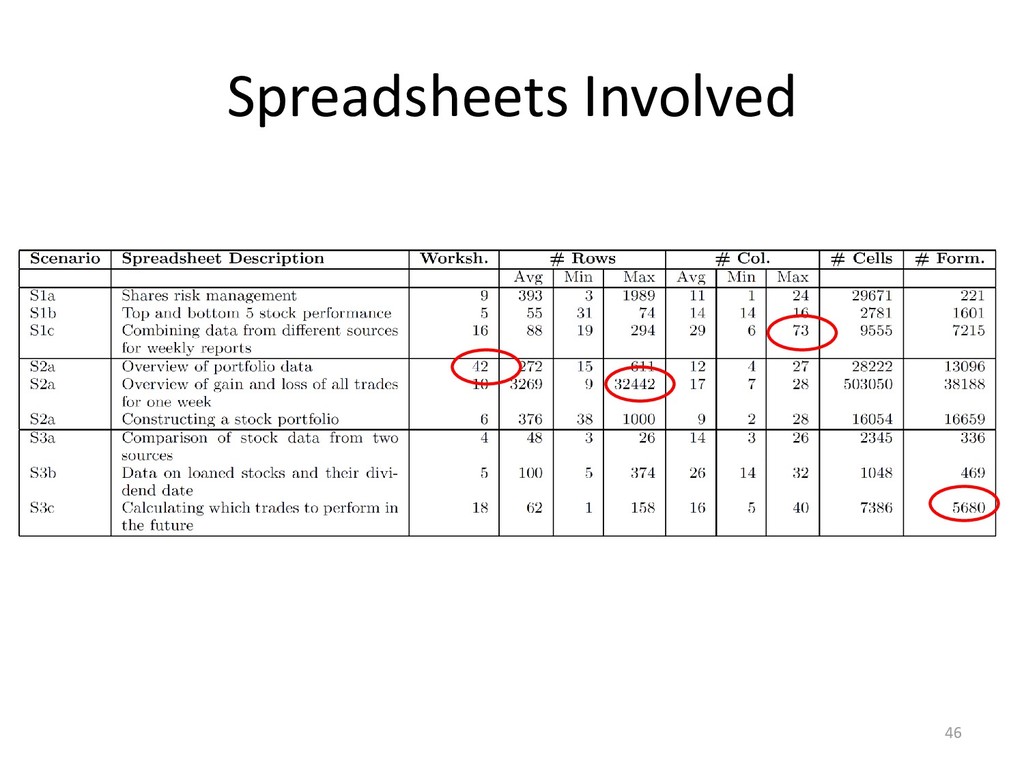
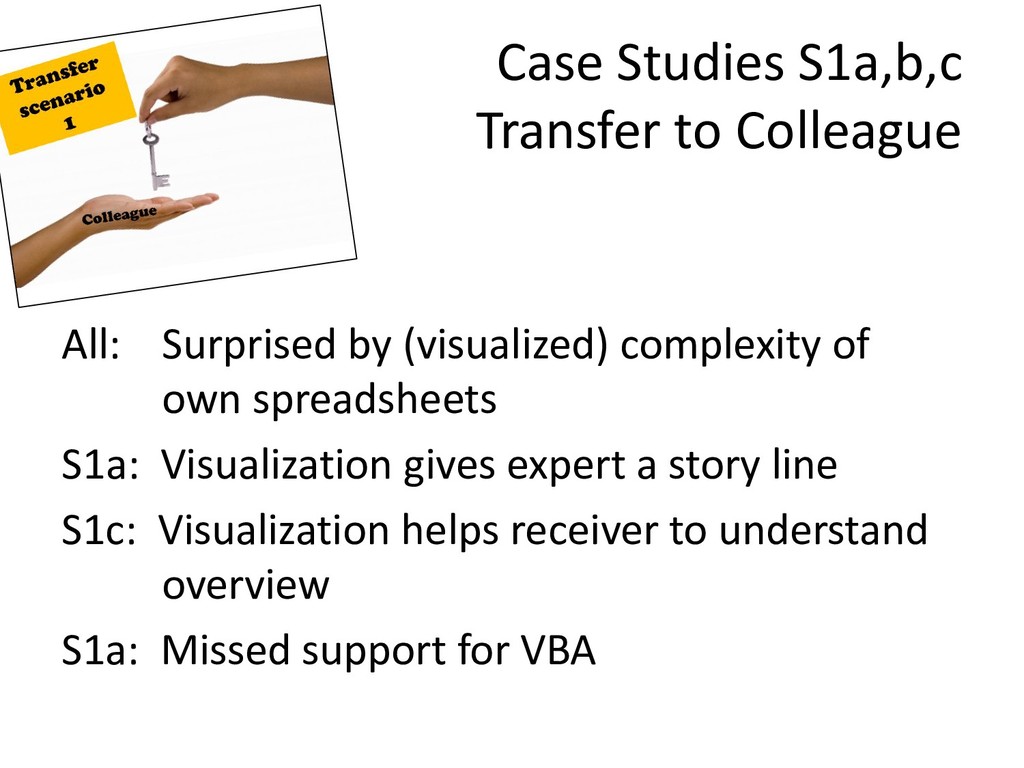
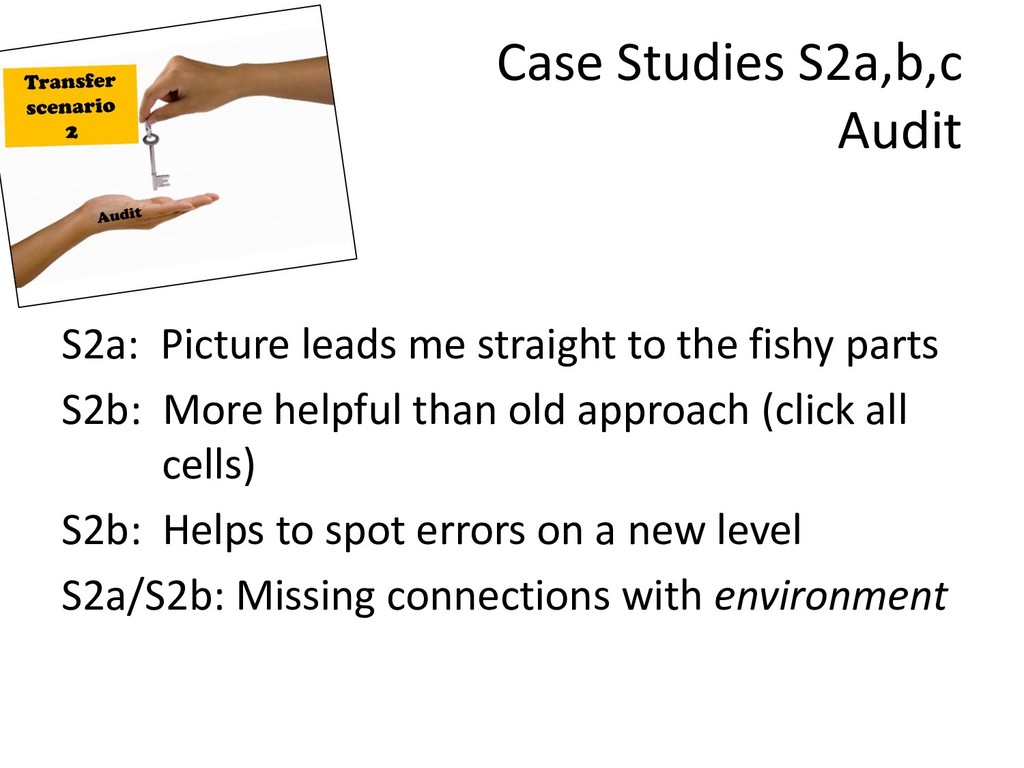
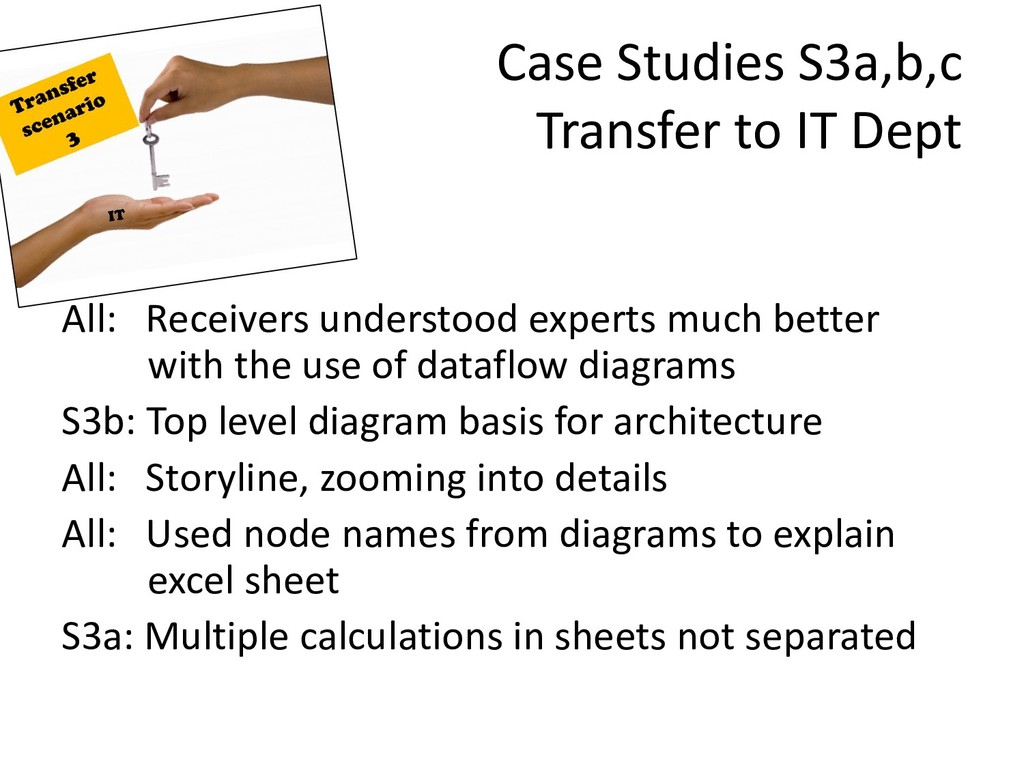
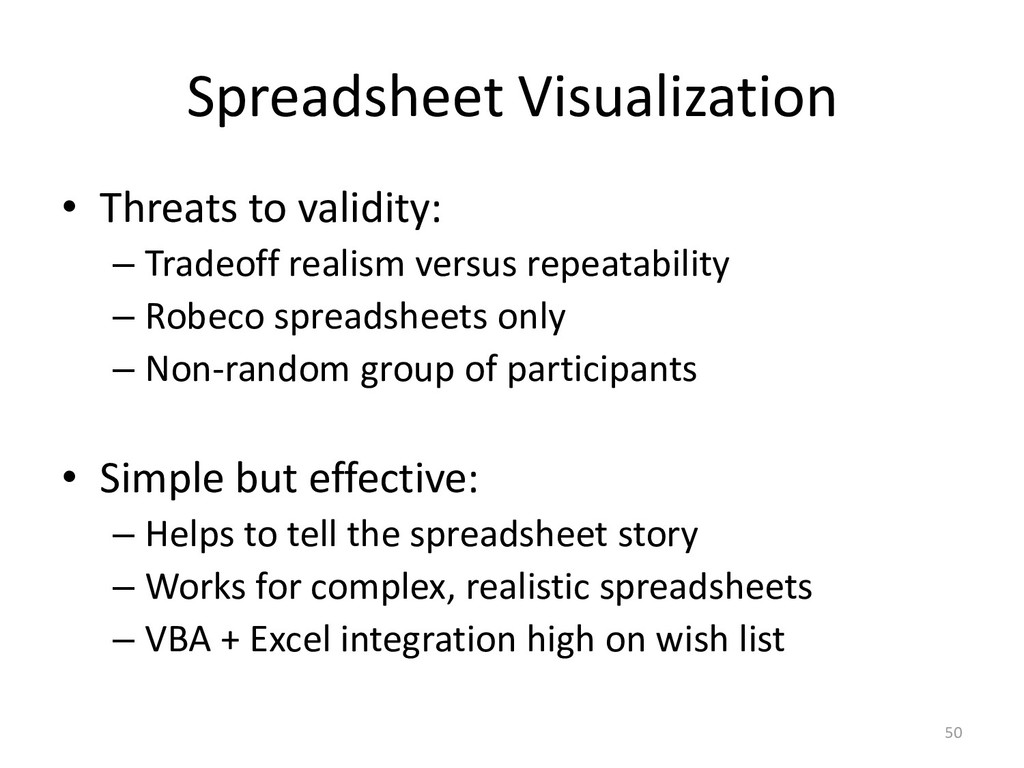
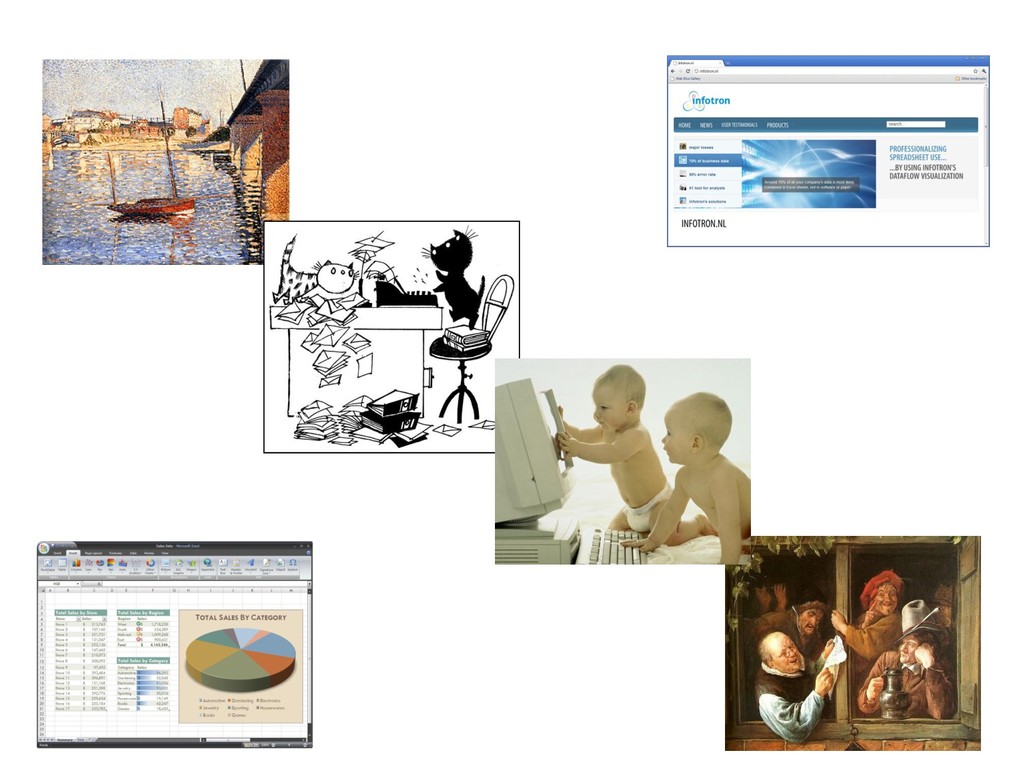
which includes work in the area of spreadsheet comprehension.
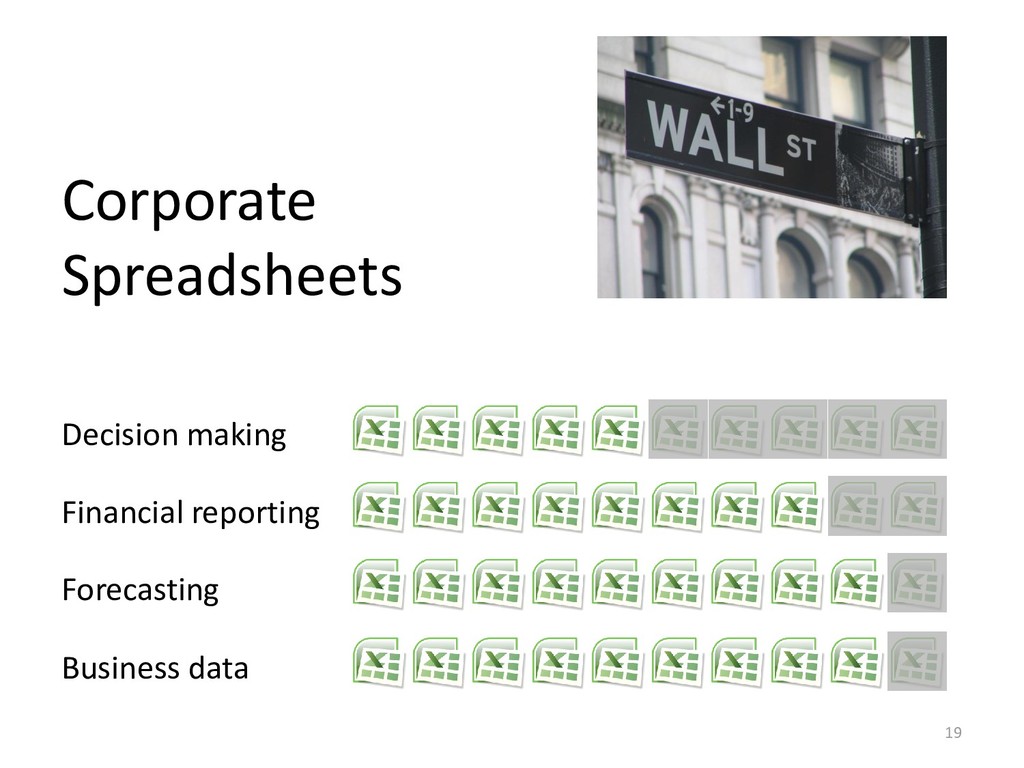
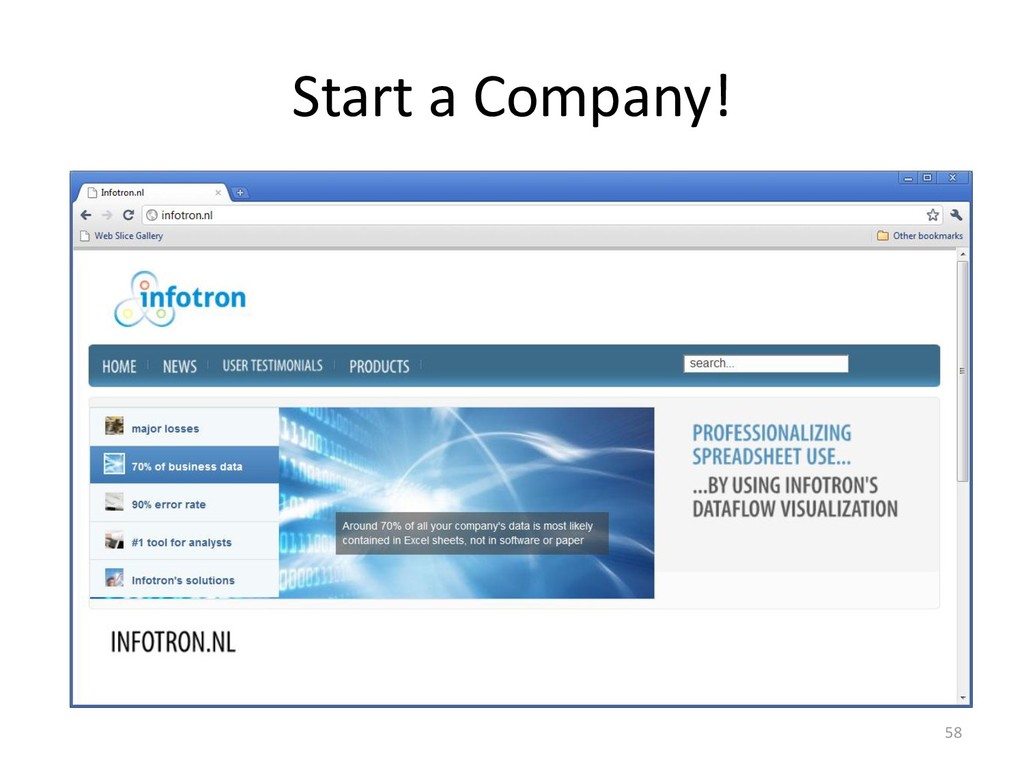
This is research that we conduct with a major (Dutch)
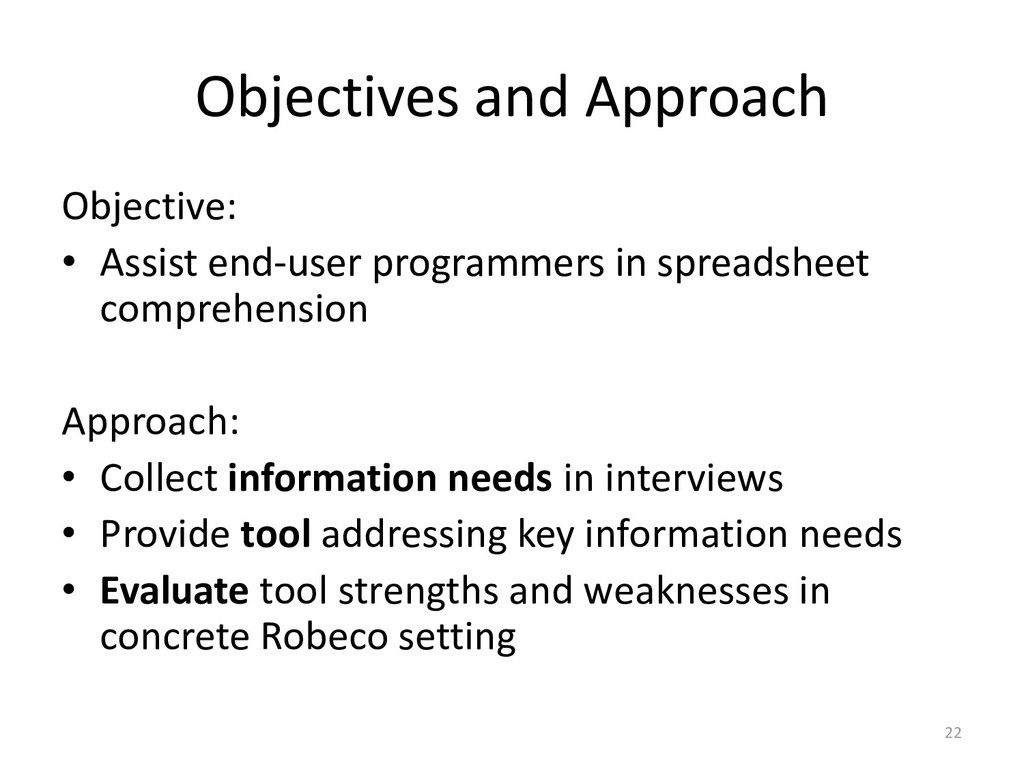
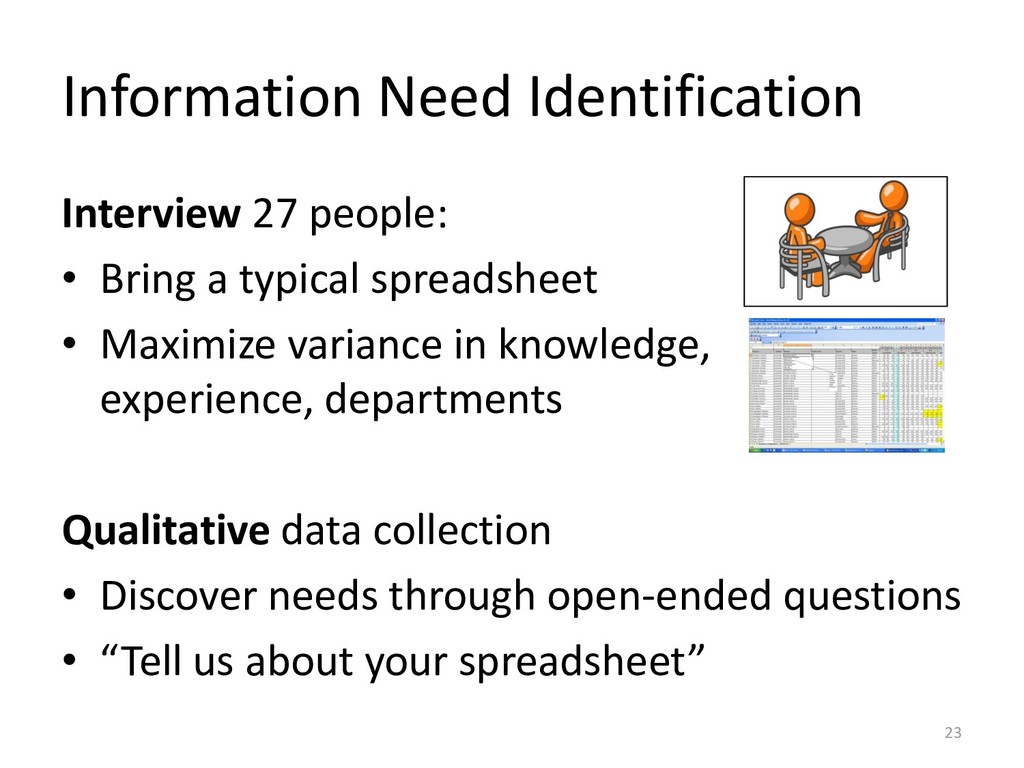
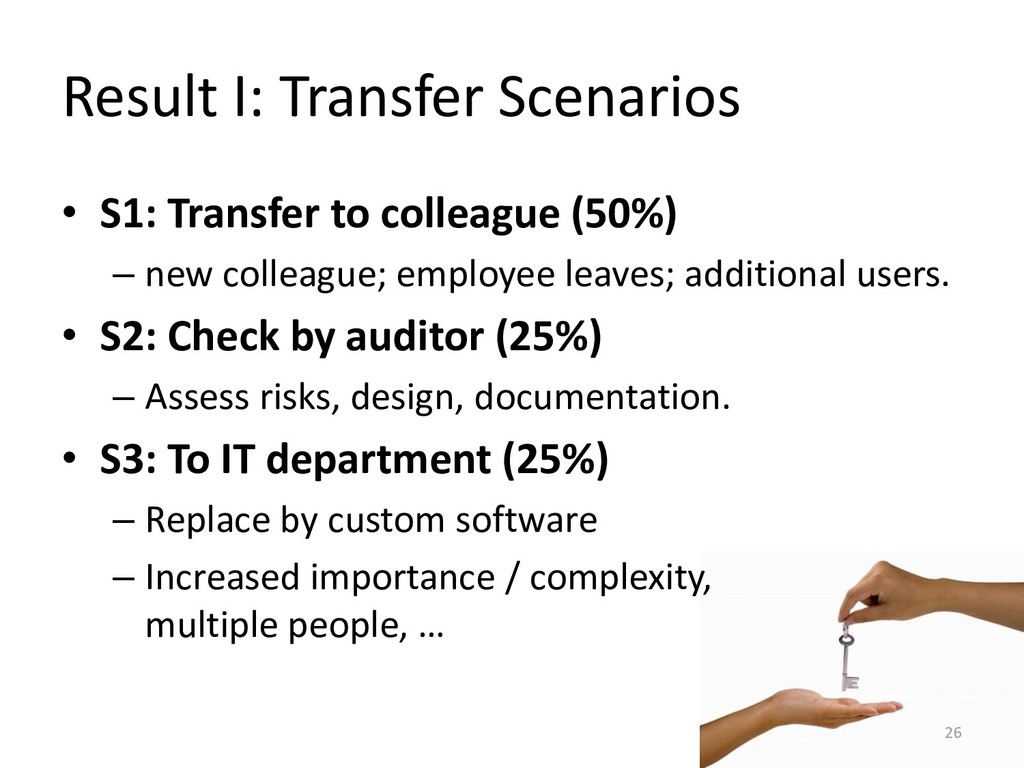
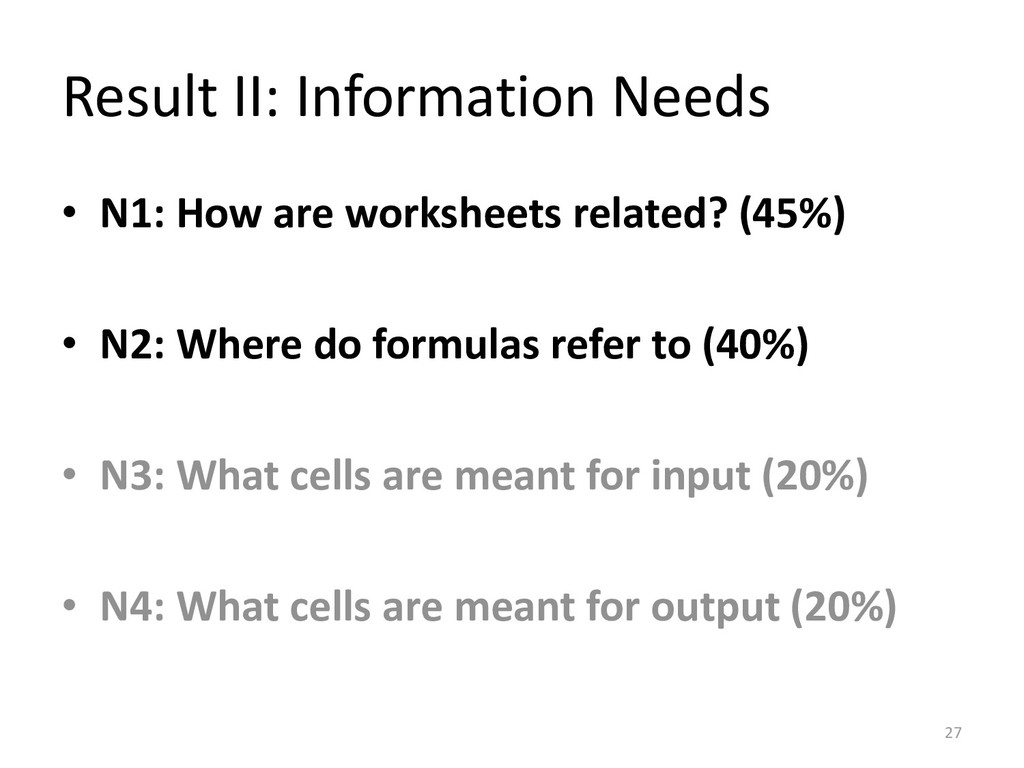
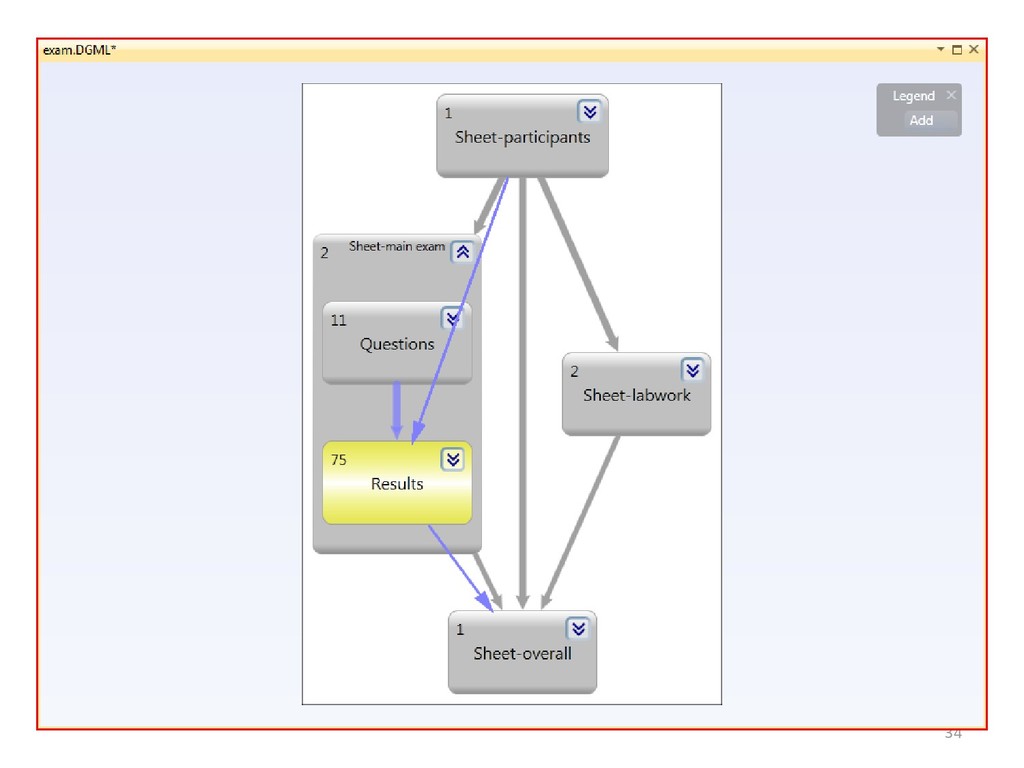
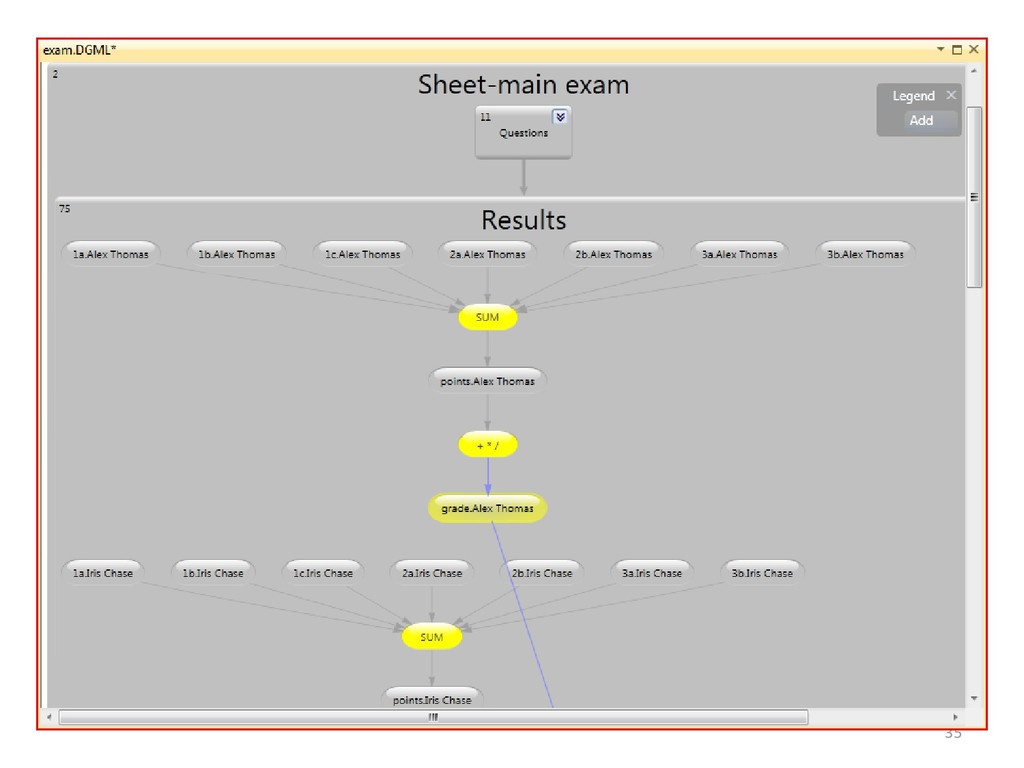
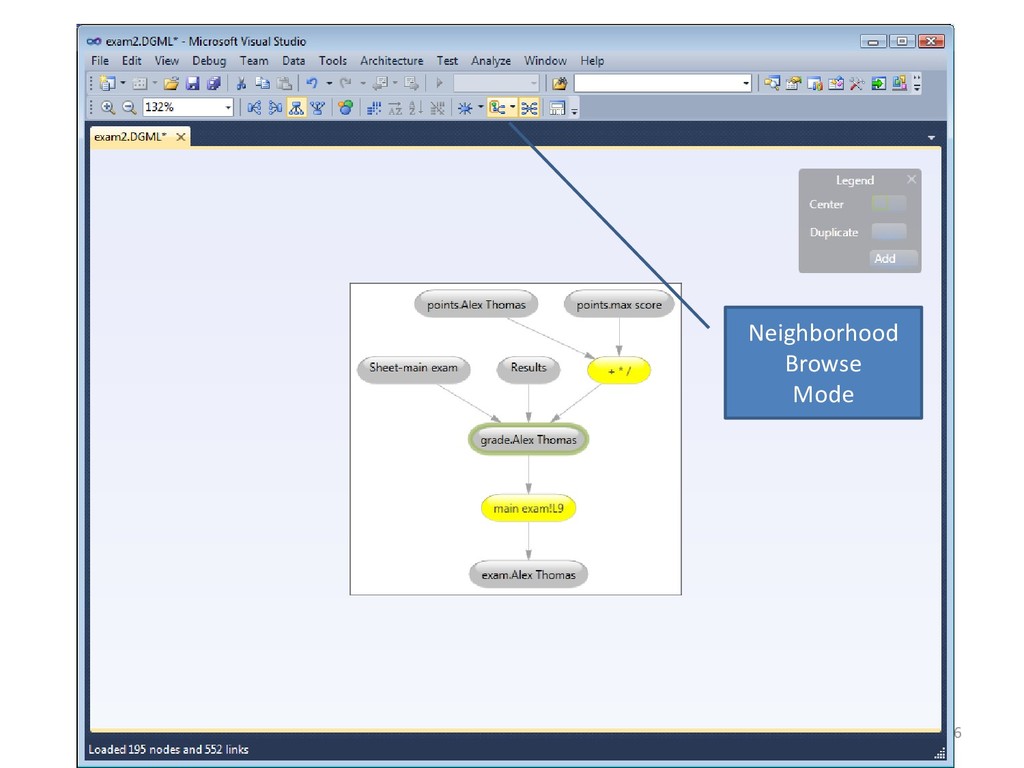
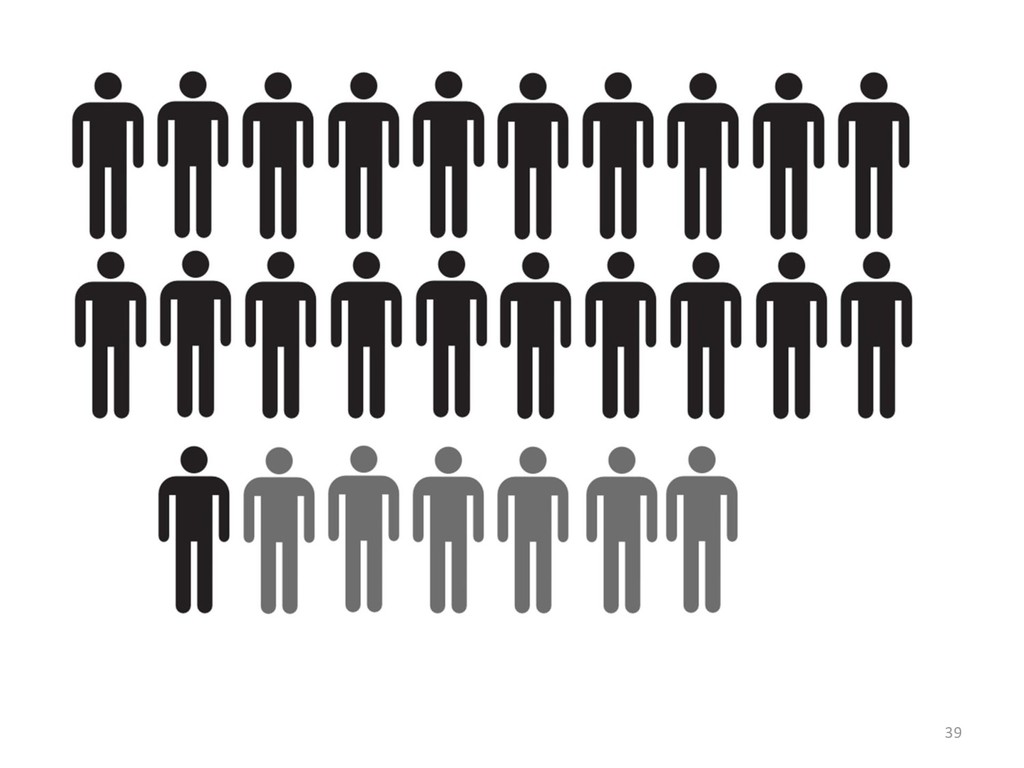
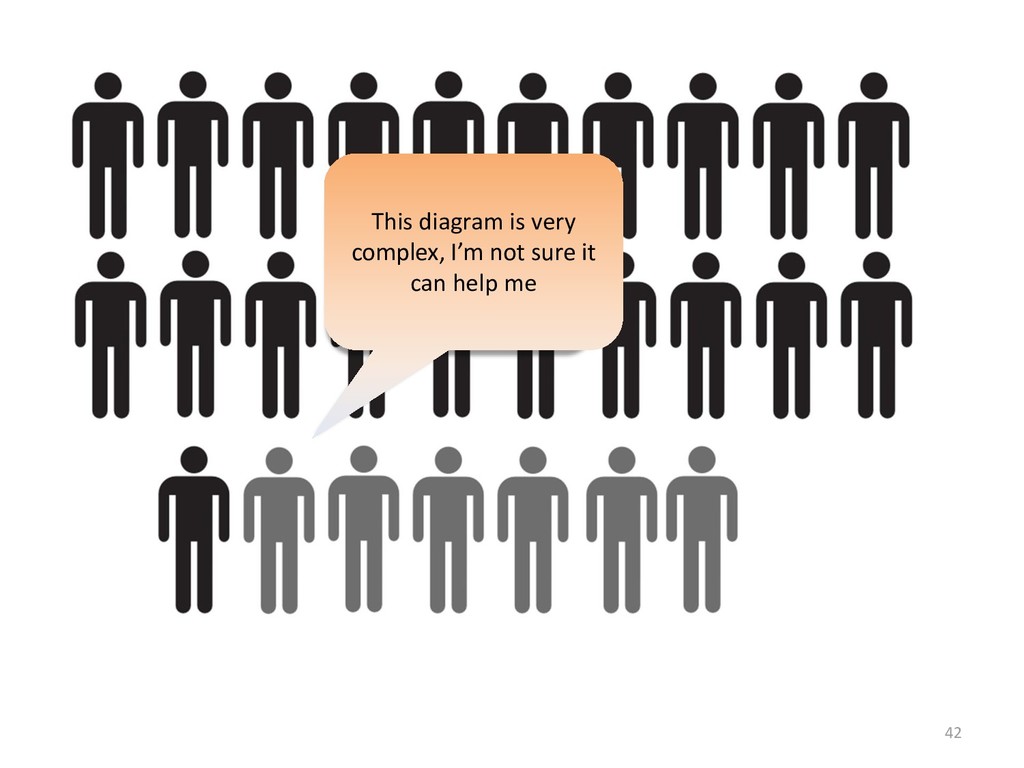
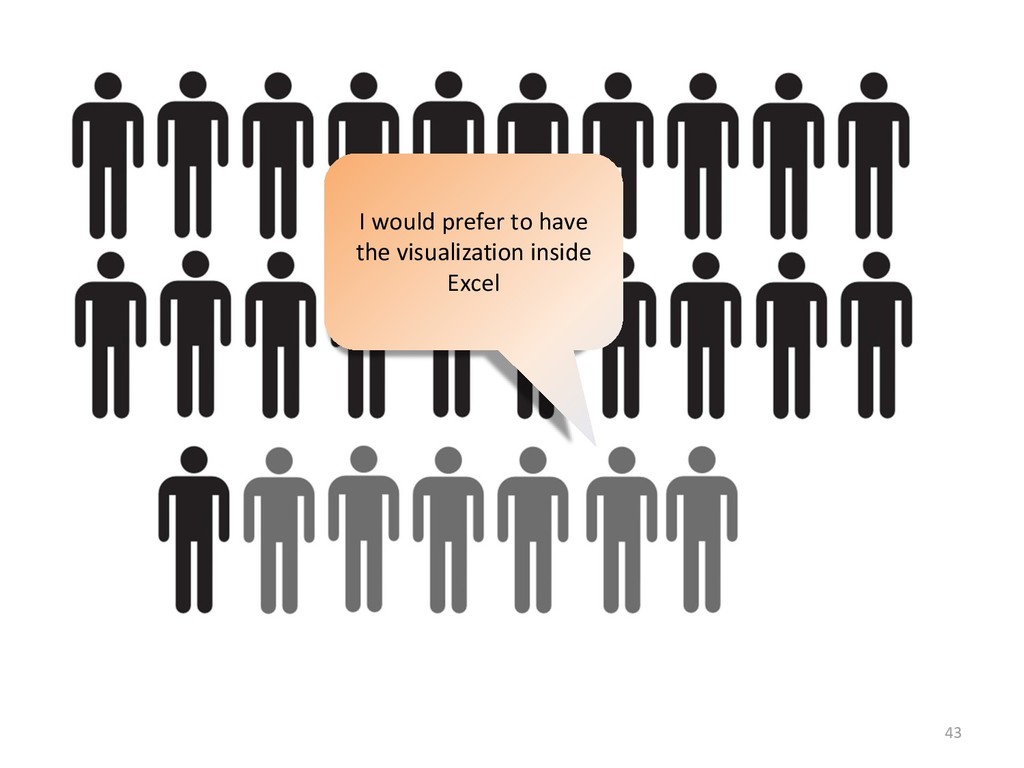
financial asset management firm. Our work consists of the identification
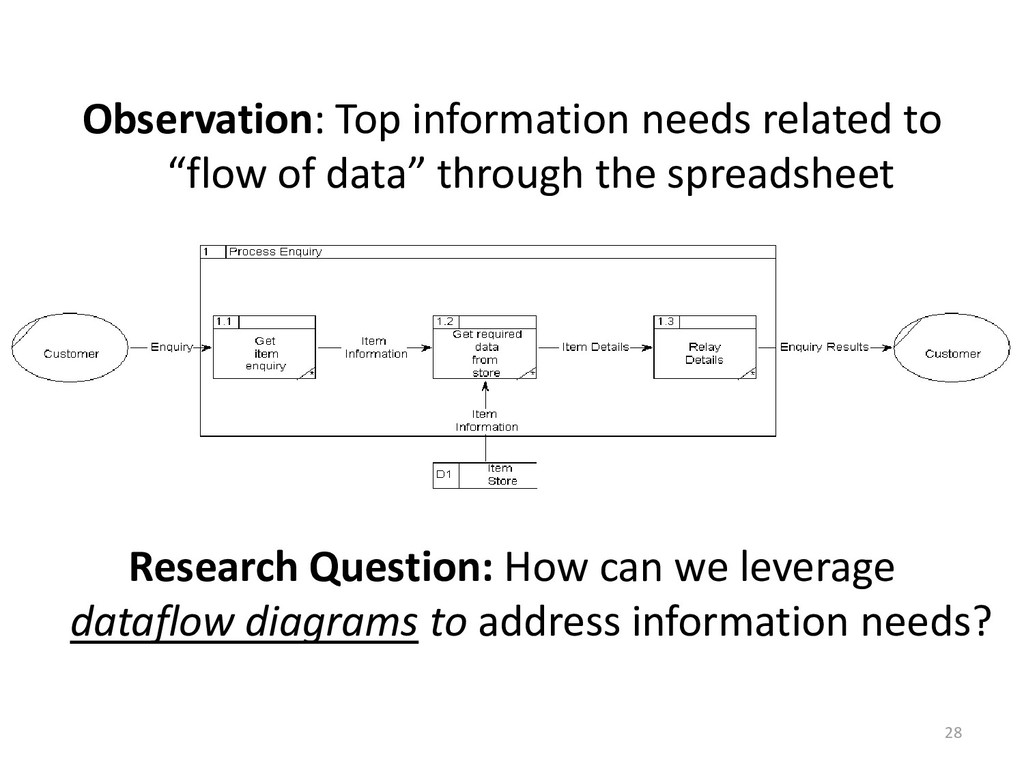
of information needs for professional spreadsheet users, a
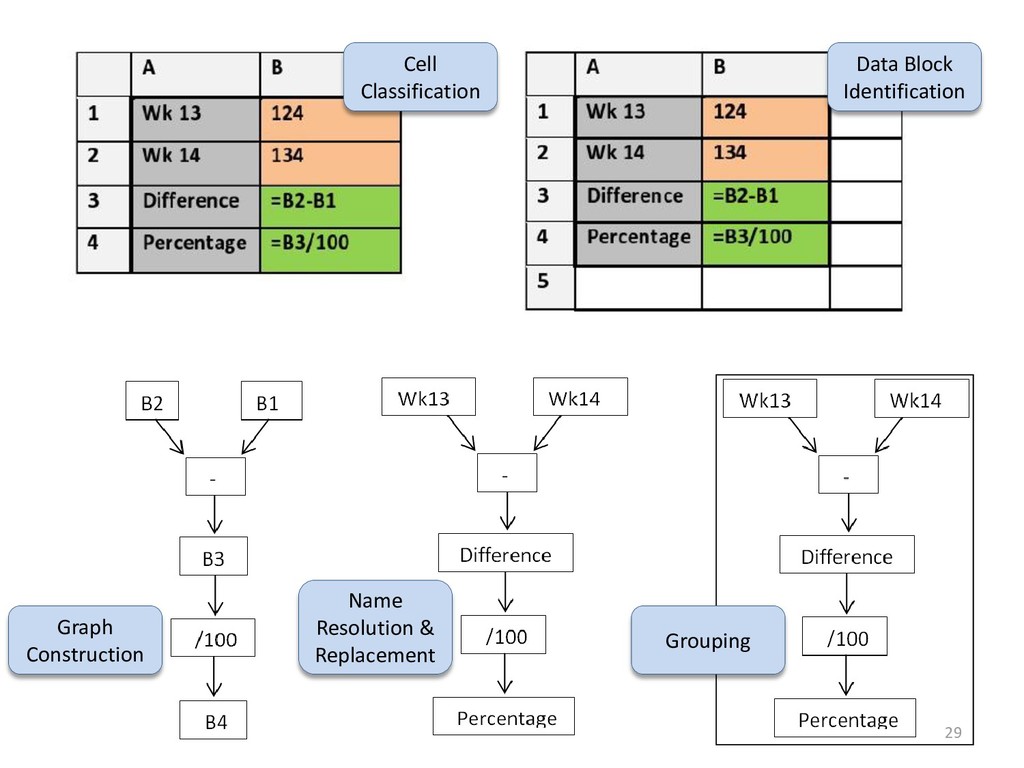
visualization to address these needs, and an evaluation of this visualization
with practitioners conducting real-life spreadsheet tasks.

Throughout the talk, I will encourage the audience to engage in
the discussion, and contribute their own perspectives on the issues
that I raise in my talk.

Arie van Deursen

October 25, 2010
Tweet

More Decks by Arie van Deursen

Other Decks in Technology

Transcript

  1. Acknowledgements • SoftVis organizers – Alexandru Telea – Carsten Görg

    – Steven Reiss • TU Delft co-workers – Felienne Hermans – Martin Pinzger • The Chisel Group, Victoria – Margaret-Anne Storey 2
  2. Outline 1. Questions & Introduction Software visualization reflections 2. Zooming

    in: Visualization for end-user programmers 3. Zooming out: Software visualization reflections revisited 4. Discussion But not just at the end 3
  3. 6

  4. 7 Ali Mesbah, Arie van Deursen, Danny Roest Invariant-based automated

    testing of modern web applications. ICSE’09, TSE subm.
  5. 8 Bas Cornelissen , Andy Zaidman, Arie van Deursen, A

    Controlled Experiment for Program Comprehension through Trace Visualization. IEEE Transactions on Software Engineering, 2010
  6. 9 A. Zaidman, B. van Rompaey, A. van Deursen and

    S. Demeyer . Studying the co-evolution of production and test code in open source and industrial developer test processes through repository mining. Empirical Software Engineering, 2010
  7. 10 A. Hindle, M. Godfrey, and R. Holt.. Software Process

    Recovery using Recovered Unified Process Views. ICSM 2010
  8. Observations 1. My visualizations leave room for improvement… 2. Some

    very cool results are never applied  3. Software visualizations in context can be successful 4. Simpler might be more effective 5. What is our perspective on evaluation? 11
  9. What is “Exciting” in an Engineering Field? 1. Invention of

    wholly new ideas and directions 2. Work of promise that illuminates #1 3. Early application of #2 showing clear prospect of benefit 4. Substantial exploitation of #3 yielding measurable societal benefits 5. Maturing of #4 with widespread adoption by practitioners 12 A. Finkelstein A. Wolf
  10. What Can We Learn From The Social Sciences? Paradigms shaping

    the practice of research: • Post-positivism • Social constructivism • Participatory / advocacy • Pragmatism 13
  11. Post-positivism • Conjectures and Refutations: The Growth of Scientific Knowledge

    • Testing of hypotheses • A priori use of theory 14
  12. Pragmatism • Clarify meanings of intellectual concepts by tracing out

    their “conceivable practical consequences”. (Charles Peirce, 1905) • Do not insist upon antecedent phenomena, but upon consequent phenomena; Not upon the precedents but upon the possibilities of action (John Dewey, 1931) 15
  13. Pragmatic Considerations • Not every belief that is “true” is

    to be acted upon • Not committed to single research method • Research occurs in social (and technological) context • Research builds up “group knowledge” 16 C. Cherryholmes. Notes on Pragmatism and Scientific Realism. Educational Researcher. 1992;21(6):13 - 17.
  14. The Qualitative Research Palette • Measuring applicability? • The outcome

    as a narrative • Multi-facetted validity • Case studies • Ethnography • Participant observation • Grounded theory • Phenomenology • Narrative studies • Participative inquiry • Interviewing • Document analysis • … 17 C. B. Seaman. Qualitative methods in empirical studies of software engineering. IEEE TSE, 1999
  15. Part II: Zooming In 18 Felienne Hermans, Martin Pinzger, Arie

    van Deursen Supporting Professional Spreadsheet Users by Generating Leveled Dataflow Diagrams. Techn. Rep. TUD-SERG-2010-036, Delft University of Technology. Submitted.
  16. Spreadsheet Research • Spreadsheet Risks Interest Groups – Managing &

    identifying spreadsheet errors • “End Users Shaping Effective Software” (2005…) – Spreadsheet corpus, testing, debugging, surveys – ICSE, TOSEM, TSE, Comp. Surveys, VL/HCC, CHI,… – Nebraska, CMU, Oregon State, Washington, … F. Hermans, M. Pinzger, and A. van Deursen. Automatically Extracting Class Diagrams from Spreadsheets. ECOOP 2010. 20
  17. • 130 billion Euro in “assets under management” • 1600+

    employees • Excel #1 software system • 3 hours per day • On average > 5 years old • On average 13 users each 21
  18. Objectives and Approach Objective: • Assist end-user programmers in spreadsheet

    comprehension Approach: • Collect information needs in interviews • Provide tool addressing key information needs • Evaluate tool strengths and weaknesses in concrete Robeco setting 22
  19. Information Need Identification Interview 27 people: • Bring a typical

    spreadsheet • Maximize variance in knowledge, experience, departments Qualitative data collection • Discover needs through open-ended questions • “Tell us about your spreadsheet” 23
  20. Grounded Theory • Systematic procedure to discover theory from (qualitative)

    data • Theoretical sensitivity • Theoretical coding • Open coding • Theoretical sampling • Constant comparative method • Selective coding • Memoing 24 S. Adolph, W. Hall, Ph. Kruchten. Using Grounded theory to study the experience of software development. Emp. Sw. Eng., Jan. 2011. B. Glaser and J. Holton. Remodeling grounded theory. Forum Qualitative Res., 2004.
  21. Result I: Transfer Scenarios • S1: Transfer to colleague (50%)

    – new colleague; employee leaves; additional users. • S2: Check by auditor (25%) – Assess risks, design, documentation. • S3: To IT department (25%) – Replace by custom software – Increased importance / complexity, multiple people, … 26
  22. Result II: Information Needs • N1: How are worksheets related?

    (45%) • N2: Where do formulas refer to (40%) • N3: What cells are meant for input (20%) • N4: What cells are meant for output (20%) 27
  23. Observation: Top information needs related to “flow of data” through

    the spreadsheet Research Question: How can we leverage dataflow diagrams to address information needs? 28
  24. Directed Graph Markup Language • Visual Studio 2010 DGML graph

    browser • Zooming • Collapsing / expanding levels • Grouping of multiple arrows • Butterfly mode / slicing • Graph editing (deletion, coloring, leveling) 30 Create prototype (GyroSAT) aimed at collecting initial user feedback
  25. 32

  26. 33

  27. 34

  28. 35

  29. Evaluation • Is this actually useful for spreadsheet professionals? •

    Evaluation I: Interviews • Evaluation II: Actual transfer tasks 37 McGrath: “Credible empirical knowledge requires consistency or convergence of evidence across studies based on different methods.”
  30. 39

  31. As analysts we are used to thinking in processes and

    therefore this kind of diagrams is very natural to us 41
  32. Case Studies: Experimental design • Monitor 9 actual transfer tasks:

    – 3 for each category • Each task involved: – Two participants: expert to receiver – ~ 1 hour – Laptop with GyroSAT; desktop with Excel – Participant observation & reflective questions • Only helped if participants got stuck 44
  33. Case Studies S1a,b,c Transfer to Colleague All: Surprised by (visualized)

    complexity of own spreadsheets S1a: Visualization gives expert a story line S1c: Visualization helps receiver to understand overview S1a: Missed support for VBA
  34. Case Studies S2a,b,c Audit S2a: Picture leads me straight to

    the fishy parts S2b: More helpful than old approach (click all cells) S2b: Helps to spot errors on a new level S2a/S2b: Missing connections with environment
  35. Case Studies S3a,b,c Transfer to IT Dept All: Receivers understood

    experts much better with the use of dataflow diagrams S3b: Top level diagram basis for architecture All: Storyline, zooming into details All: Used node names from diagrams to explain excel sheet S3a: Multiple calculations in sheets not separated
  36. Spreadsheet Visualization • Threats to validity: – Tradeoff realism versus

    repeatability – Robeco spreadsheets only – Non-random group of participants • Simple but effective: – Helps to tell the spreadsheet story – Works for complex, realistic spreadsheets – VBA + Excel integration high on wish list 50
  37. Methodological Pride! • What are our knowledge claims? • What

    are the corresponding research methods? 52 Mariam Sensalire, Patrick Ogao, and Alexandru Telea. Evaluation of Software Visualization Tools: Lessons Learned. In Proc. VISSOFT. IEEE, 2009
  38. Design Science 53 Type Conditions of Practice Control of context

    Example Users Goals Illustration no yes small designer illustration Opinion imagined yes any stakeholder support Lab demo no yes realistic designer knowledge Lab experiment no yes artificial subjects knowledge Benchmark no yes standard designer knowledge Field trial yes yes realistic designer knowledge Field experiment yes yes realistic stakeholder knowledge Action case yes no real designer knowledge and change Pilot project yes no realistic stakeholder knowledge and change Case study yes no real stakeholder knowledge and change Roel Wieringa. Design Science Methodology. Presentation for Deutsche Telekom, 2010 (also ICSE, RE tutorial)
  39. A Priori Engagement with Users • Understand existing way of

    working • Identify problems • Embed solutions 54
  40. Software = Peopleware Evaluations are • qualitative • incomplete •

    subjective Evidence must • grow • and be criticized 55
  41. 59