Upgrade to Pro — share decks privately, control downloads, hide ads and more …

Topology map of your micro-services in one click and without redeployment? Easy on Azure with Microsoft Application Insights by Alex Bulankou

Topology map of your micro-services in one click and without redeployment? Easy on Azure with Microsoft Application Insights by Alex Bulankou

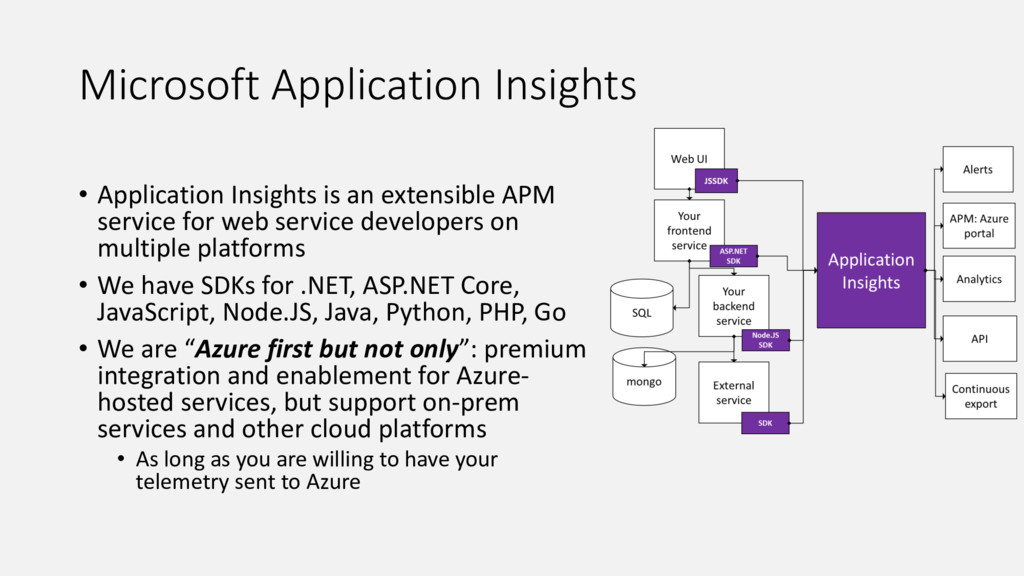
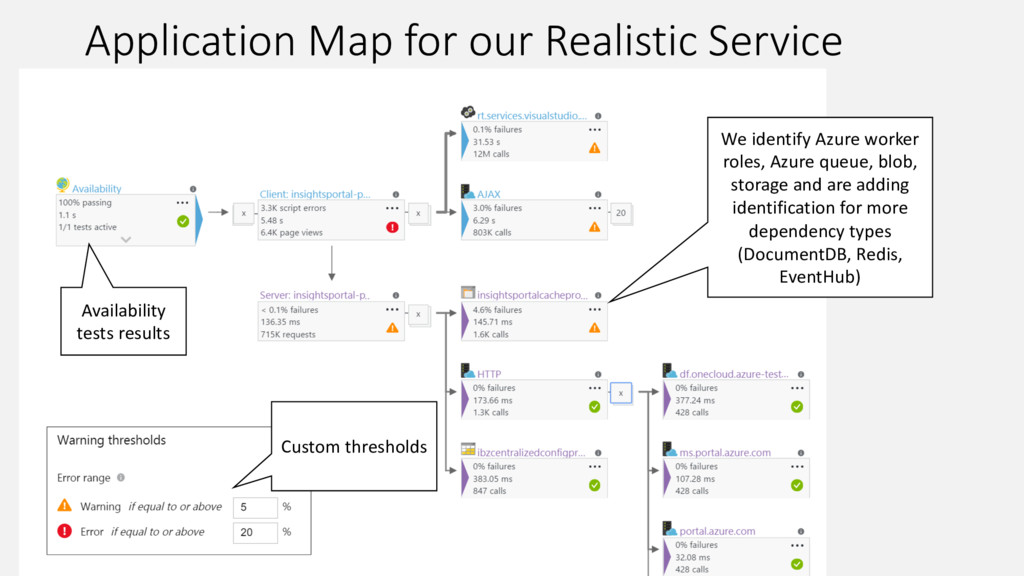
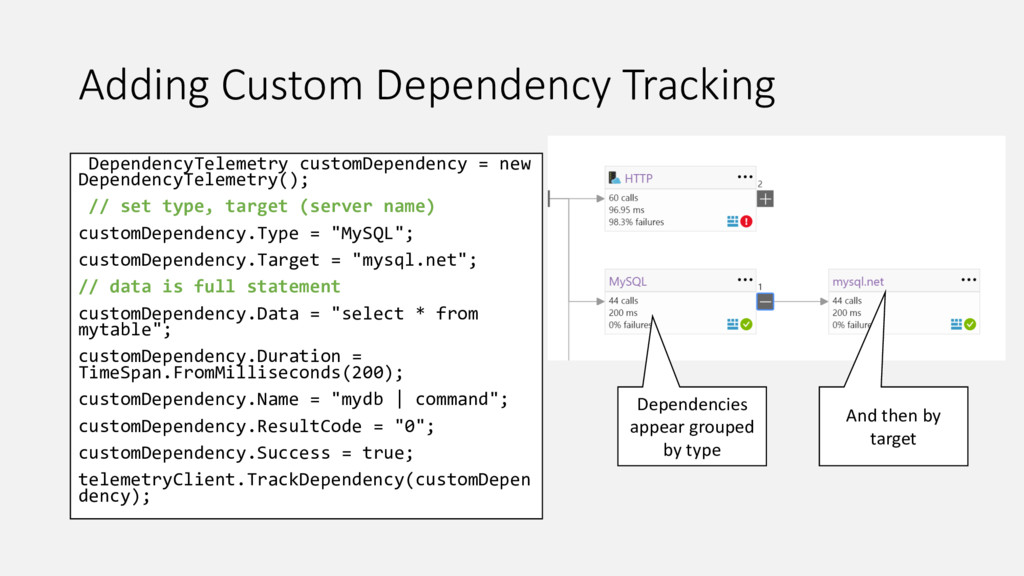
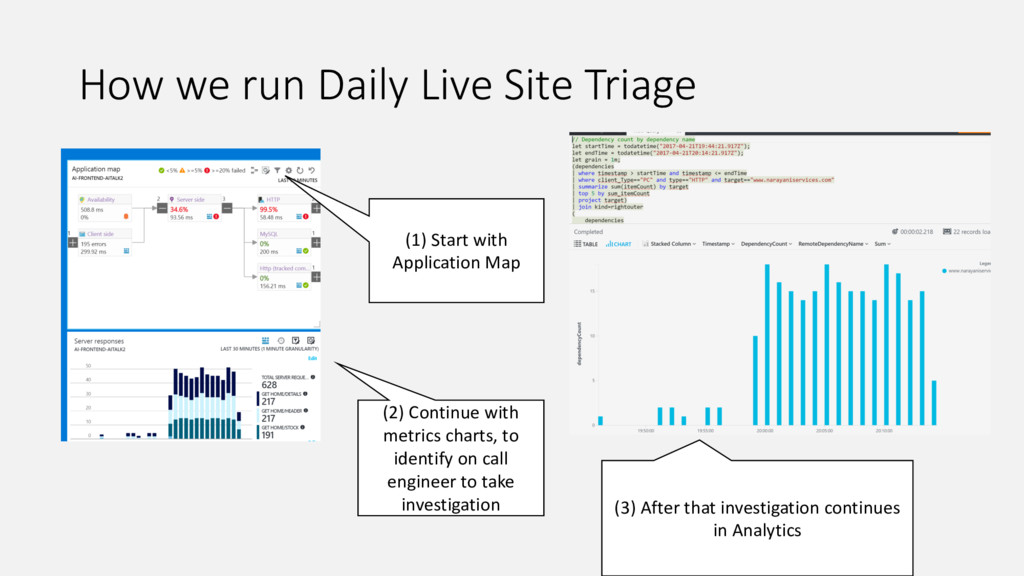
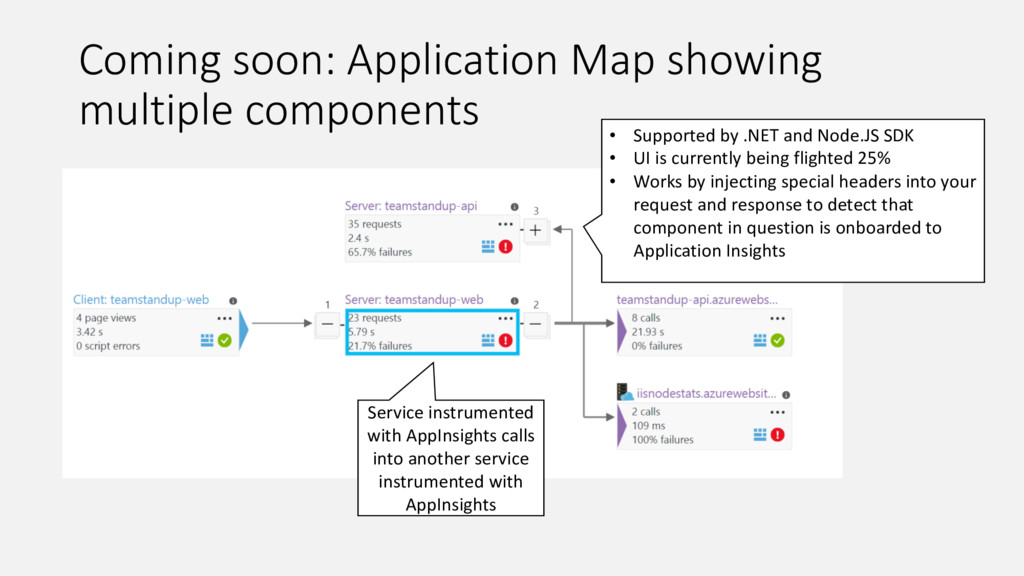
If you have a collection of ASP.NET, Node.JS or Java micro-services running in Azure you are one click away from visualizing your topology. View high level metrics for requests, failures, HTTP and SQL outgoing calls, then drill down to specific transactions - with Microsoft Application Insights.

Alex is a software development manager at Microsoft Application Insights, a service that helps to detect, triage and diagnose issues with web applications and services. Prior to that Alex was a developer on Visual Studio, Bing and Office 365 teams building UX and data visualizations for client and web platforms. As a hobby Alex is bootstrapping an Open Street Map service that helps road travellers find places to stop along the way to their destination: www.stopbystop.com.

Azure Zurich User Group

April 22, 2017
Tweet

More Decks by Azure Zurich User Group

Other Decks in Technology

Transcript

  1. Topology Visualization for your Service With Application Map With one

    click enablement on Azure Alex Bulankou @bulankou
  2. Microsoft Application Insights • Application Insights is an extensible APM

    service for web service developers on multiple platforms • We have SDKs for .NET, ASP.NET Core, JavaScript, Node.JS, Java, Python, PHP, Go • We are “Azure first but not only”: premium integration and enablement for Azure- hosted services, but support on-prem services and other cloud platforms • As long as you are willing to have your telemetry sent to Azure
  3. Topology Diagrams is Often Best Way to Communicate (But can

    be a lot of work) • Great communication tool • Easily go out of date • Separated from performance/health data for each service
  4. DEMO: Generate your Topology in One Click (1) Central node

    represents your service (2) Client node represents the clients onboarded to AppInsights JS SDK (3) HTTP calls from client are AJAX requests (4) 100% of failures in this case clearly identifies configuration error
  5. Application Map for our Realistic Service We identify Azure worker

    roles, Azure queue, blob, storage and are adding identification for more dependency types (DocumentDB, Redis, EventHub) Availability tests results Custom thresholds
  6. Adding Custom Dependency Tracking DependencyTelemetry customDependency = new DependencyTelemetry(); //

    set type, target (server name) customDependency.Type = "MySQL"; customDependency.Target = "mysql.net"; // data is full statement customDependency.Data = "select * from mytable"; customDependency.Duration = TimeSpan.FromMilliseconds(200); customDependency.Name = "mydb | command"; customDependency.ResultCode = "0"; customDependency.Success = true; telemetryClient.TrackDependency(customDepen dency); Dependencies appear grouped by type And then by target
  7. How we run Daily Live Site Triage (2) Continue with

    metrics charts, to identify on call engineer to take investigation (1) Start with Application Map (3) After that investigation continues in Analytics
  8. Coming soon: Application Map showing multiple components Service instrumented with

    AppInsights calls into another service instrumented with AppInsights • Supported by .NET and Node.JS SDK • UI is currently being flighted 25% • Works by injecting special headers into your request and response to detect that component in question is onboarded to Application Insights
  9. North Star: combining auto-discovered and custom nodes Splunk glass table:

    you can add your nodes and associated metrics for each node. Then you are able to monitor the whole suite of micro-services with single pane of glass