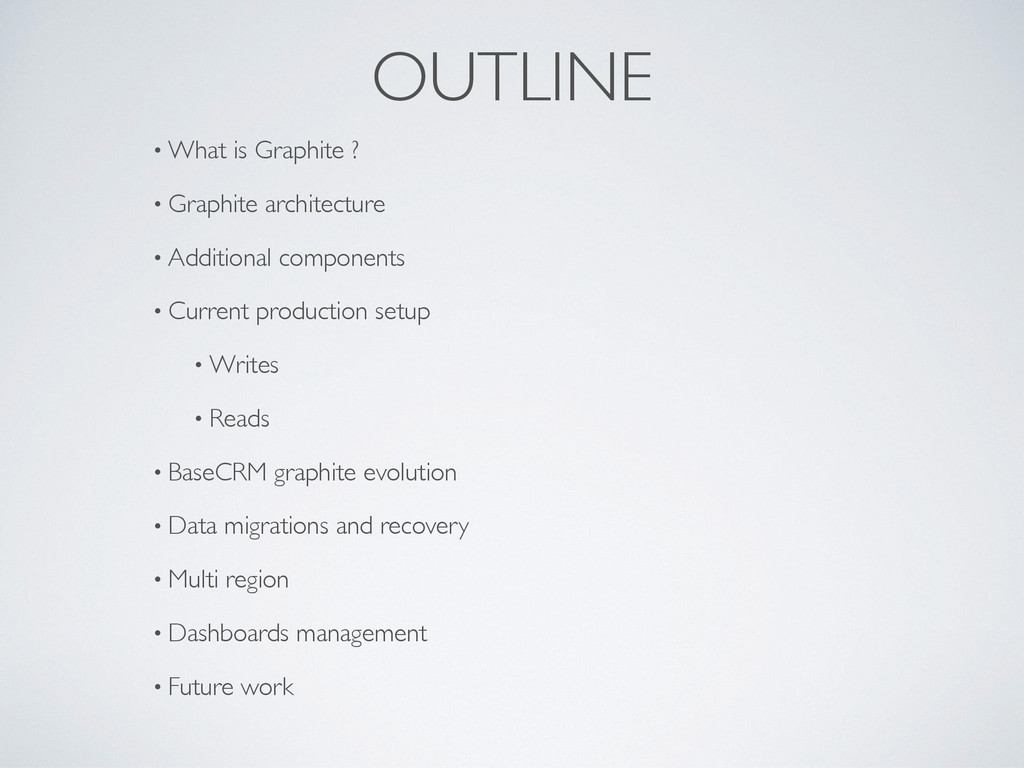
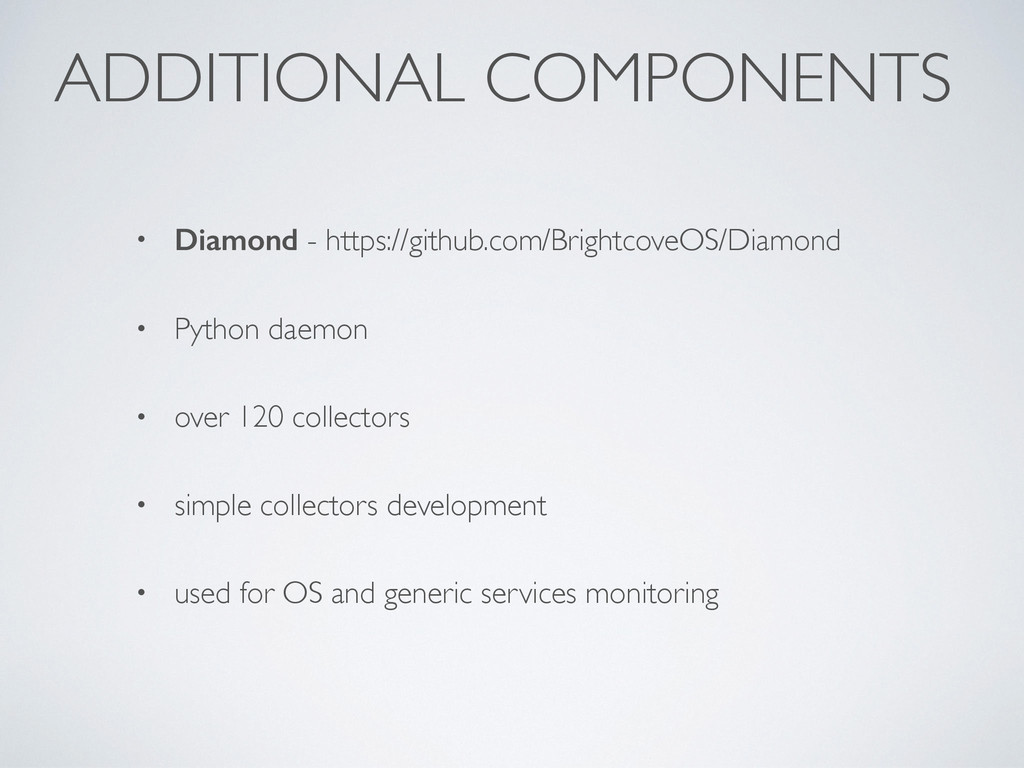
Additional components • Current production setup • Writes • Reads • BaseCRM graphite evolution • Data migrations and recovery • Multi region • Dashboards management • Future work
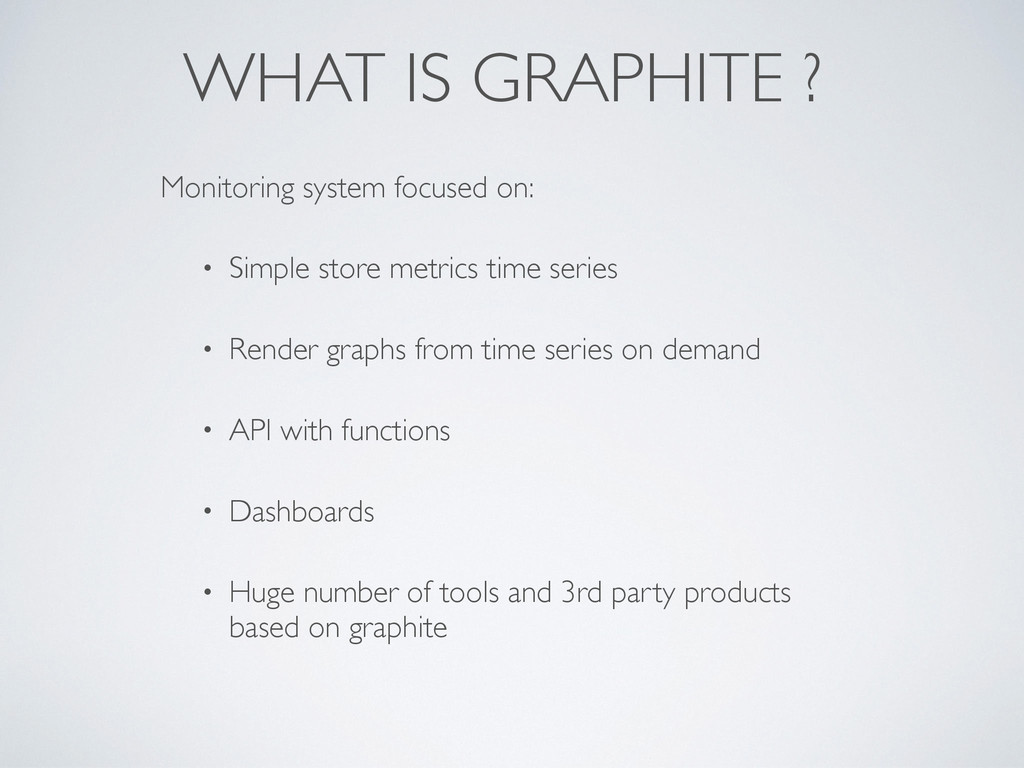
• Render graphs from time series on demand • API with functions • Dashboards • Huge number of tools and 3rd party products based on graphite WHAT IS GRAPHITE ?
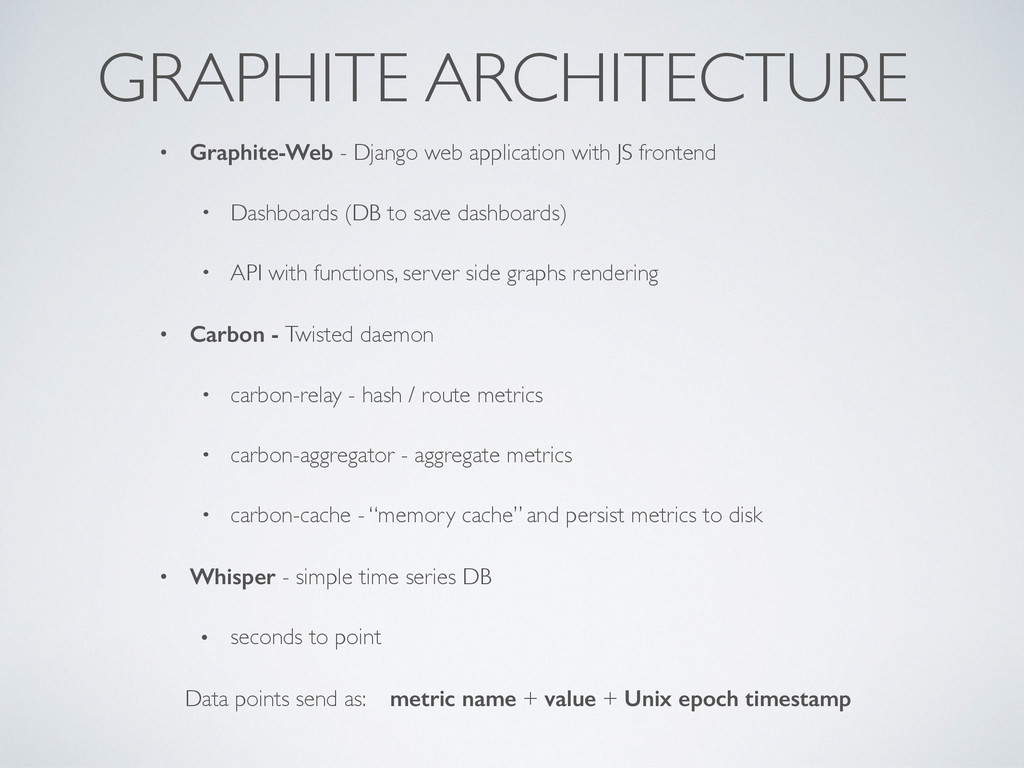
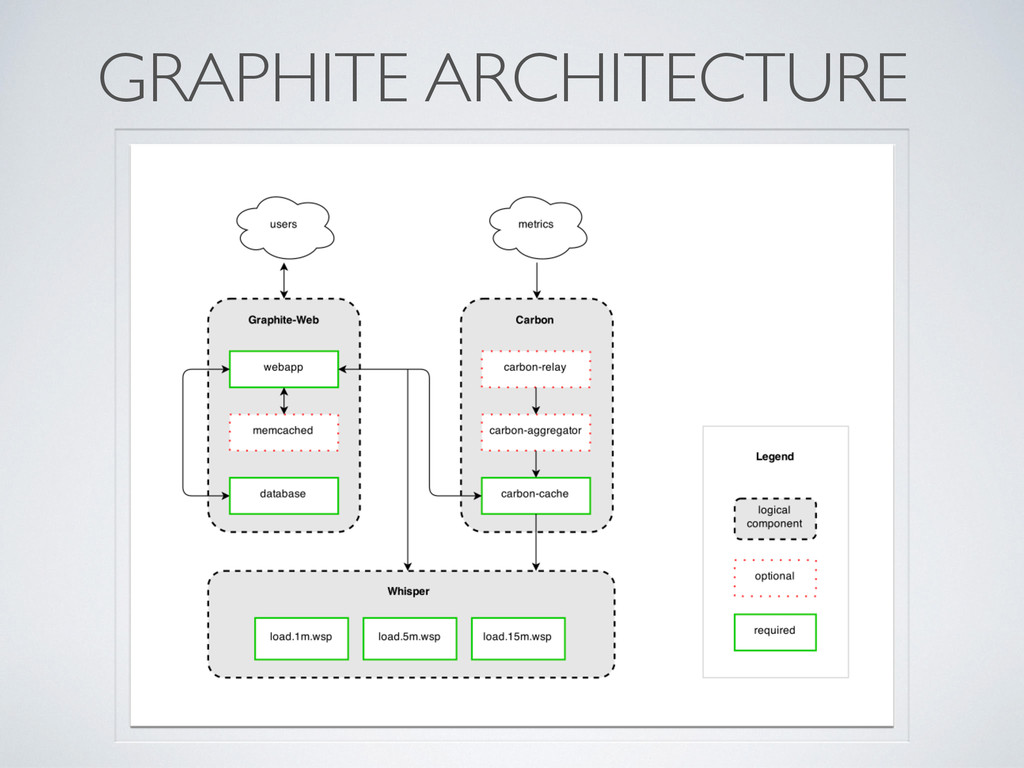
Dashboards (DB to save dashboards) • API with functions, server side graphs rendering • Carbon - Twisted daemon • carbon-relay - hash / route metrics • carbon-aggregator - aggregate metrics • carbon-cache - “memory cache” and persist metrics to disk • Whisper - simple time series DB • seconds to point Data points send as: metric name + value + Unix epoch timestamp GRAPHITE ARCHITECTURE
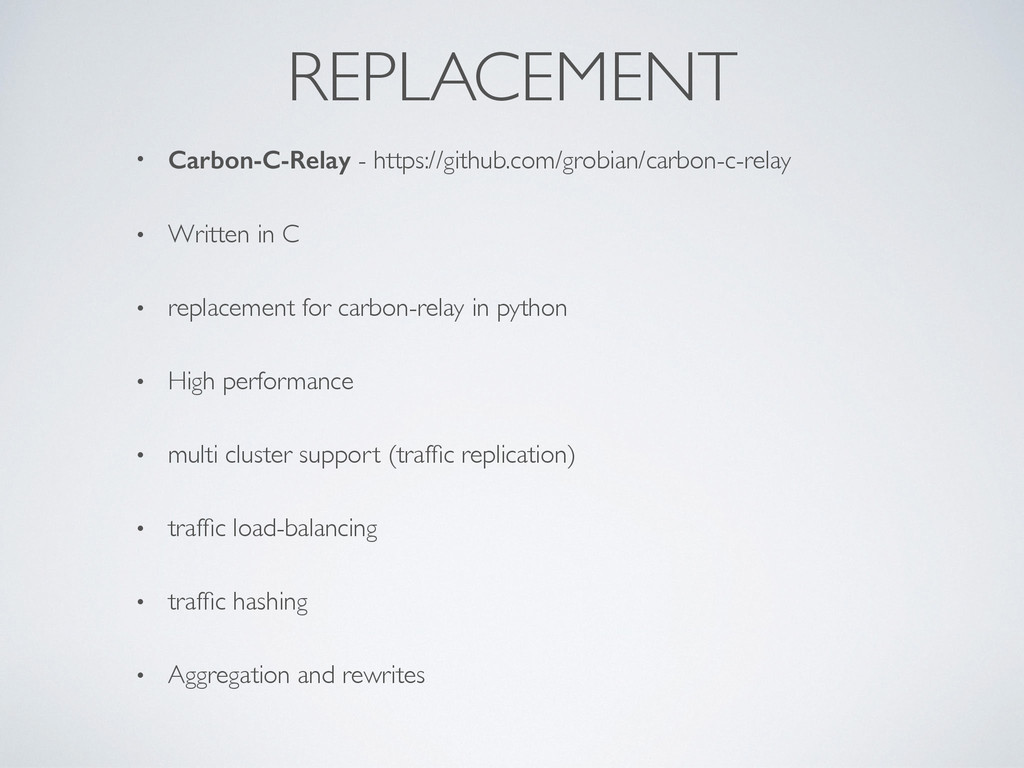
replacement for carbon-relay in python • High performance • multi cluster support (traffic replication) • traffic load-balancing • traffic hashing • Aggregation and rewrites
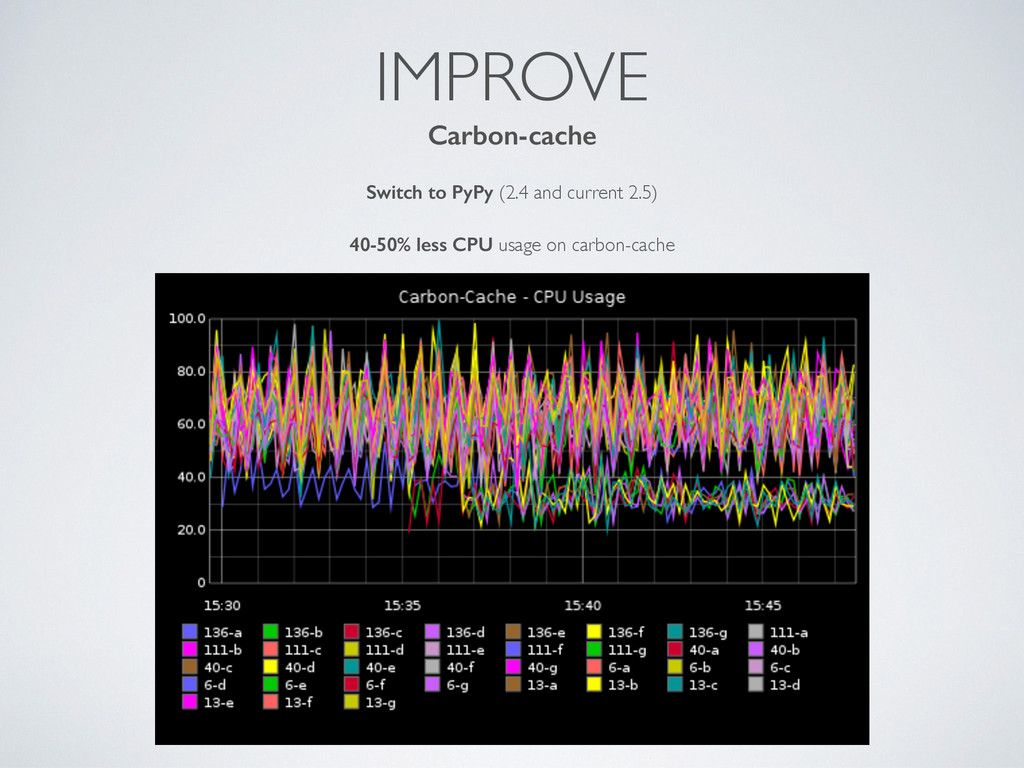
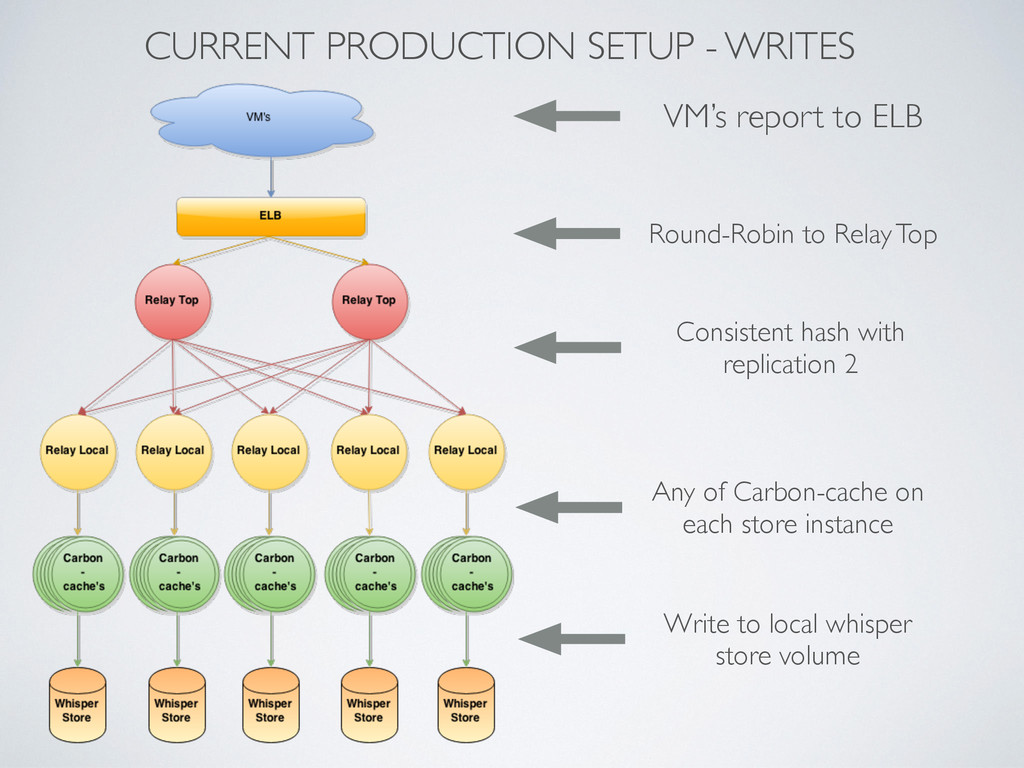
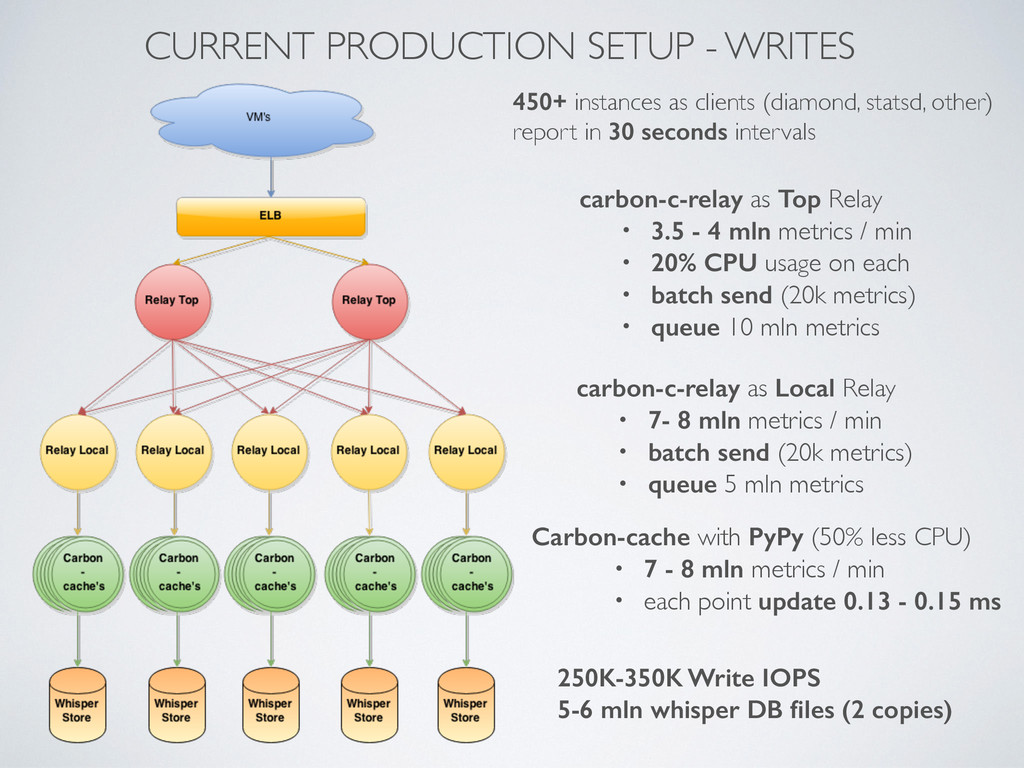
statsd, other) report in 30 seconds intervals carbon-c-relay as Top Relay • 3.5 - 4 mln metrics / min • 20% CPU usage on each • batch send (20k metrics) • queue 10 mln metrics carbon-c-relay as Local Relay • 7- 8 mln metrics / min • batch send (20k metrics) • queue 5 mln metrics Carbon-cache with PyPy (50% less CPU) • 7 - 8 mln metrics / min • each point update 0.13 - 0.15 ms 250K-350K Write IOPS 5-6 mln whisper DB files (2 copies)
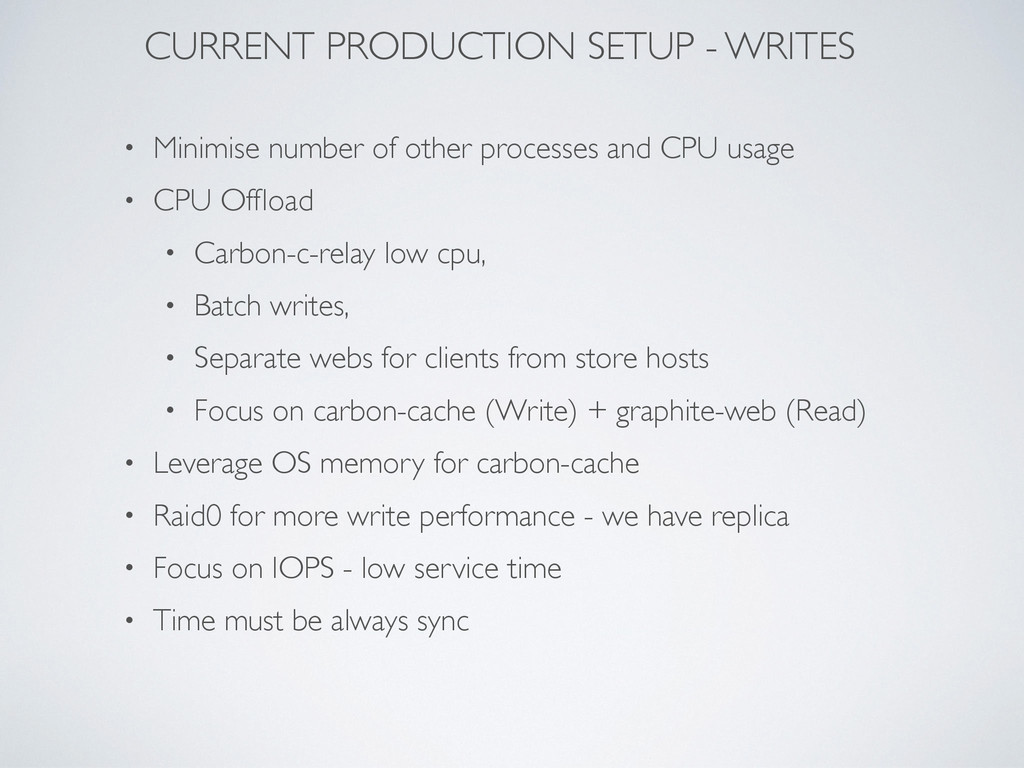
processes and CPU usage • CPU Offload • Carbon-c-relay low cpu, • Batch writes, • Separate webs for clients from store hosts • Focus on carbon-cache (Write) + graphite-web (Read) • Leverage OS memory for carbon-cache • Raid0 for more write performance - we have replica • Focus on IOPS - low service time • Time must be always sync
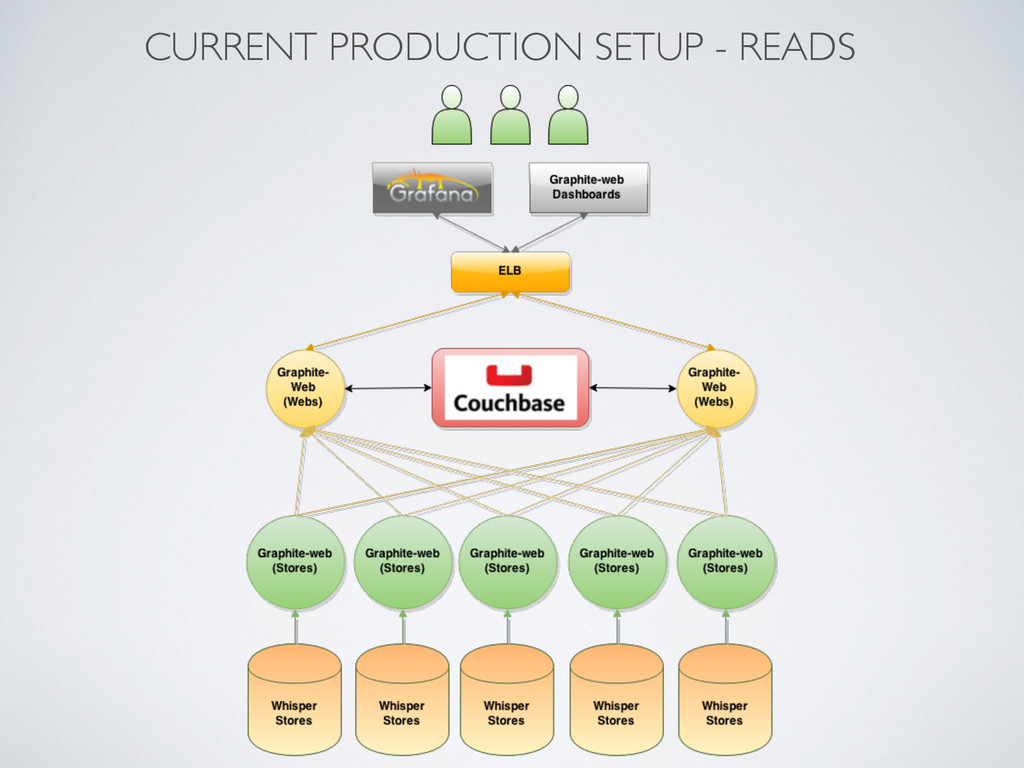
Graphite-Web Graphite-web django backend as API for Grafana Couchbase as cache for graphite-web metrics Each store as API via graphite-web Average response <300ms Nginx on top behind ELB Webs calculates functions, stores serves RAW metrics (CPU offload)
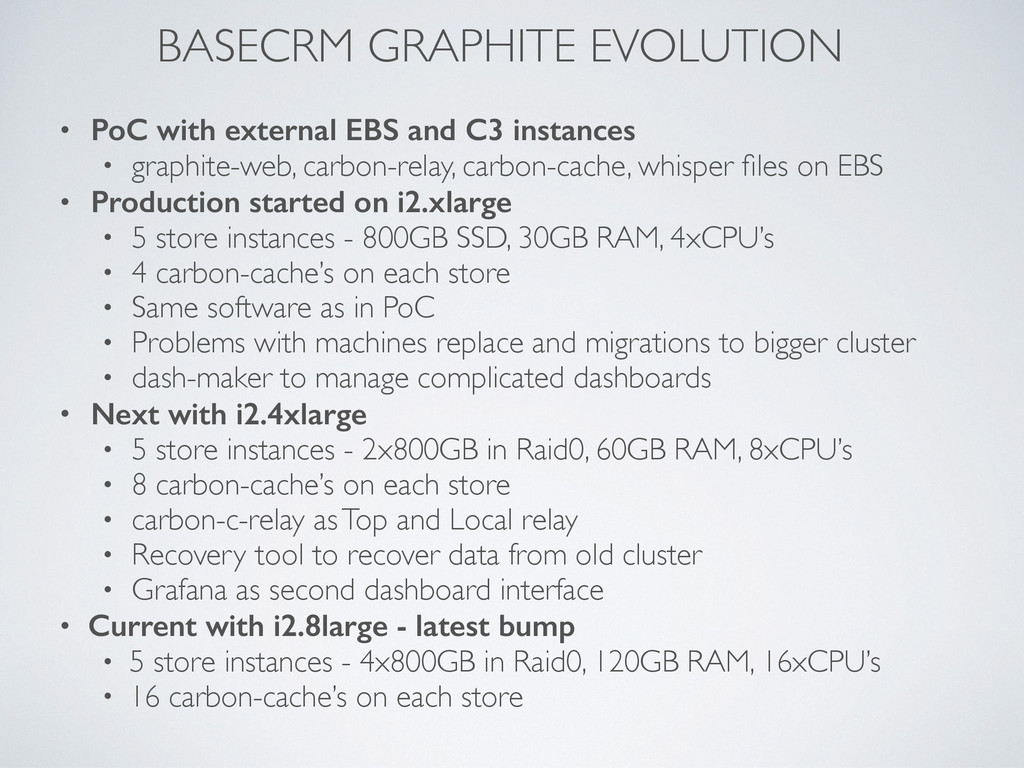
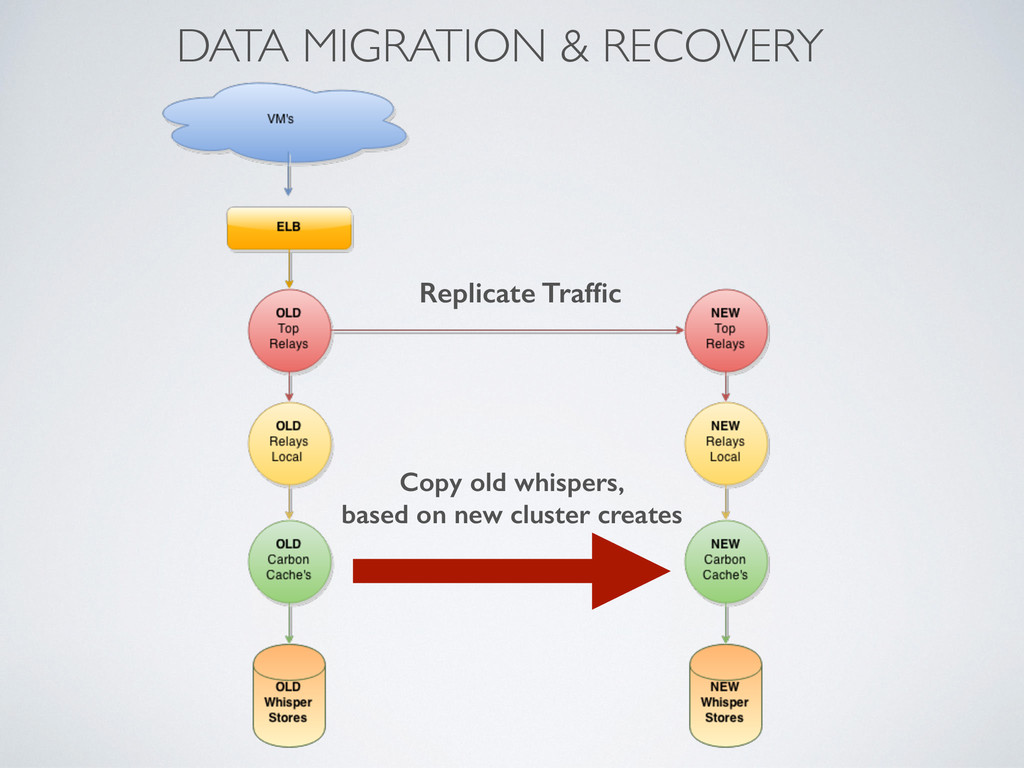
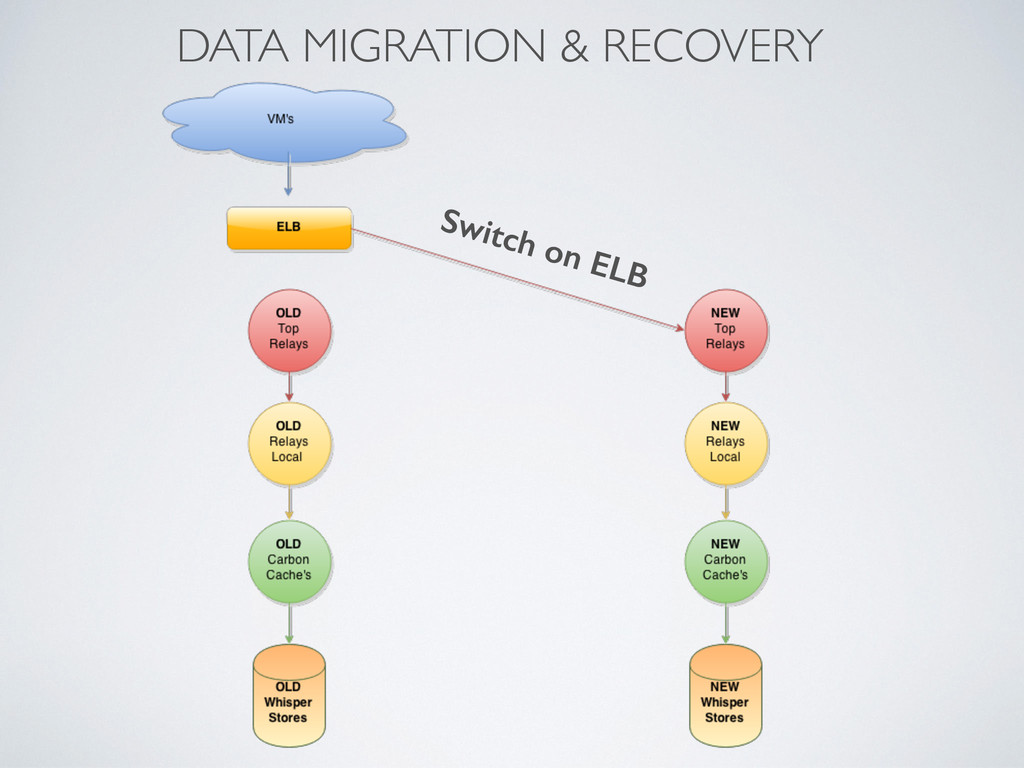
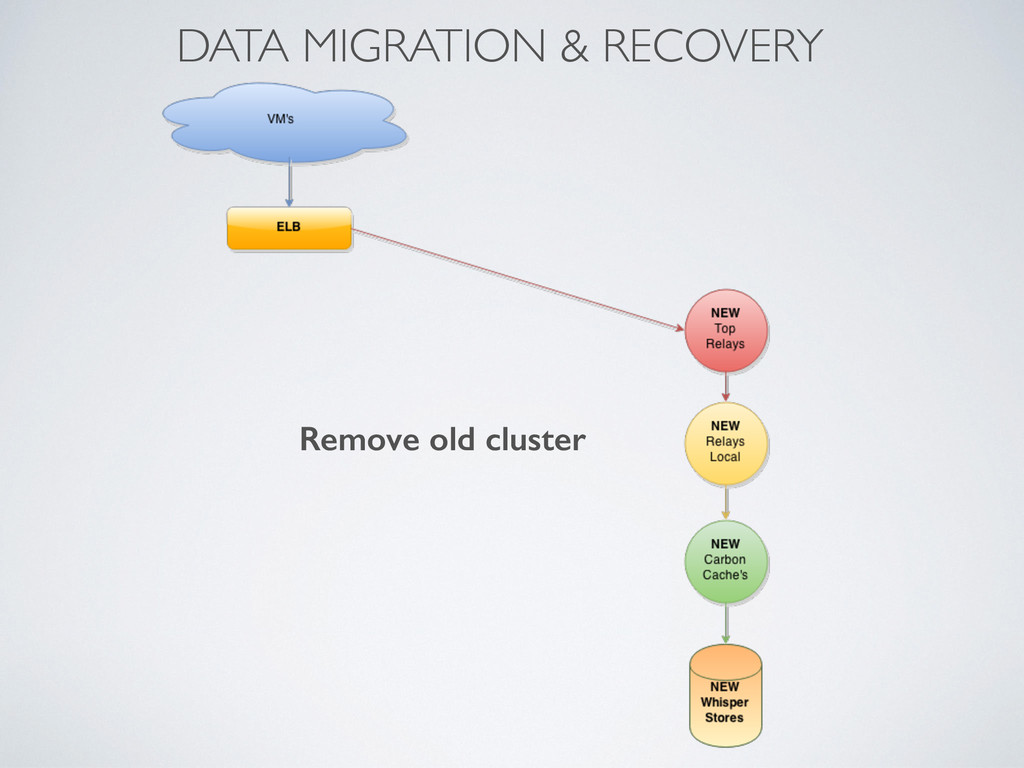
instances • graphite-web, carbon-relay, carbon-cache, whisper files on EBS • Production started on i2.xlarge • 5 store instances - 800GB SSD, 30GB RAM, 4xCPU’s • 4 carbon-cache’s on each store • Same software as in PoC • Problems with machines replace and migrations to bigger cluster • dash-maker to manage complicated dashboards • Next with i2.4xlarge • 5 store instances - 2x800GB in Raid0, 60GB RAM, 8xCPU’s • 8 carbon-cache’s on each store • carbon-c-relay as Top and Local relay • Recovery tool to recover data from old cluster • Grafana as second dashboard interface • Current with i2.8large - latest bump • 5 store instances - 4x800GB in Raid0, 120GB RAM, 16xCPU’s • 16 carbon-cache’s on each store
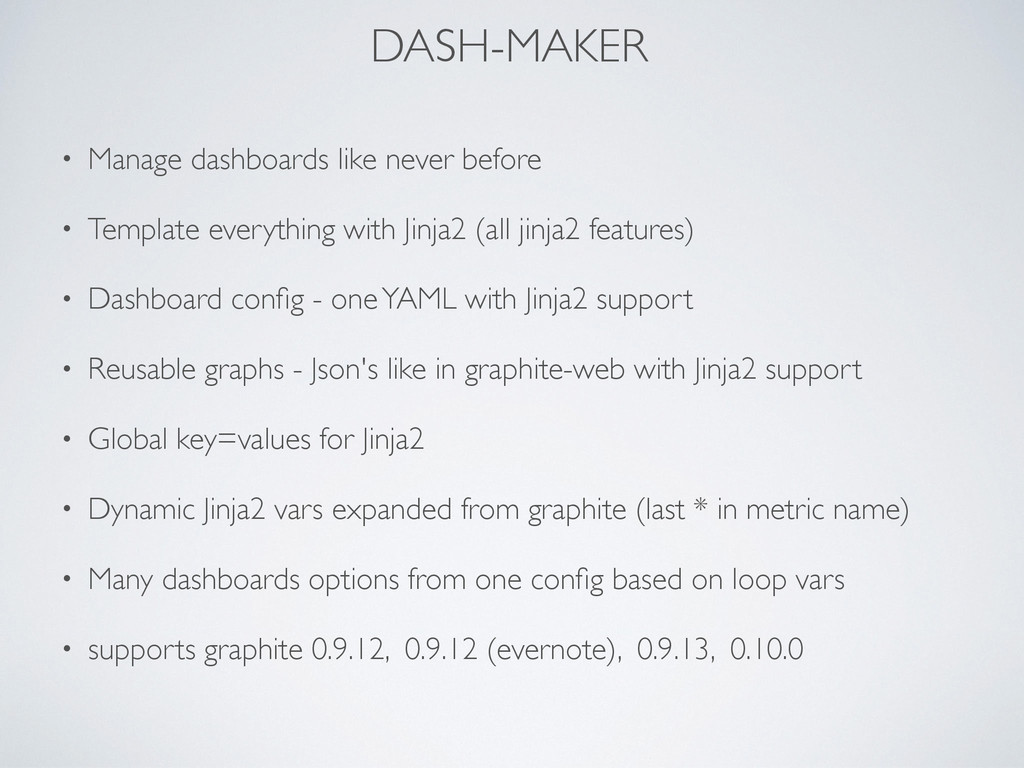
with Jinja2 (all jinja2 features) • Dashboard config - one YAML with Jinja2 support • Reusable graphs - Json's like in graphite-web with Jinja2 support • Global key=values for Jinja2 • Dynamic Jinja2 vars expanded from graphite (last * in metric name) • Many dashboards options from one config based on loop vars • supports graphite 0.9.12, 0.9.12 (evernote), 0.9.13, 0.10.0
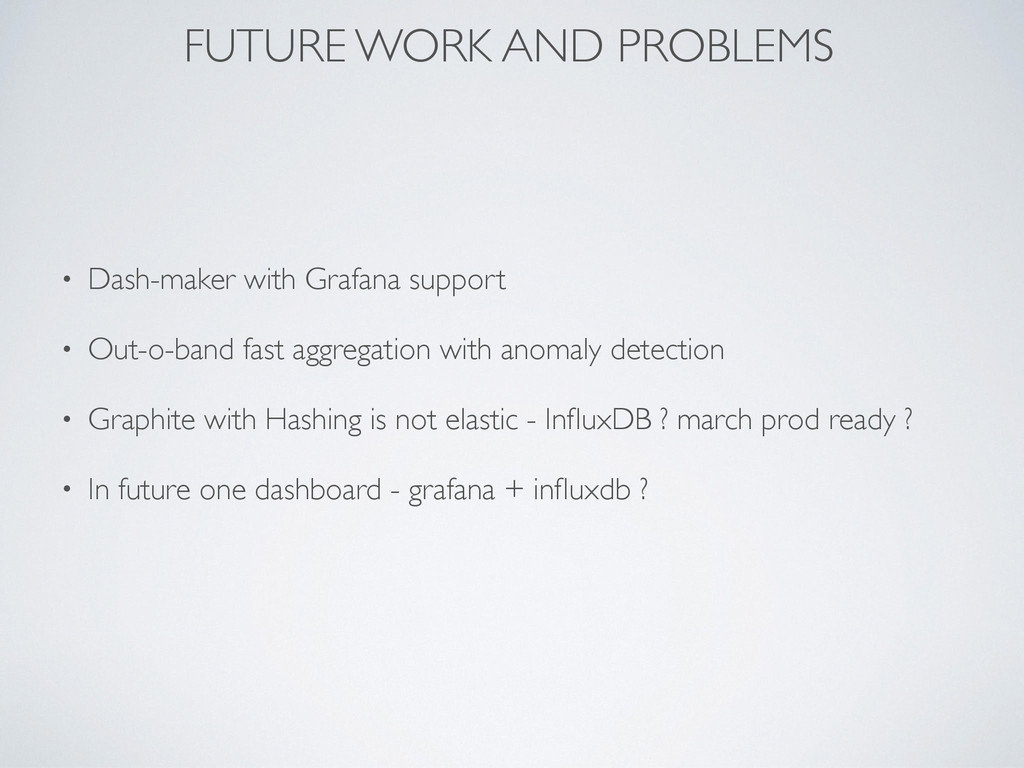
Out-o-band fast aggregation with anomaly detection • Graphite with Hashing is not elastic - InfluxDB ? march prod ready ? • In future one dashboard - grafana + influxdb ?