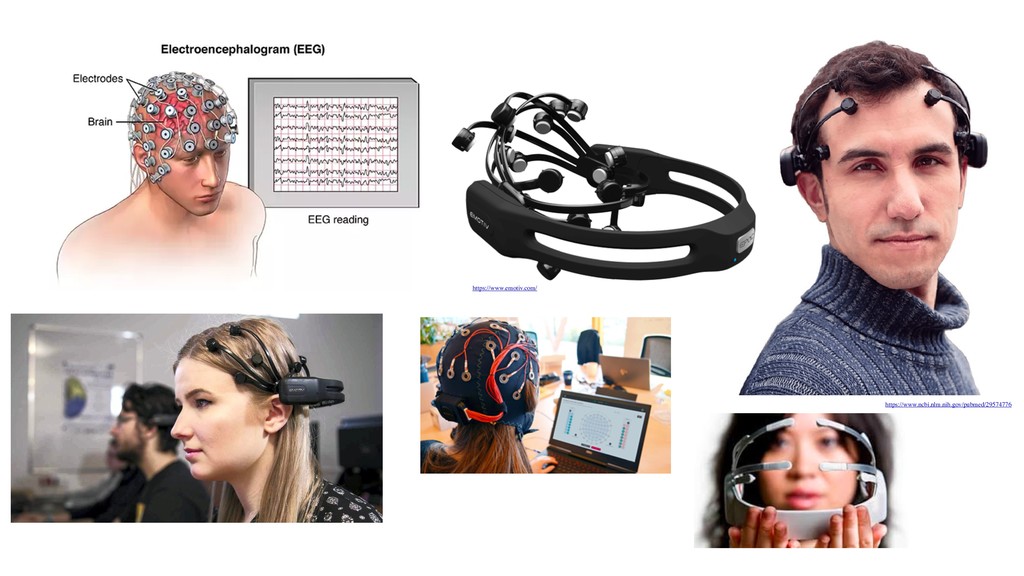
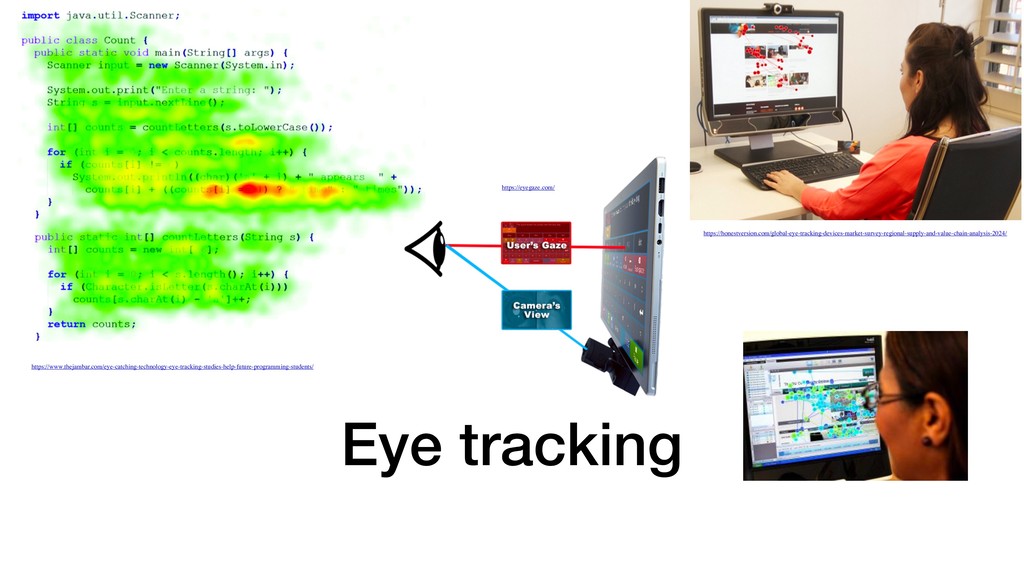
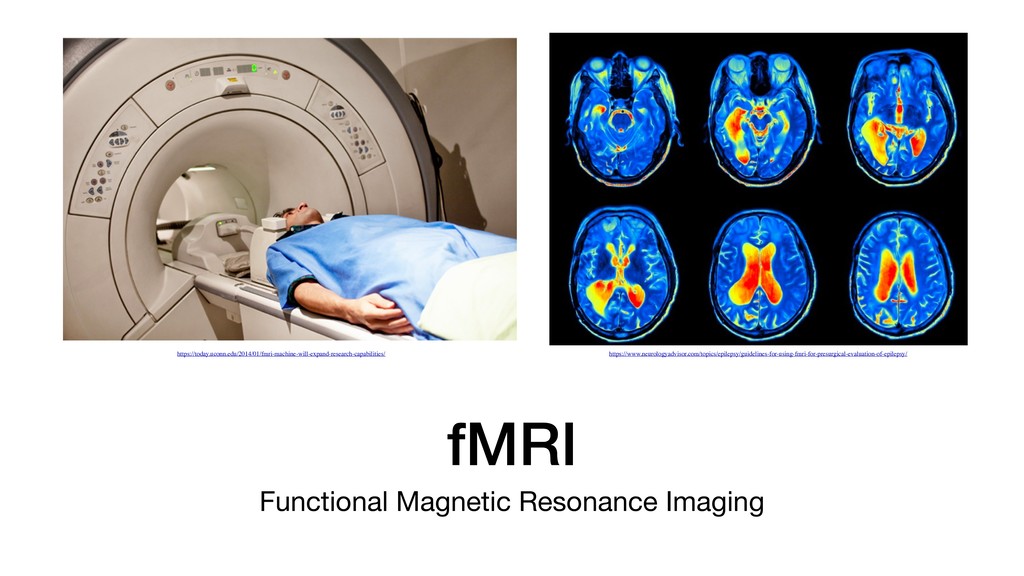
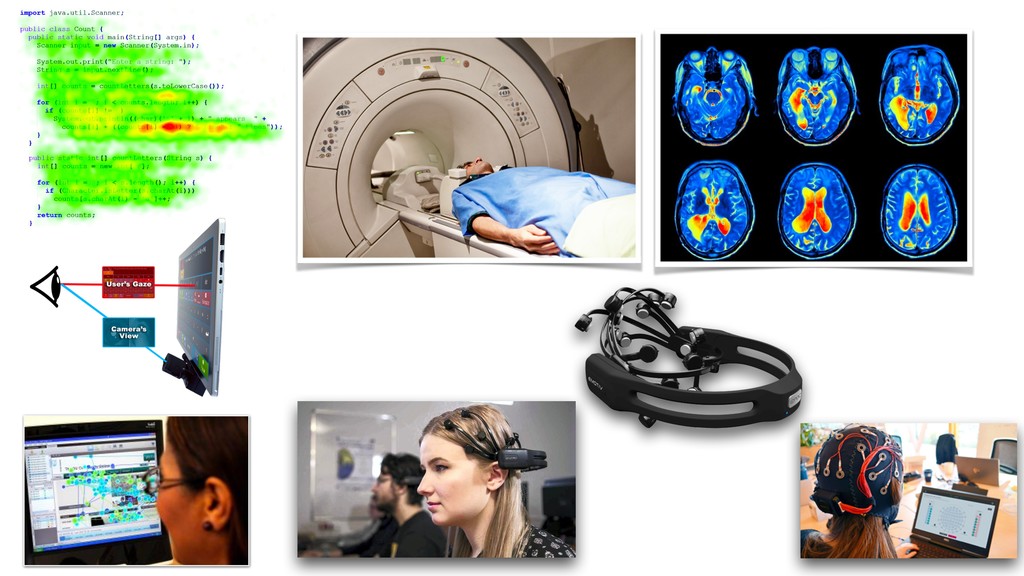
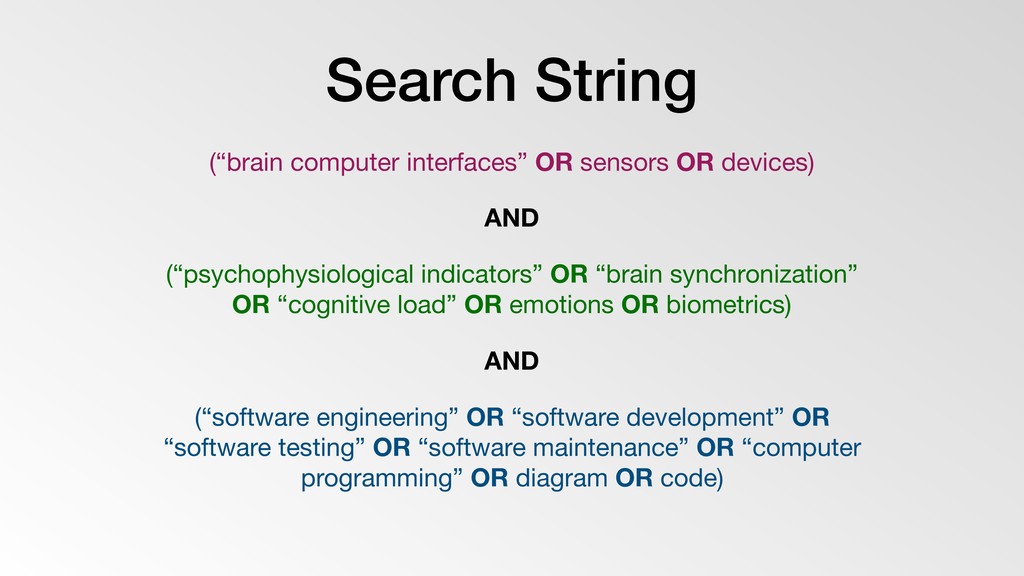
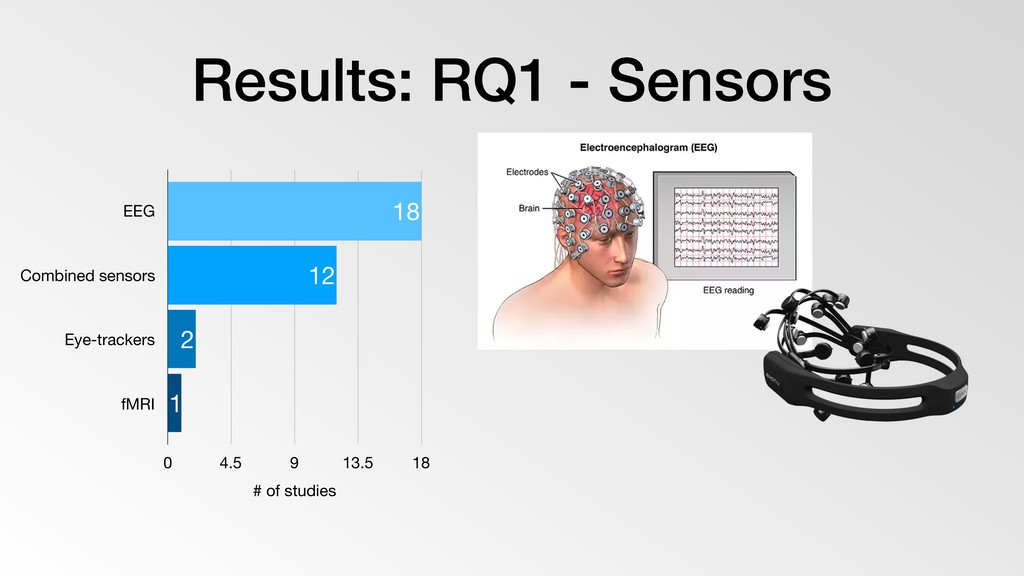
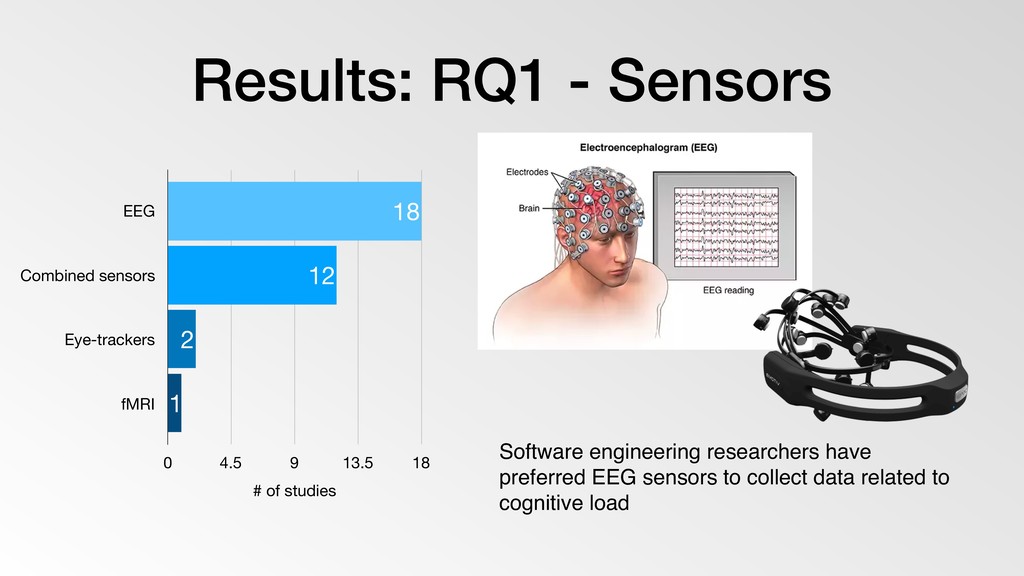
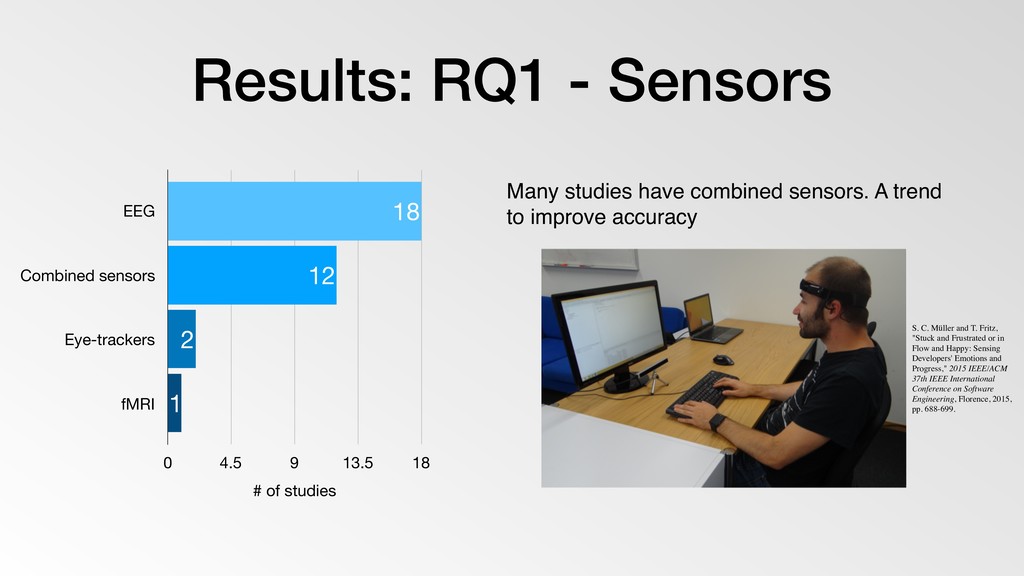
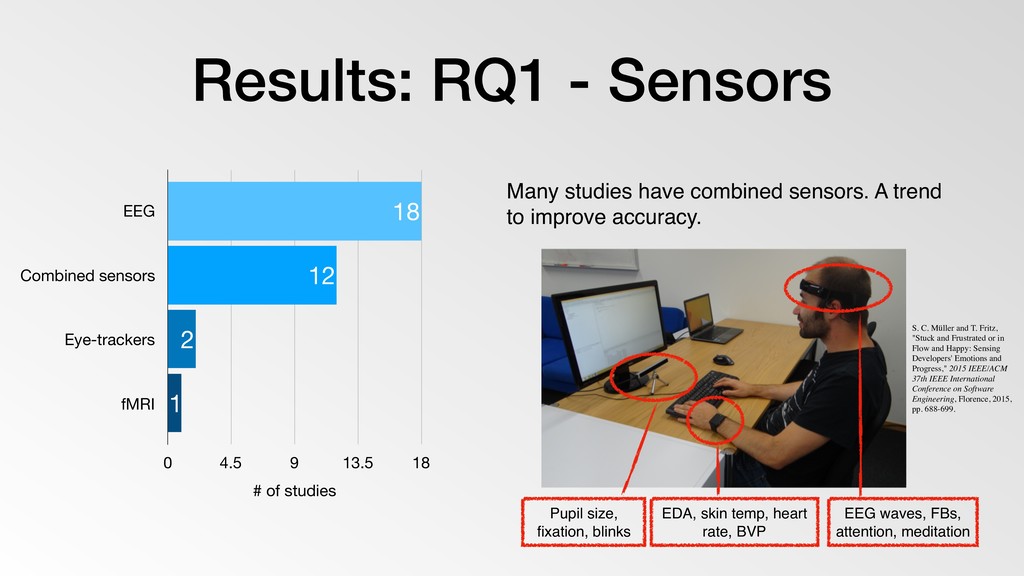
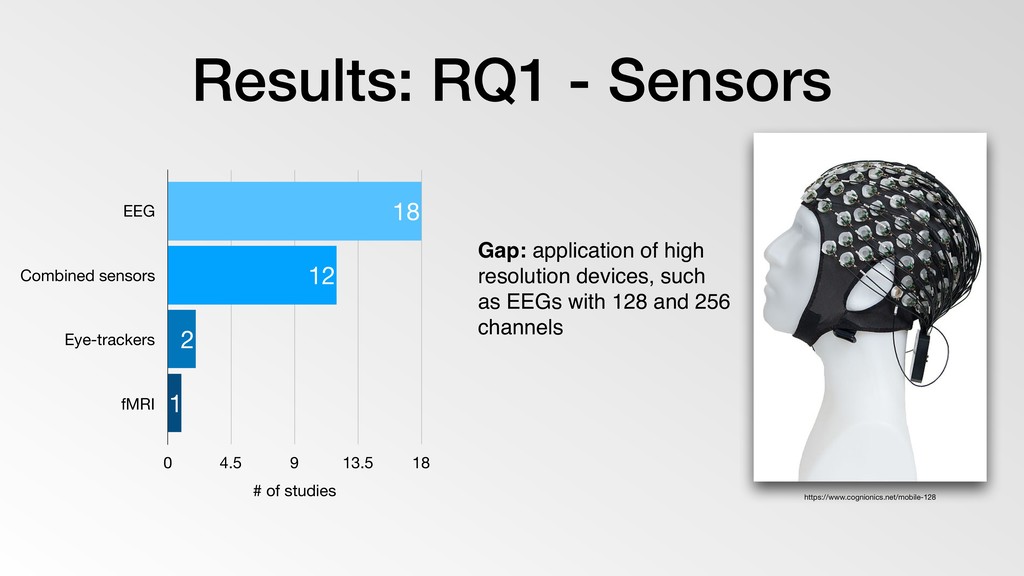
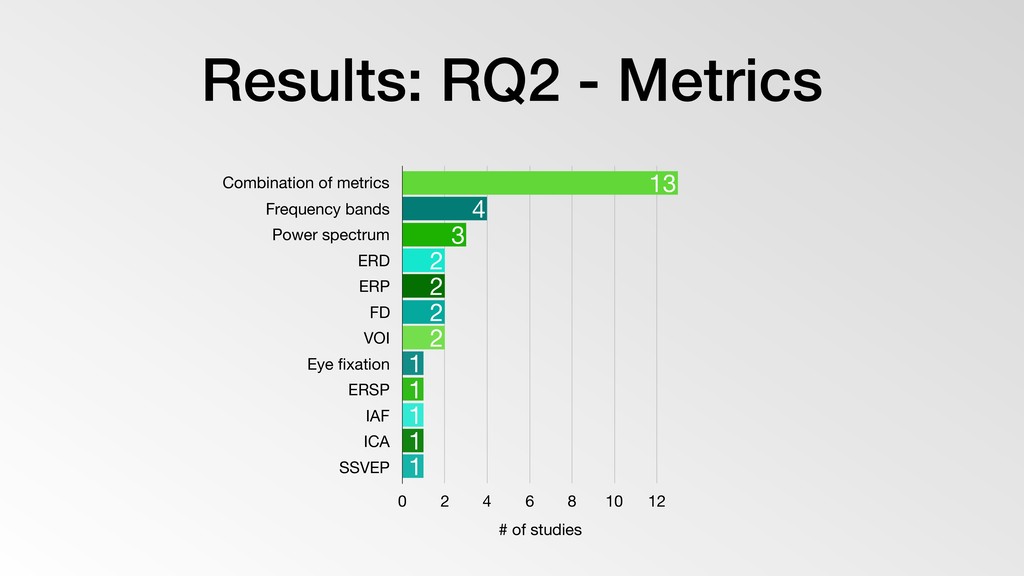
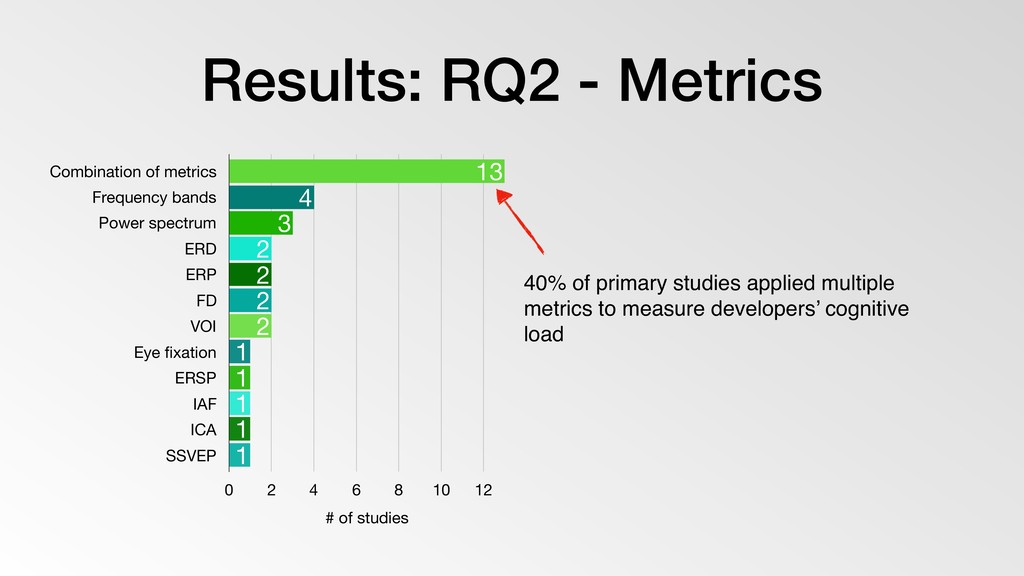
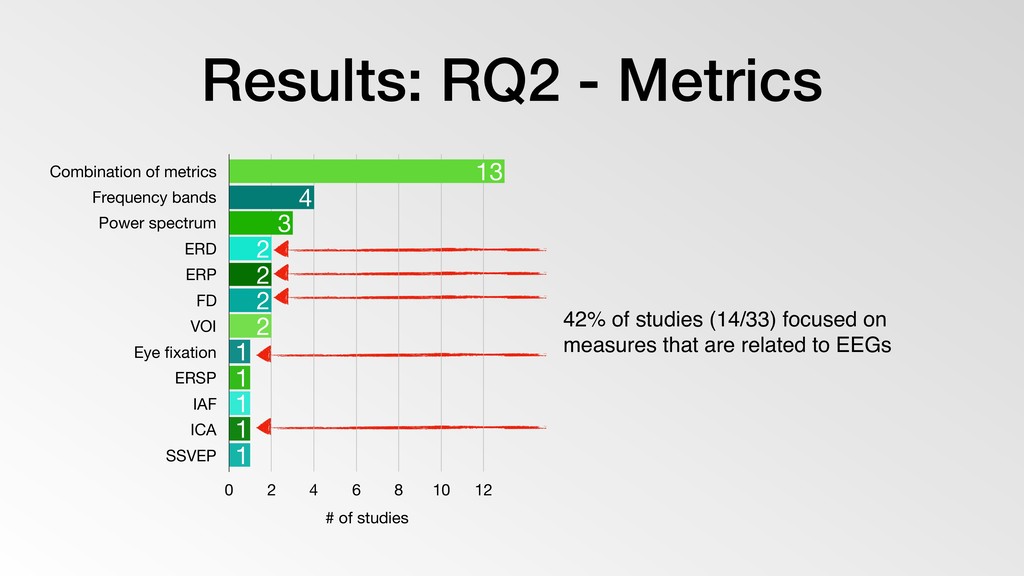
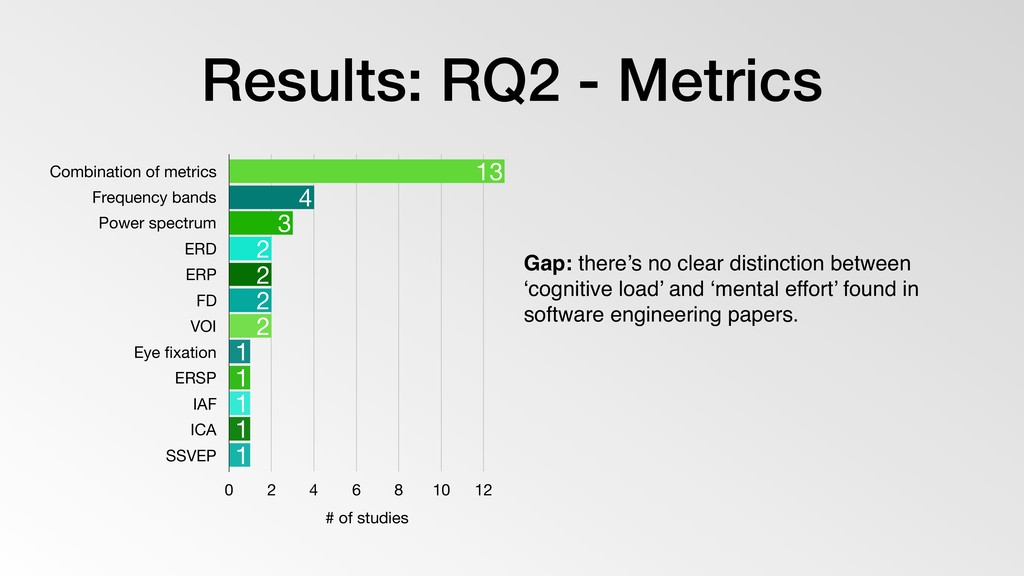
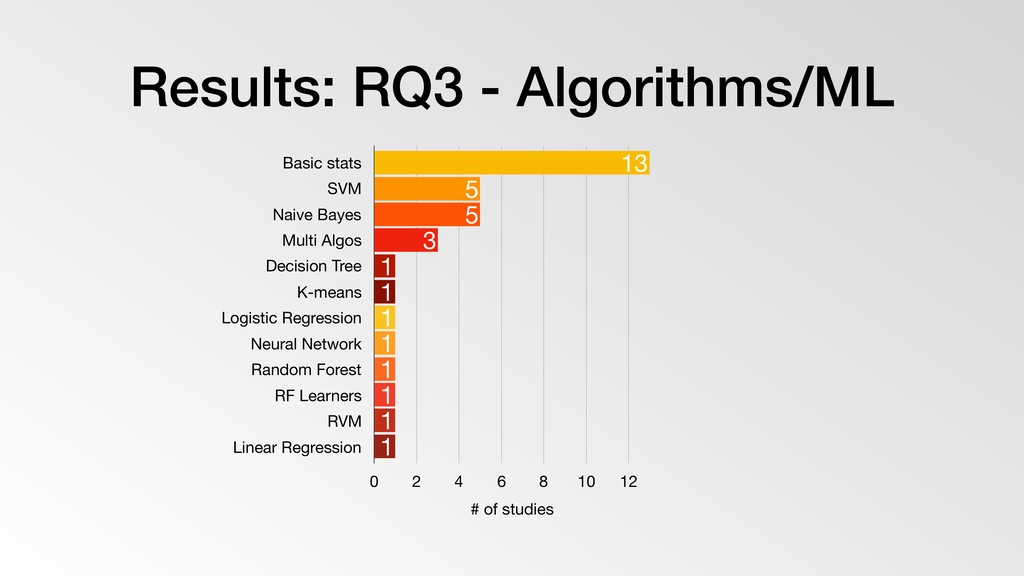
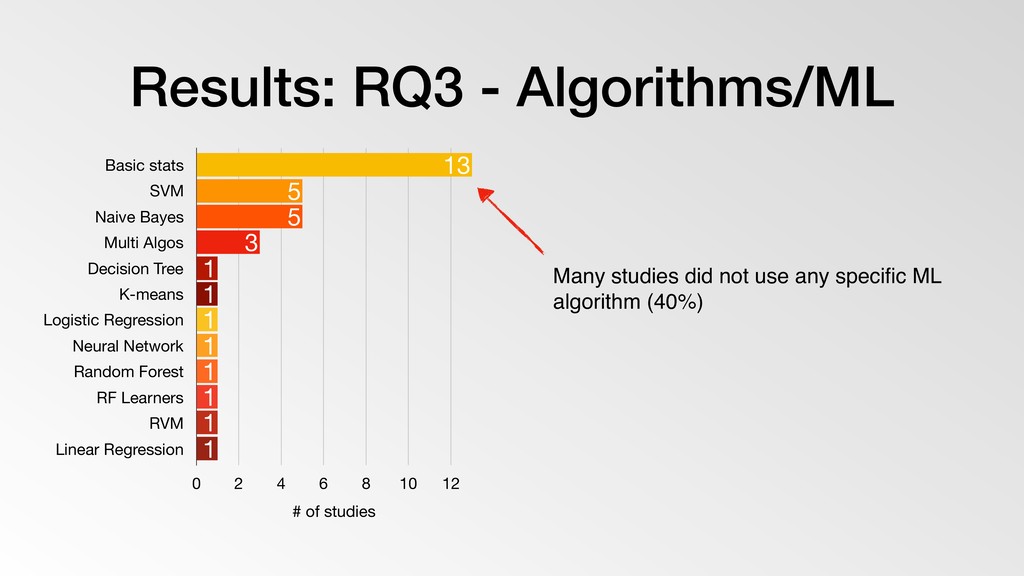
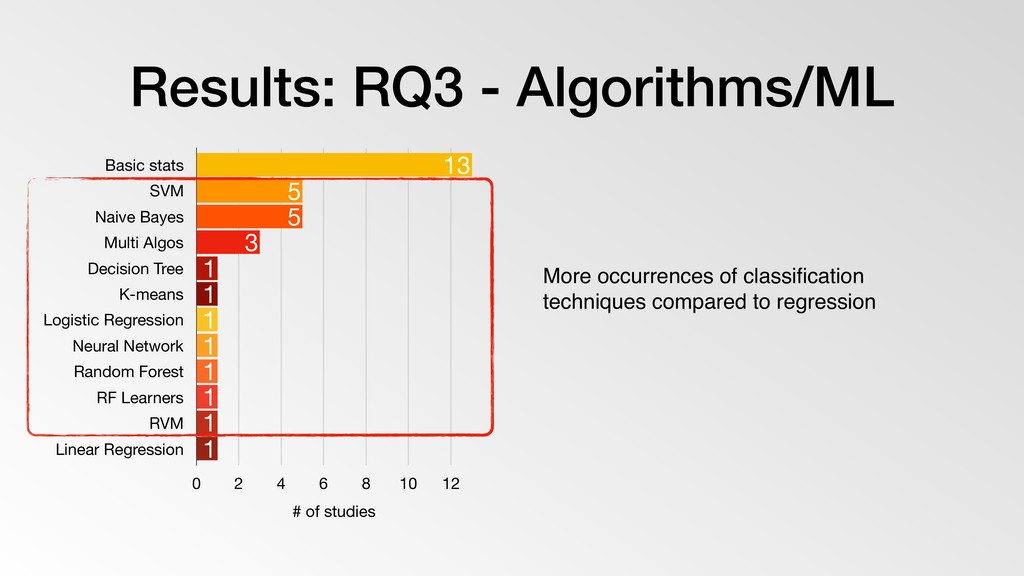
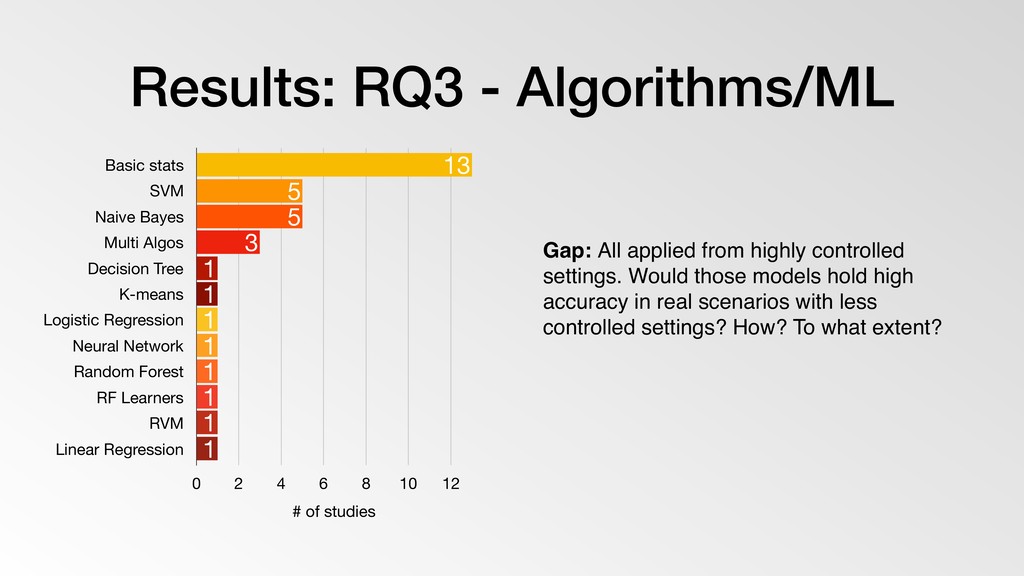
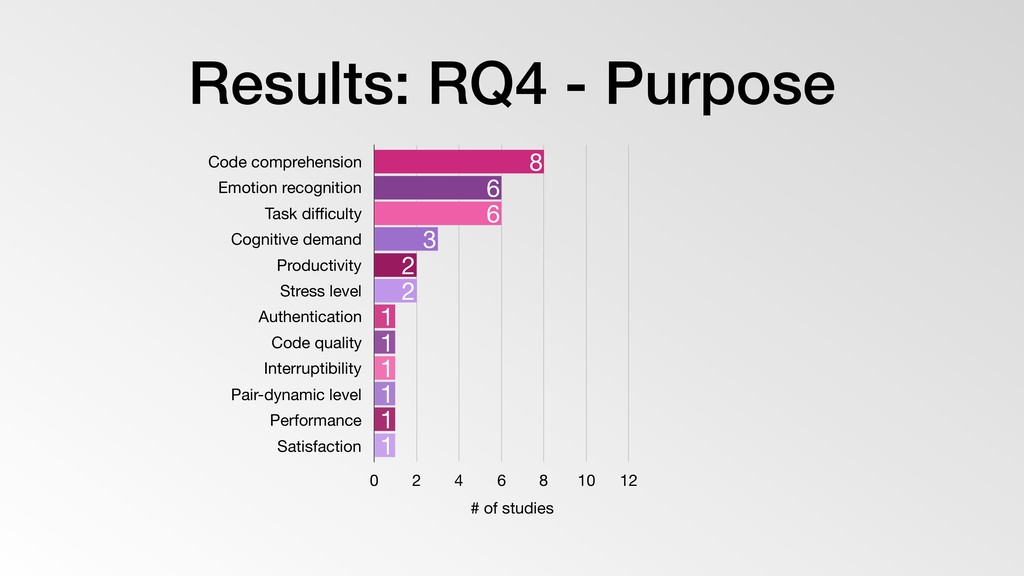
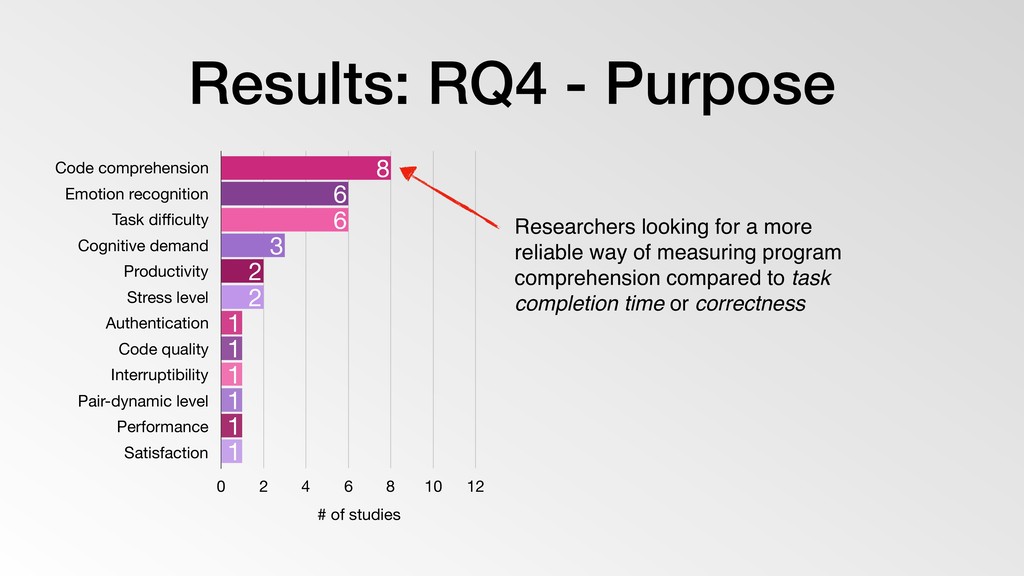
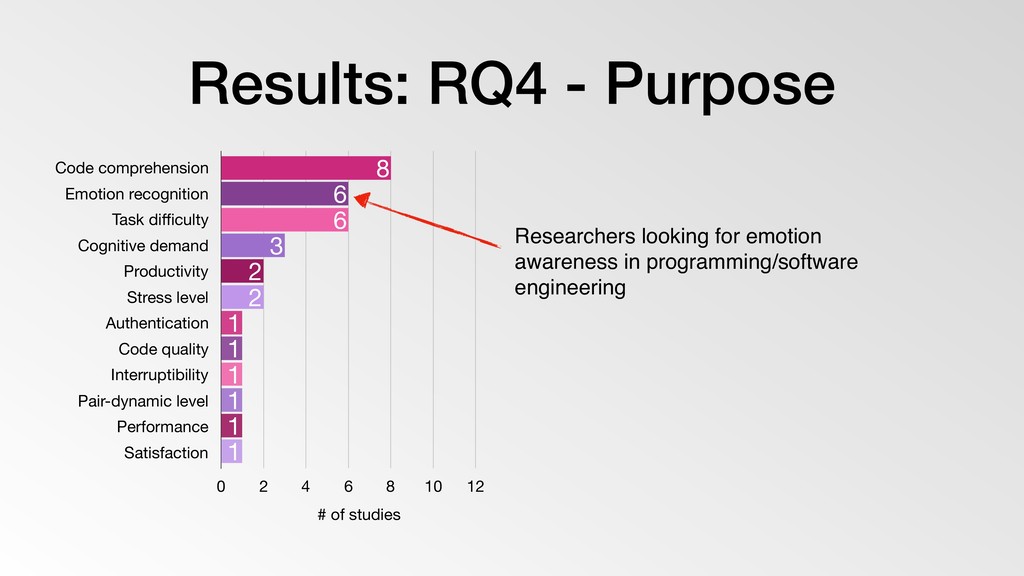
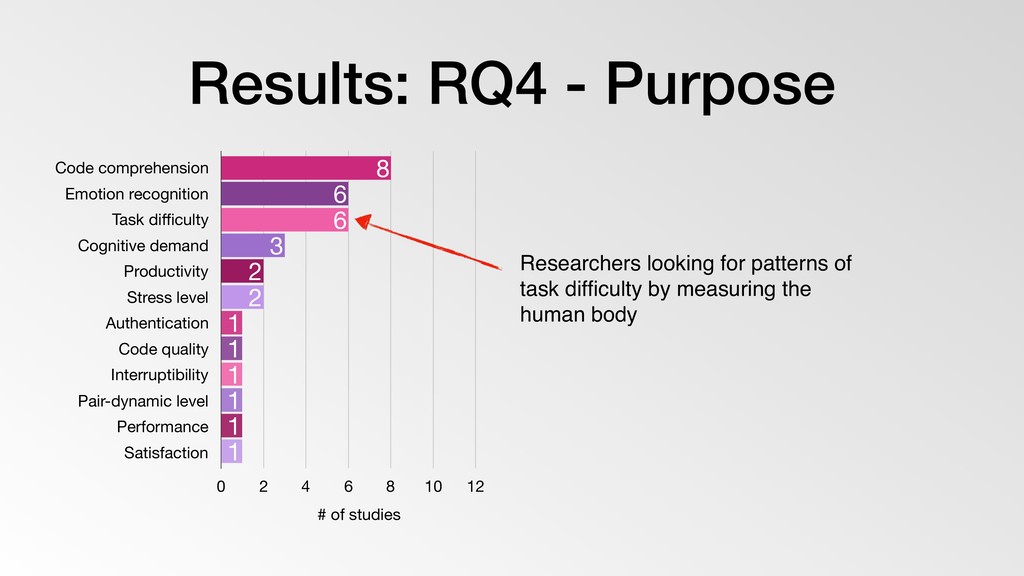
of studies 0 4.5 9 13.5 18 1 2 12 18 Many studies have combined sensors. A trend to improve accuracy. Pupil size, fixation, blinks S. C. Müller and T. Fritz, "Stuck and Frustrated or in Flow and Happy: Sensing Developers' Emotions and Progress," 2015 IEEE/ACM 37th IEEE International Conference on Software Engineering, Florence, 2015, pp. 688-699. EDA, skin temp, heart rate, BVP EEG waves, FBs, attention, meditation