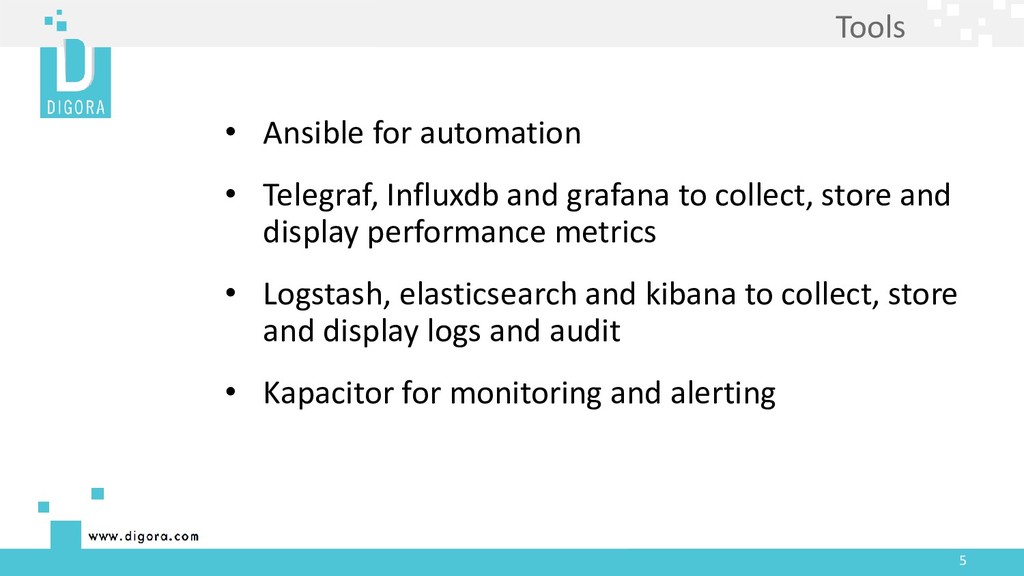
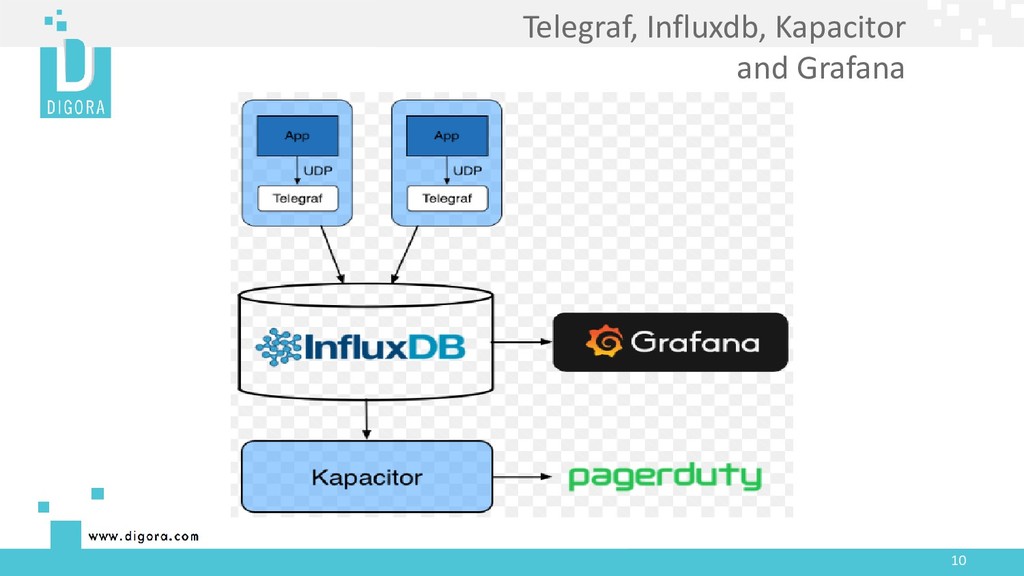
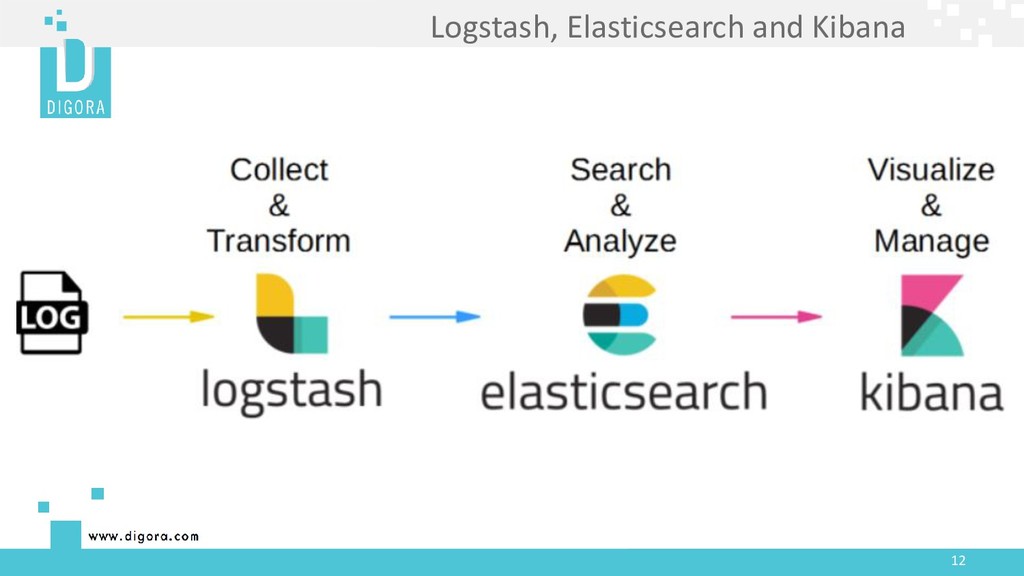
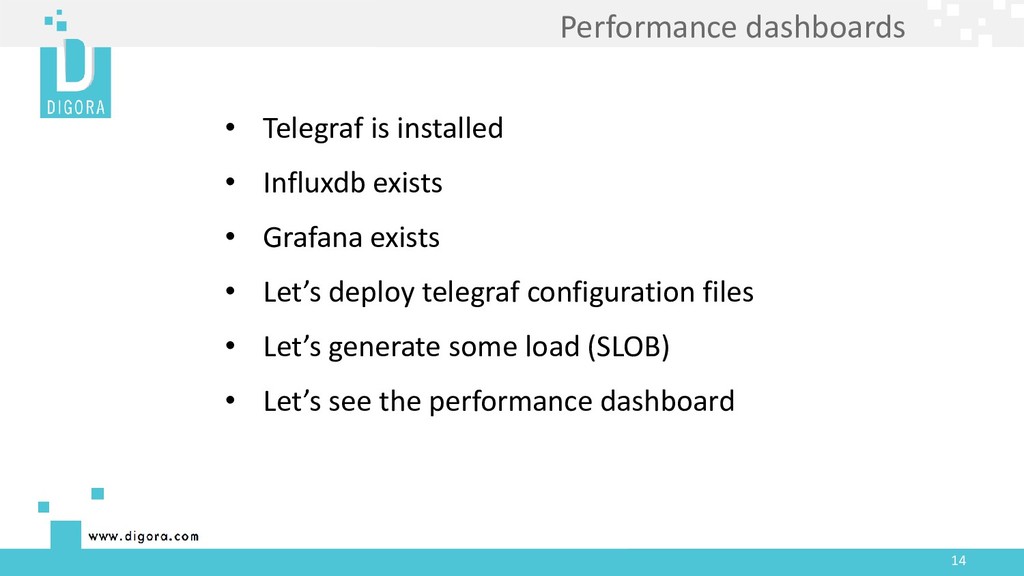
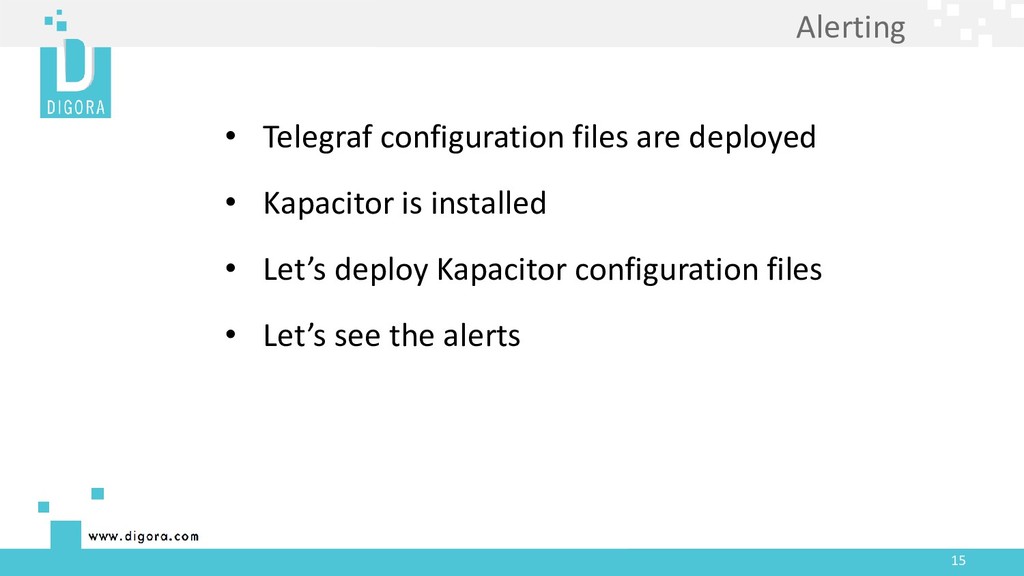
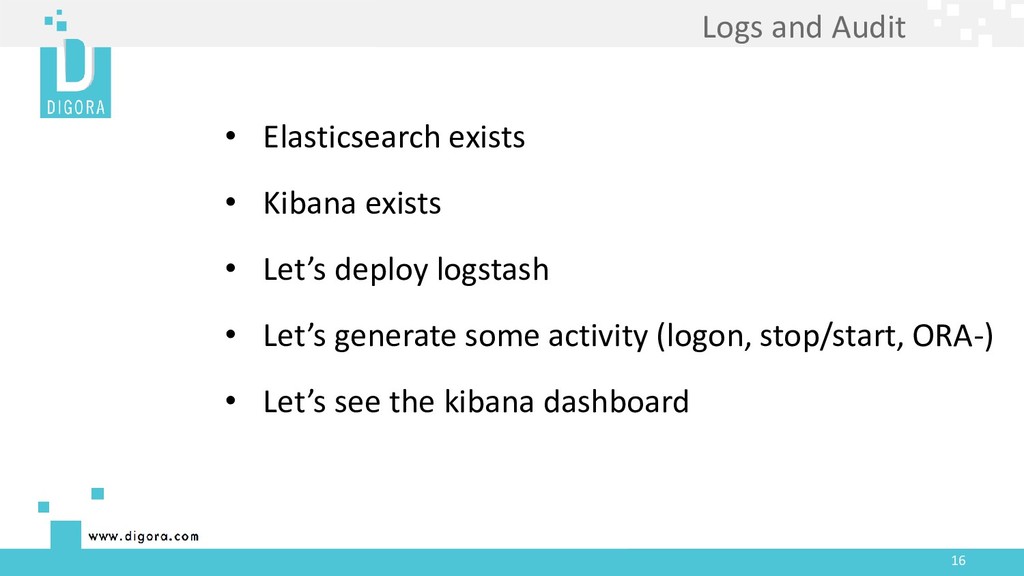
grafana to collect, store and display performance metrics • Logstash, elasticsearch and kibana to collect, store and display logs and audit • Kapacitor for monitoring and alerting
Ansible • Brief overview of Telegraf, Influxdb and grafana • Brief overview of Logstash, elasticsearch and kibana • Brief overview of Kapacitor for monitoring and alerting • Live demo
of Ansible • In depth overview of Telegraf, Influxdb and grafana • In depth overview of Logstash, elasticsearch and kibana • In depth overview of Kapacitor for monitoring and alerting
plugin-driven server agent for collecting and reporting metrics • Telegraf has integrations to source a variety of metrics, events, and logs • InfluxDB is used as a data store for time-stamped data • Kapacitor can process both stream and batch data from InfluxDB. It lets you plug in your own custom logic or user-defined functions to process alerts with dynamic thresholds, match metrics for patterns, compute statistical anomalies, and perform specific actions based on these alerts • Grafana allows you to query, visualize, alert on and understand your metrics
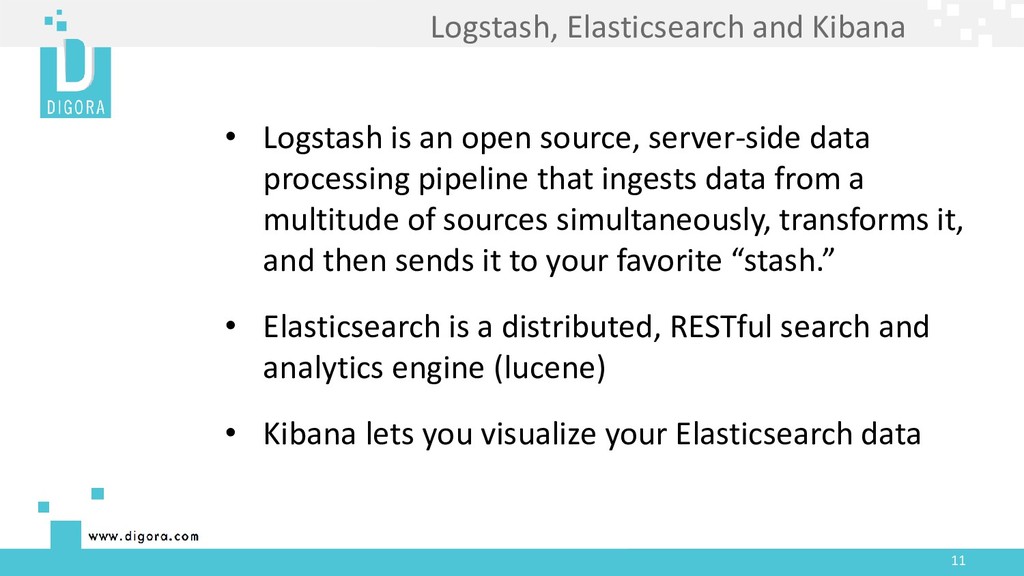
source, server-side data processing pipeline that ingests data from a multitude of sources simultaneously, transforms it, and then sends it to your favorite “stash.” • Elasticsearch is a distributed, RESTful search and analytics engine (lucene) • Kibana lets you visualize your Elasticsearch data


 takanorip
 yut0naga1_fa
 tetsuya28
 akitoshiga
 makocchi
 ishikawa_satoru
 recruitengineers
 hiracky16
 masakiokuda
 pfn
 kenichiodo
 teamlab
 rocio
 schroneko
 marketingsoph
 mclloyd
 dougneiner
 techseoconnect
 apolaine
 davidcarrasco
 tanoku
 lara
 samlambert
 chriscoyier