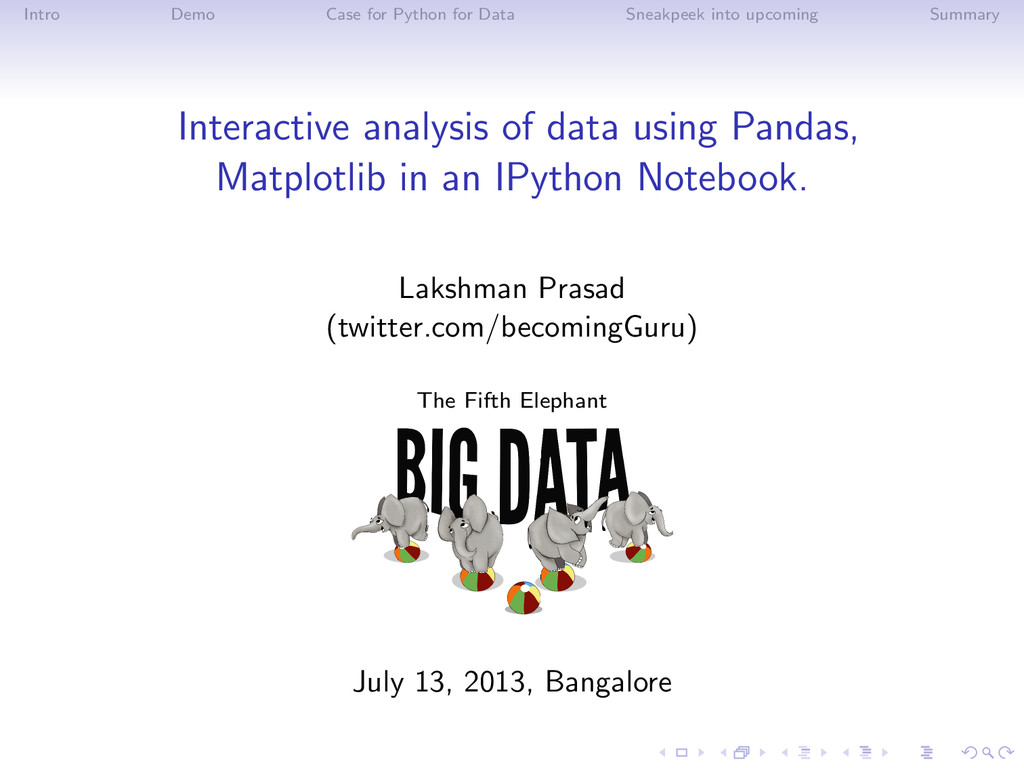
Summary Interactive analysis of data using Pandas, Matplotlib in an IPython Notebook. Lakshman Prasad (twitter.com/becomingGuru) The Fifth Elephant July 13, 2013, Bangalore
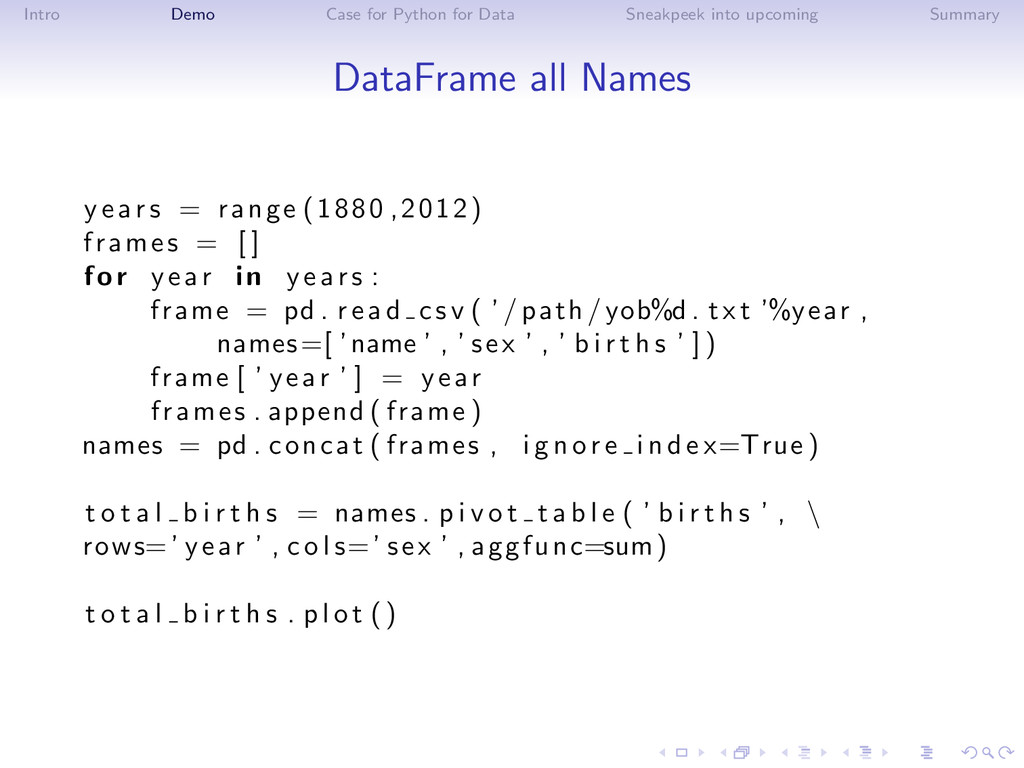
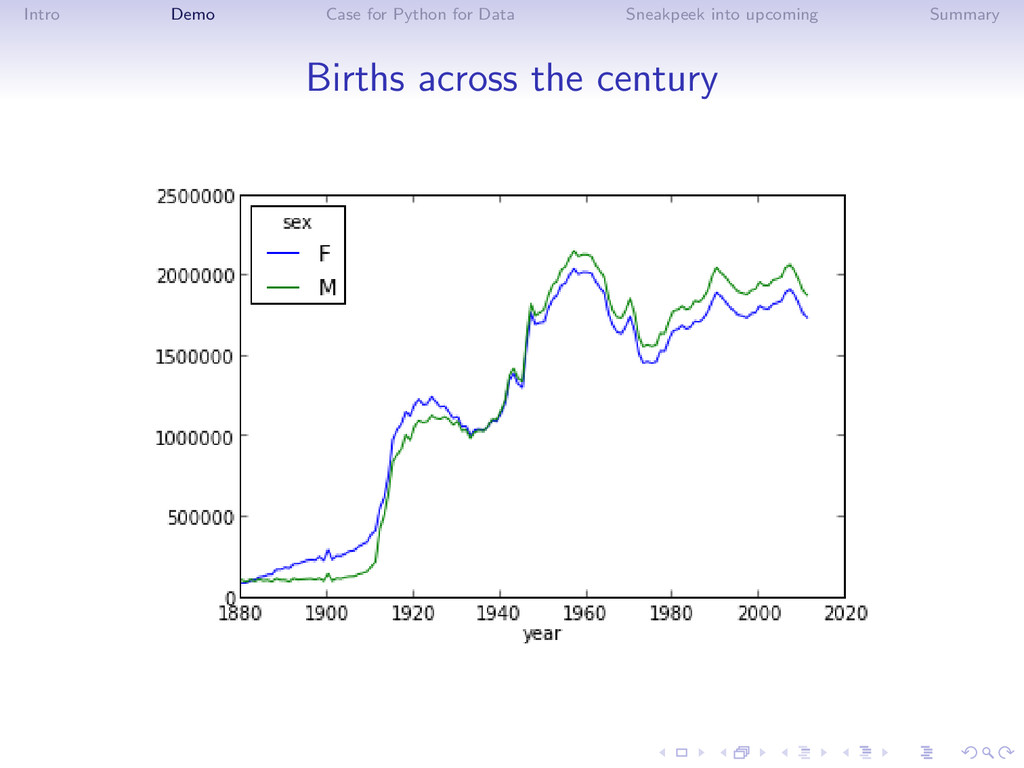
Summary DataFrame all Names years = range (1880 ,2012) frames = [ ] for year in years : frame = pd . r e a d c s v ( ’ / path /yob%d . t x t ’%year , names=[ ’name ’ , ’ sex ’ , ’ b i r t h s ’ ] ) frame [ ’ year ’ ] = year frames . append ( frame ) names = pd . concat ( frames , i g n o r e i n d e x=True ) t o t a l b i r t h s = names . p i v o t t a b l e ( ’ b i r t h s ’ , \ rows=’ year ’ , c o l s=’ sex ’ , aggfunc=sum) t o t a l b i r t h s . p l o t ()
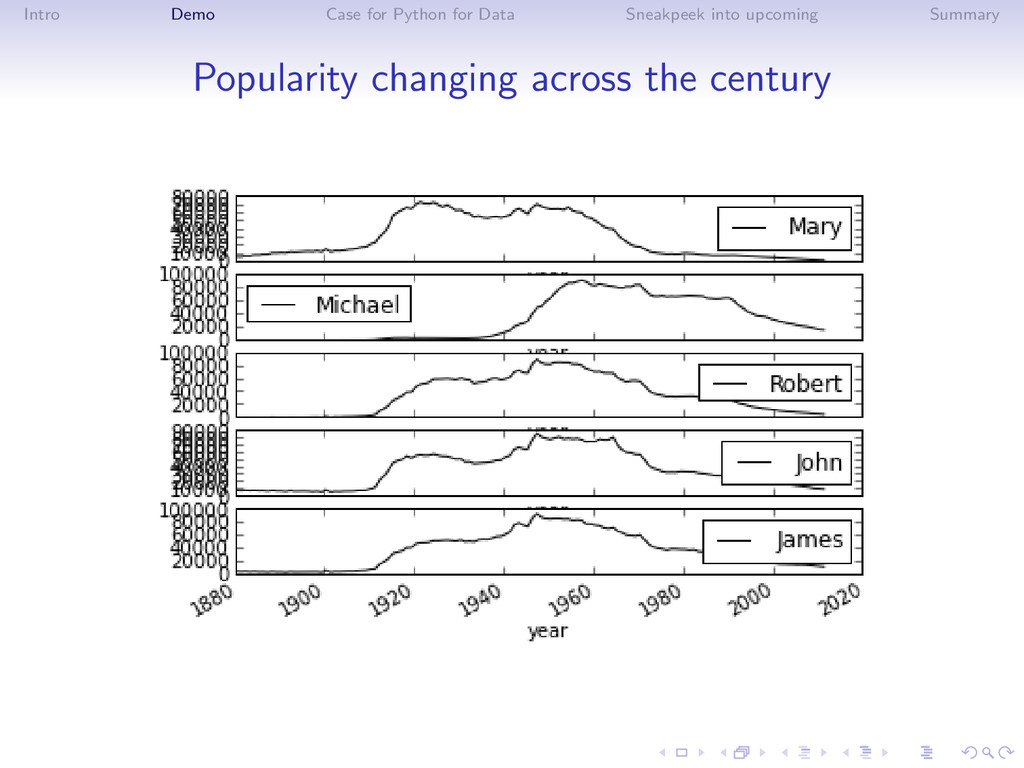
Summary Plot popularity names p = names . p i v o t t a b l e ( ’ b i r t h s ’ , rows=’name ’ , aggfunc=sum) top names = names p . order ()[ −5:] names by year = names . p i v o t t a b l e ( ’ b i r t h s ’ , rows=’ year ’ , c o l s=’name ’ , aggfunc=sum) names by year [ top names ] . p l o t ( s u b p l o t s=True )
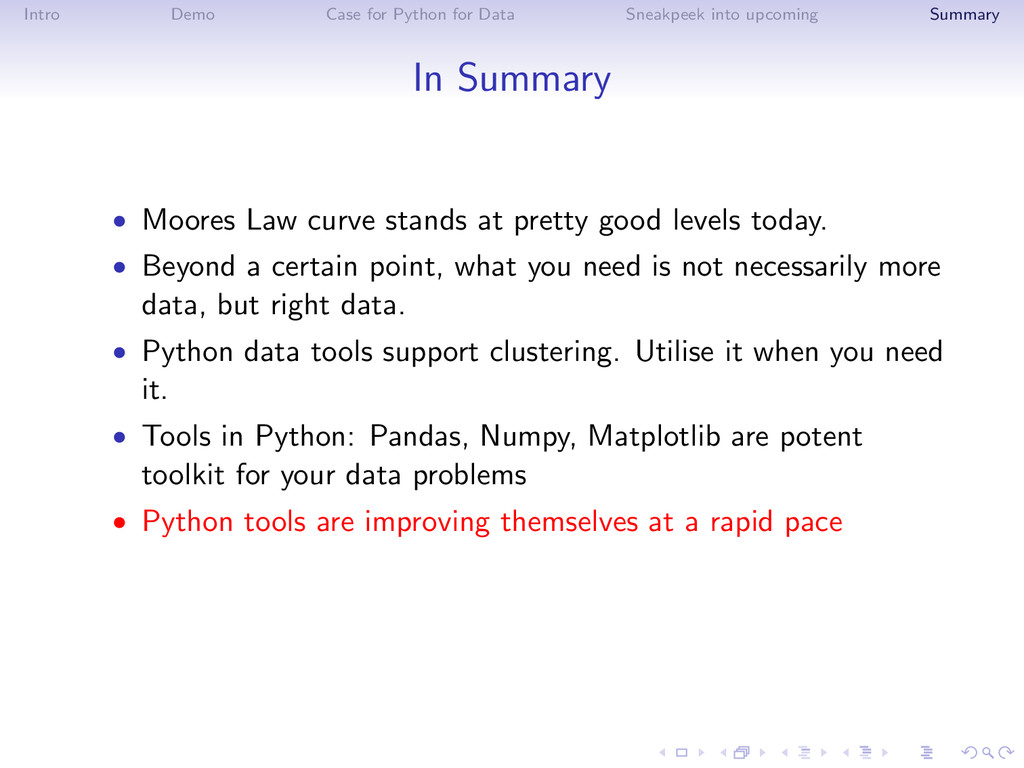
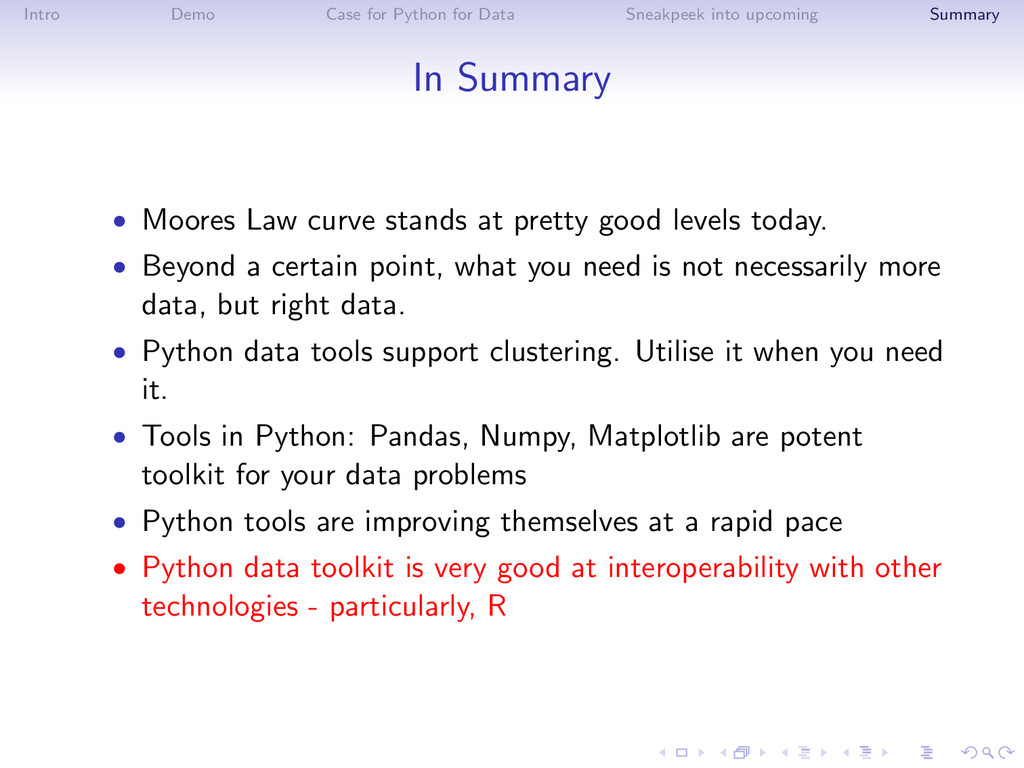
Summary In Summary • Moores Law curve stands at pretty good levels today. • Beyond a certain point, what you need is not necessarily more data, but right data.
Summary In Summary • Moores Law curve stands at pretty good levels today. • Beyond a certain point, what you need is not necessarily more data, but right data. • Python data tools support clustering. Utilise it when you need it.
Summary In Summary • Moores Law curve stands at pretty good levels today. • Beyond a certain point, what you need is not necessarily more data, but right data. • Python data tools support clustering. Utilise it when you need it. • Tools in Python: Pandas, Numpy, Matplotlib are potent toolkit for your data problems
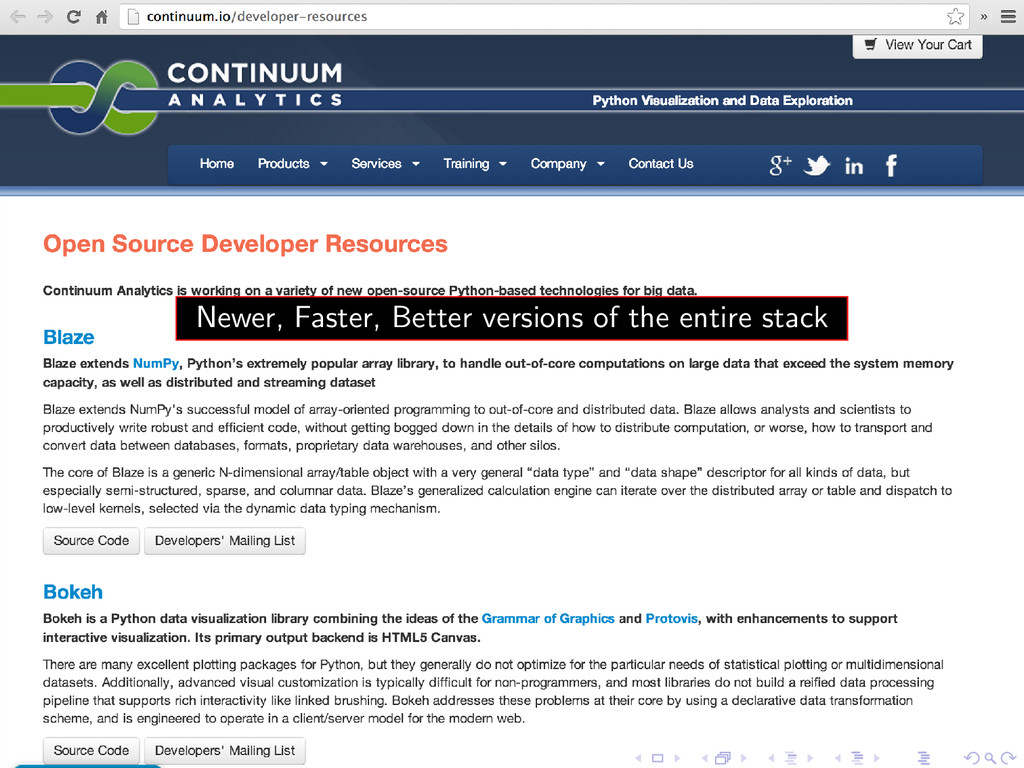
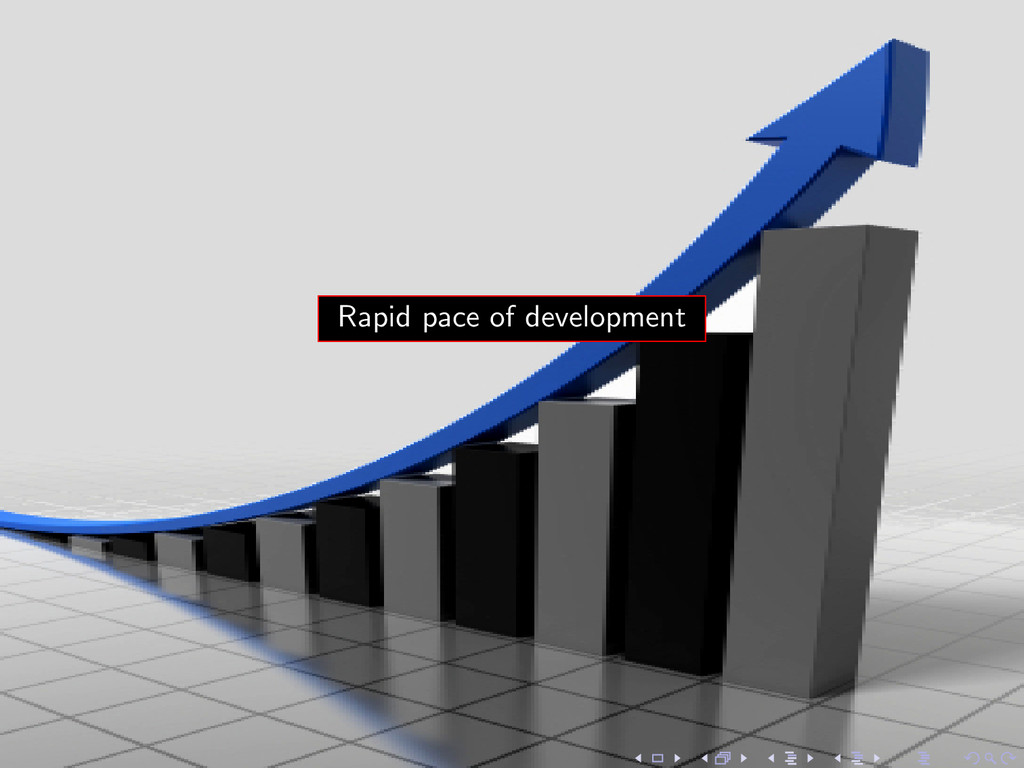
Summary In Summary • Moores Law curve stands at pretty good levels today. • Beyond a certain point, what you need is not necessarily more data, but right data. • Python data tools support clustering. Utilise it when you need it. • Tools in Python: Pandas, Numpy, Matplotlib are potent toolkit for your data problems • Python tools are improving themselves at a rapid pace
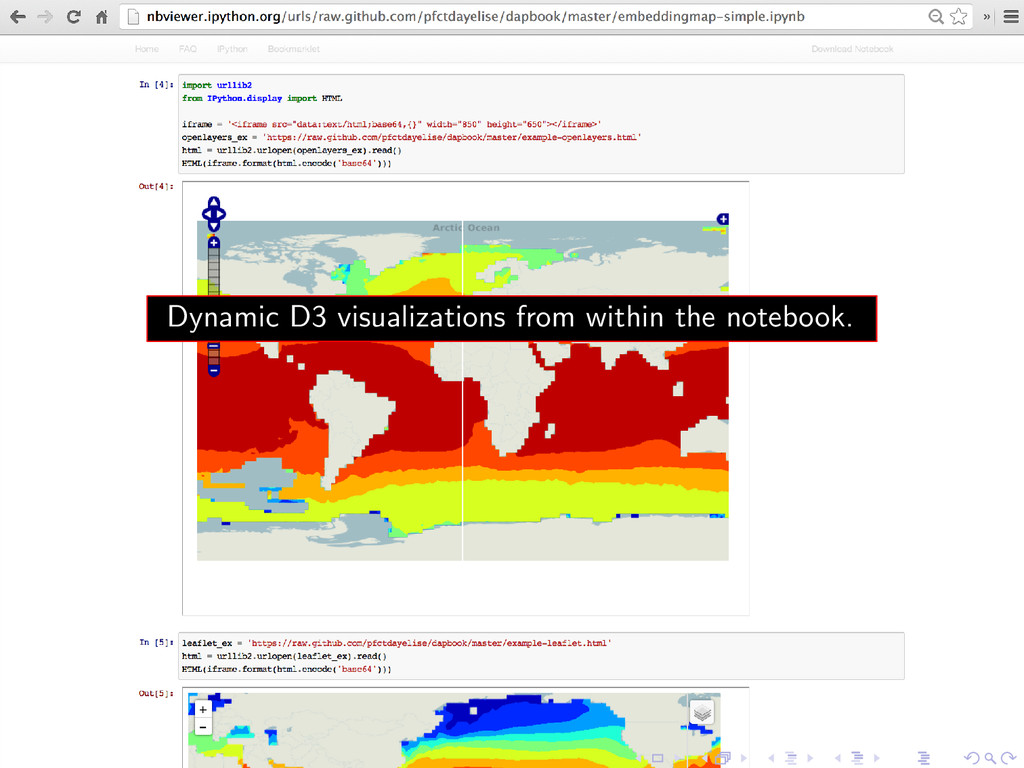
Summary In Summary • Moores Law curve stands at pretty good levels today. • Beyond a certain point, what you need is not necessarily more data, but right data. • Python data tools support clustering. Utilise it when you need it. • Tools in Python: Pandas, Numpy, Matplotlib are potent toolkit for your data problems • Python tools are improving themselves at a rapid pace • Python data toolkit is very good at interoperability with other technologies - particularly, R
Summary Image Attributions http ://www. f l i c k r . com/ photos / h i n k e l s t o n e /2765597758 http ://www. f l i c k r . com/ photos /25521149@N03/2491915744 http ://www. f l i c k r . com/ photos /50764322@N04/8378057370 http ://www. f l i c k r . com/ photos /micahdowty /3866958782 http ://www. f l i c k r . com/ photos /81512202@N05/7468442446 http ://www. f l i c k r . com/ photos / marlenek /2051394370 http ://www. f l i c k r . com/ photos / t e j e d o r o d e l u z /3157690060/ http ://www. f l i c k r . com/ photos /23820645@N05/4287681570/ http ://www. f l i c k r . com/ photos / a i d a n j o n e s /3575000735/ http ://www. f l i c k r . com/ photos /go /253819/ http ://www. f l i c k r . com/ photos / o r i n r o b e r t j o h n /114430223/
![[email protected]](https://files.speakerdeck.com/presentations/7bae8990cce0013059600aa8ee42777e/slide_40.jpg)