about treating your infrastructure the same way you treat your applications. ! This is also a story about how we use New Relic, at New Relic. http://nicbenders.com/presentations/puppetconf-2014
but this will work with Puppet Open Source, or with newer versions. You’ll just need to make a few changes here and there. • If you don’t have a New Relic account, you can sign-up for a free “Lite” account. • All of the examples are up in a more useful format at the URL below. (The URL will also be shown at the end of the presentation.) http://nicbenders.com/presentations/puppetconf-2014
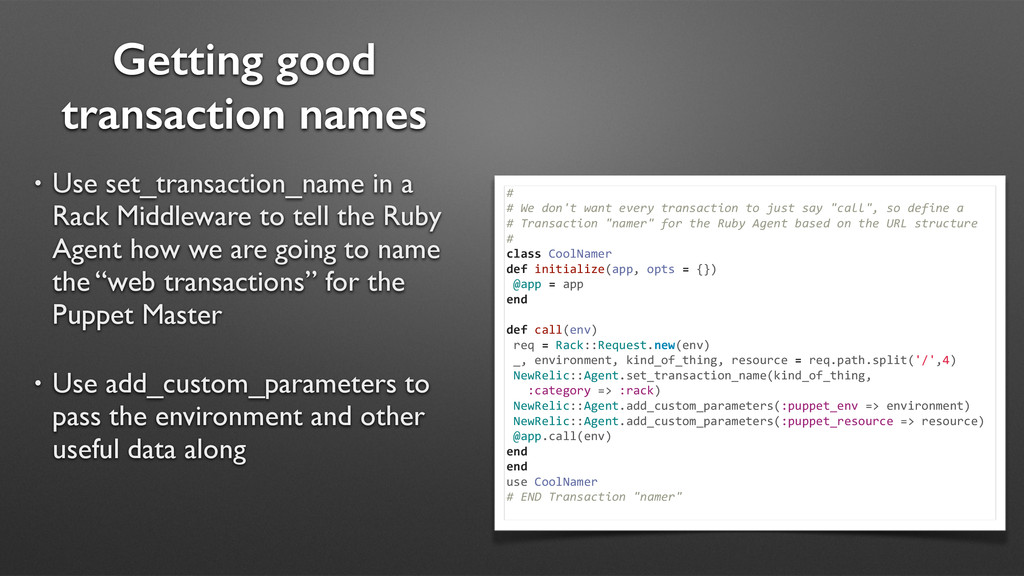
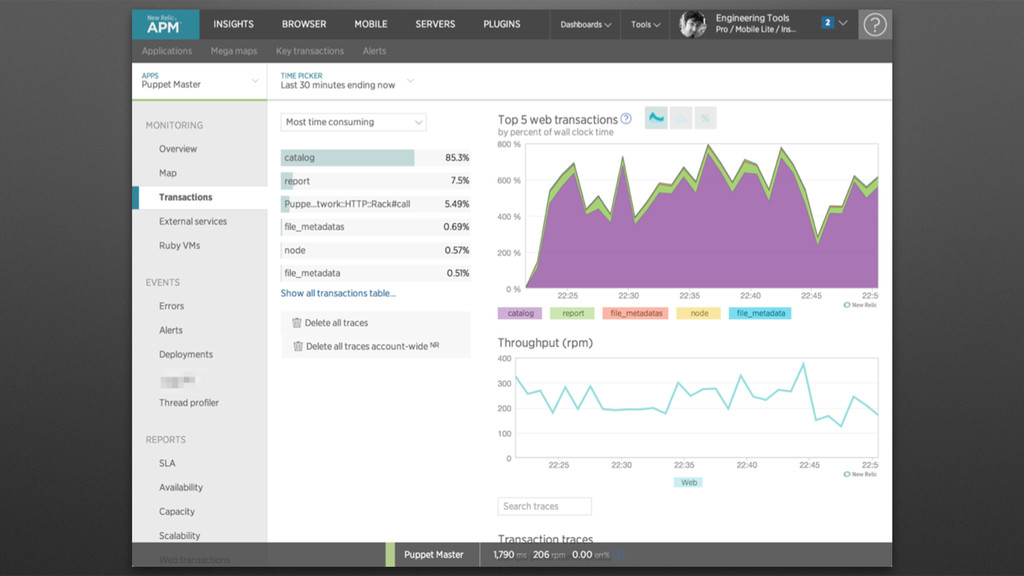
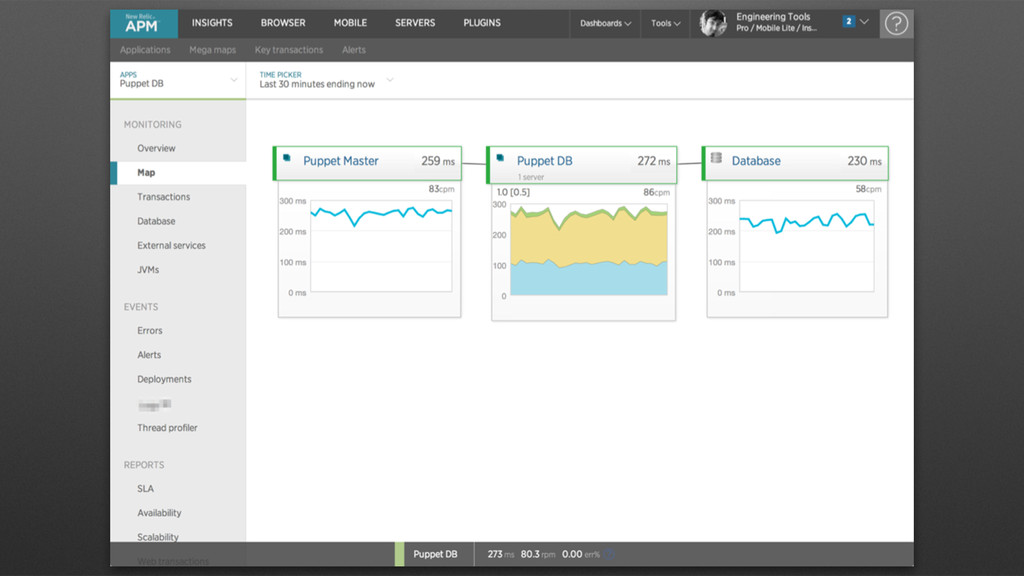
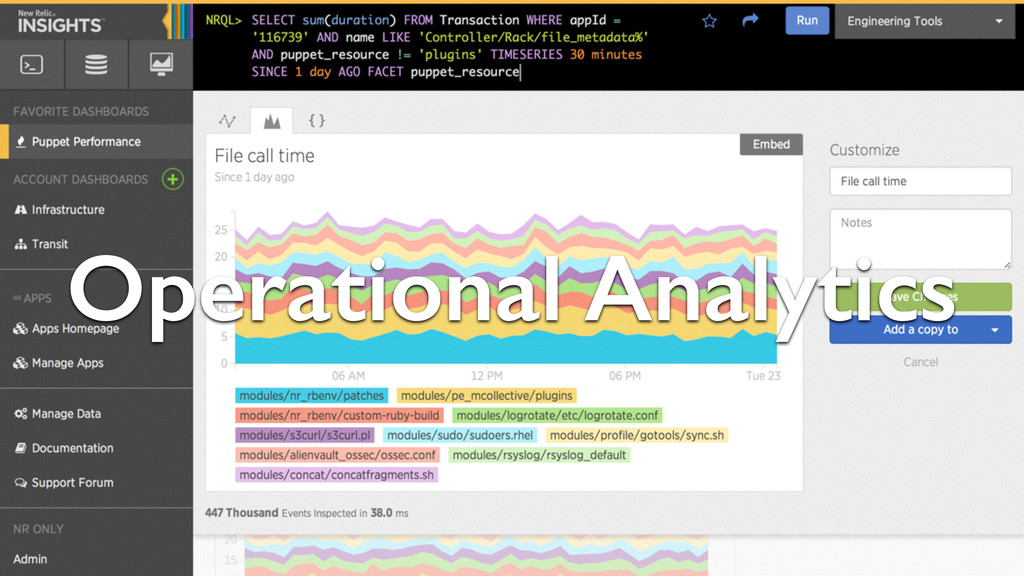
Middleware to tell the Ruby Agent how we are going to name the “web transactions” for the Puppet Master • Use add_custom_parameters to pass the environment and other useful data along # # We don't want every transaction to just say "call", so define a # Transaction "namer" for the Ruby Agent based on the URL structure # class CoolNamer def initialize(app, opts = {}) @app = app end def call(env) req = Rack::Request.new(env) _, environment, kind_of_thing, resource = req.path.split('/',4) NewRelic::Agent.set_transaction_name(kind_of_thing, :category => :rack) NewRelic::Agent.add_custom_parameters(:puppet_env => environment) NewRelic::Agent.add_custom_parameters(:puppet_resource => resource) @app.call(env) end end use CoolNamer # END Transaction "namer"
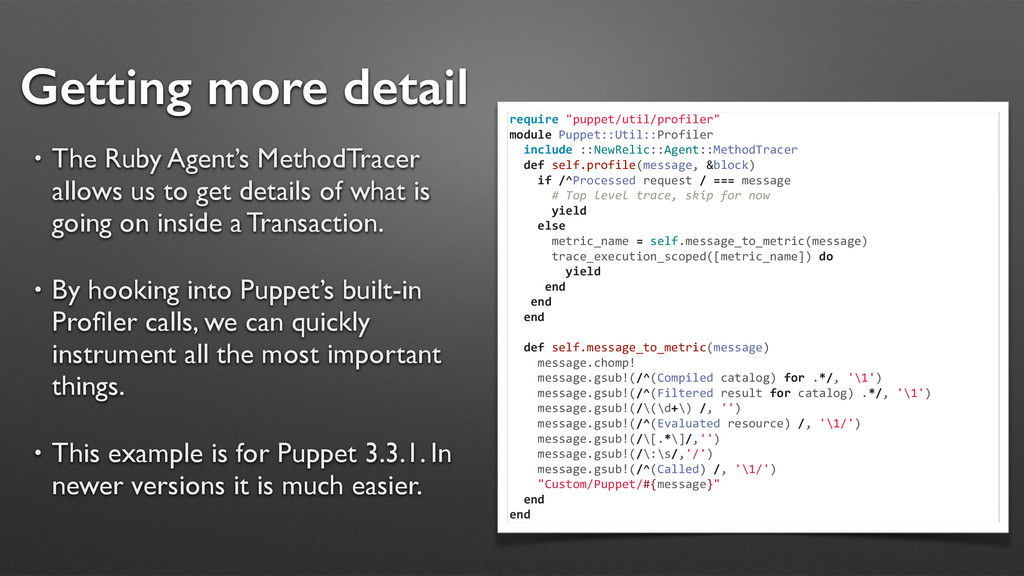
to get details of what is going on inside a Transaction. • By hooking into Puppet’s built-in Profiler calls, we can quickly instrument all the most important things. • This example is for Puppet 3.3.1. In newer versions it is much easier. require "puppet/util/profiler" module Puppet::Util::Profiler include ::NewRelic::Agent::MethodTracer def self.profile(message, &block) if /^Processed request / === message # Top level trace, skip for now yield else metric_name = self.message_to_metric(message) trace_execution_scoped([metric_name]) do yield end end end def self.message_to_metric(message) message.chomp! message.gsub!(/^(Compiled catalog) for .*/, '\1') message.gsub!(/^(Filtered result for catalog) .*/, '\1') message.gsub!(/\(\d+\) /, '') message.gsub!(/^(Evaluated resource) /, '\1/') message.gsub!(/\[.*\]/,'') message.gsub!(/\:\s/,'/') message.gsub!(/^(Called) /, '\1/') "Custom/Puppet/#{message}" end end
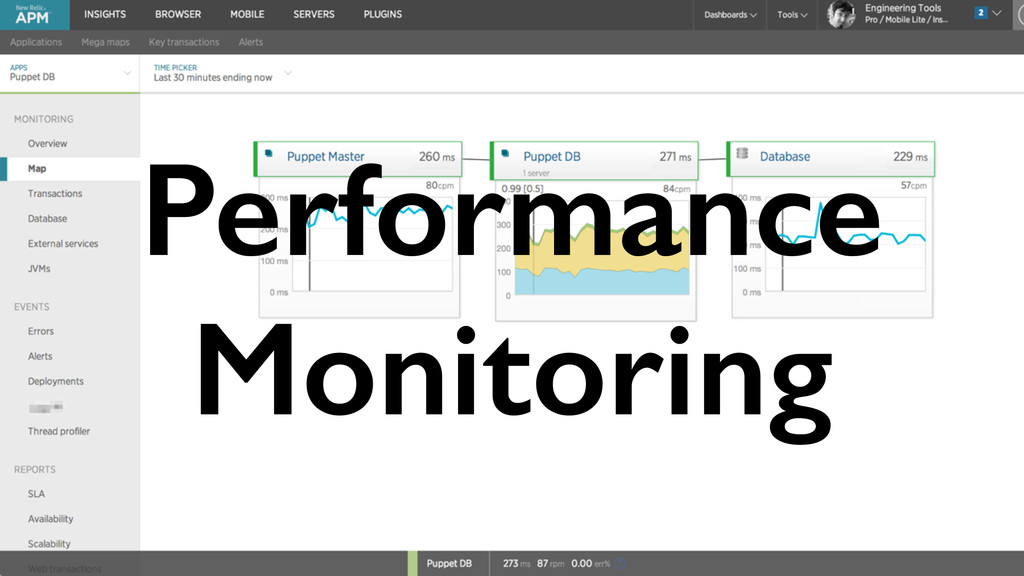
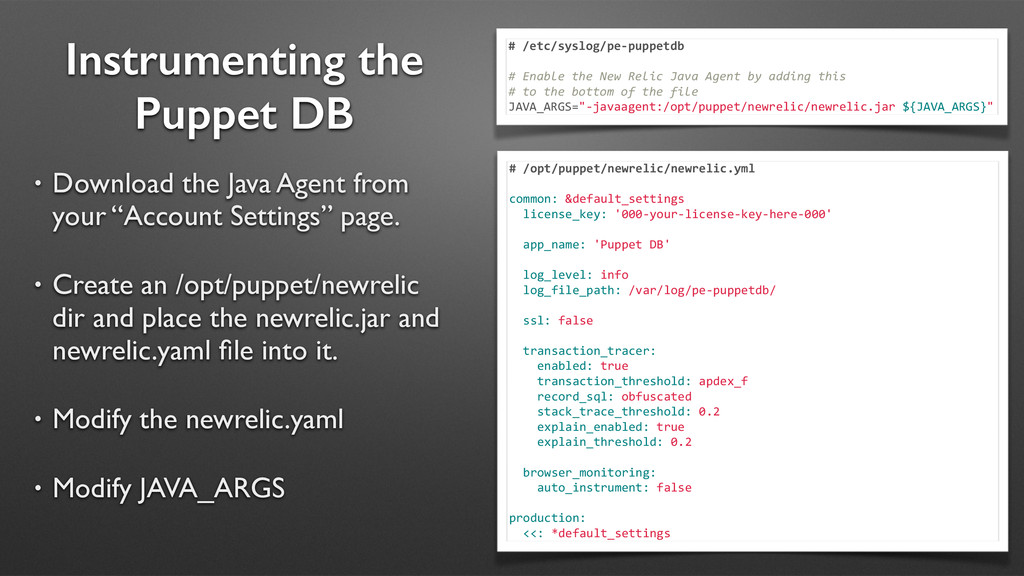
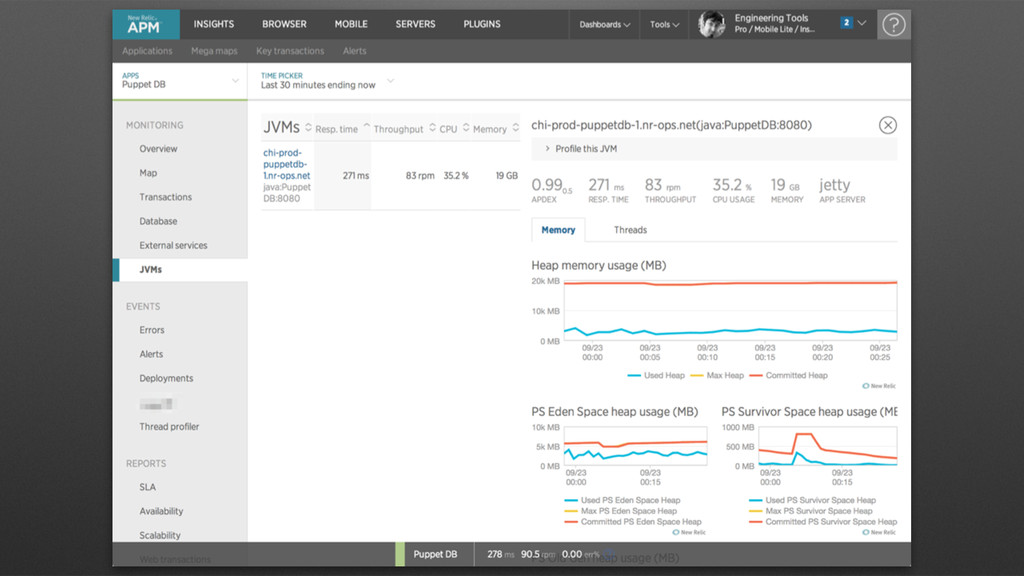
your “Account Settings” page. • Create an /opt/puppet/newrelic dir and place the newrelic.jar and newrelic.yaml file into it. • Modify the newrelic.yaml • Modify JAVA_ARGS # /opt/puppet/newrelic/newrelic.yml ! common: &default_settings license_key: '000-‐your-‐license-‐key-‐here-‐000' ! app_name: 'Puppet DB' log_level: info log_file_path: /var/log/pe-‐puppetdb/ ssl: false transaction_tracer: enabled: true transaction_threshold: apdex_f record_sql: obfuscated stack_trace_threshold: 0.2 explain_enabled: true explain_threshold: 0.2 browser_monitoring: auto_instrument: false production: <<: *default_settings # /etc/syslog/pe-‐puppetdb ! # Enable the New Relic Java Agent by adding this # to the bottom of the file JAVA_ARGS="-‐javaagent:/opt/puppet/newrelic/newrelic.jar ${JAVA_ARGS}"
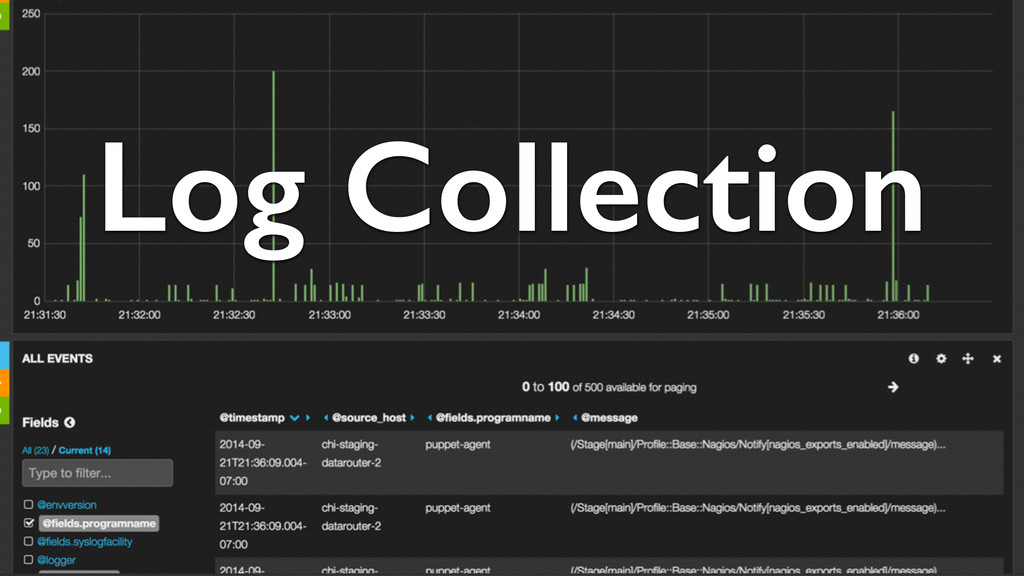
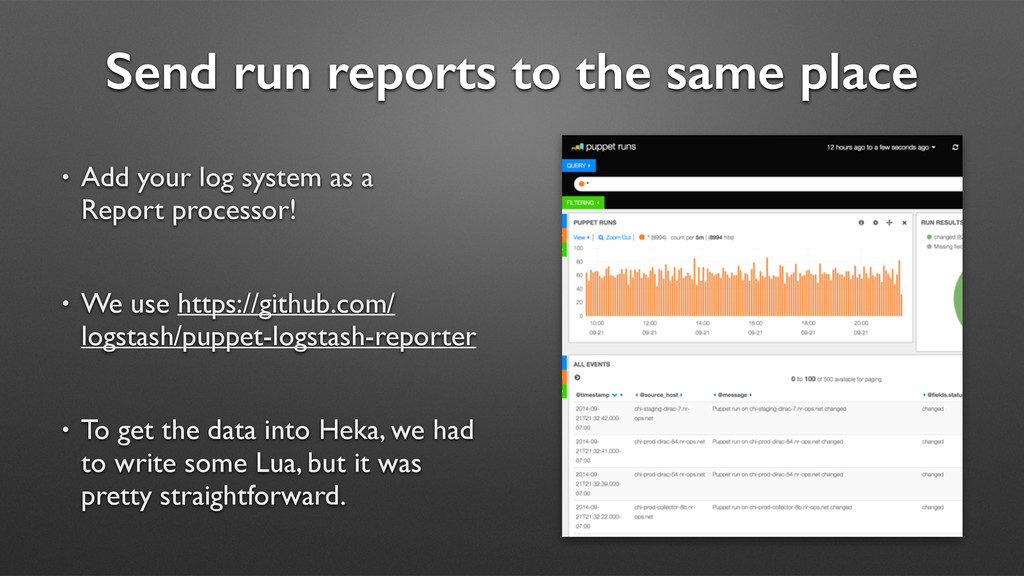
a ton of useful information. We just need to get it to a useful place. • Our application and syslog data is collected by a Heka process on each server. It then makes its way to ElasticSearch, where it can be queried by Kibana.
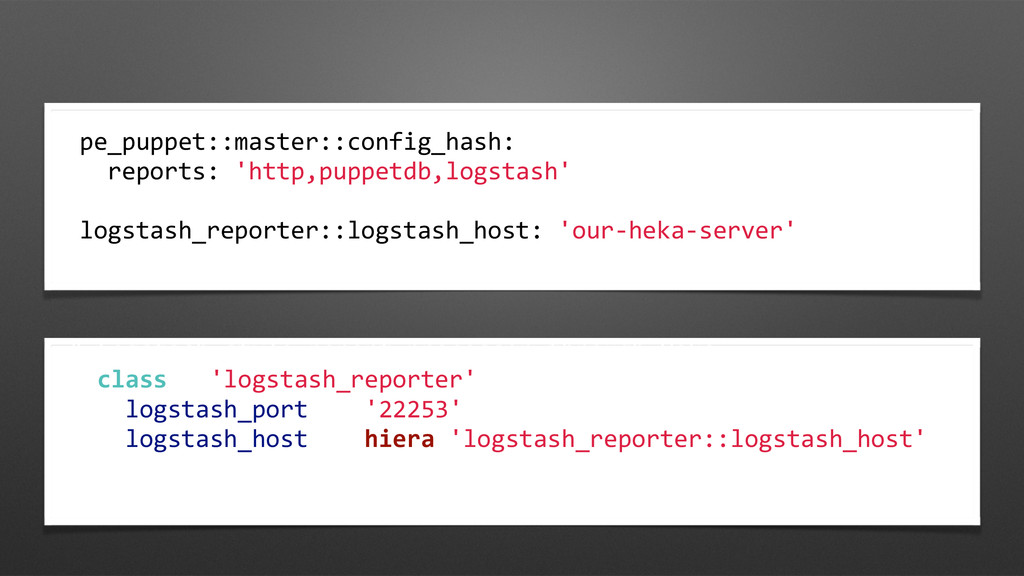
log system as a Report processor! • We use https://github.com/ logstash/puppet-logstash-reporter • To get the data into Heka, we had to write some Lua, but it was pretty straightforward.
![http://nicbenders.com/presentations/puppetconf-2014 [email protected]](https://files.speakerdeck.com/presentations/5f936390252b013253d042352f2c78ce/slide_27.jpg)