determine whether values in a series are within expected parameters. Potential use cases include: • monitoring blood pressure • evaluating mean time between failures for hardware products • comparing month-over-month expenses for product costs
in the sequence, consider the following recommendations. • Sampling occurs every few minutes and has less than 10% of the expected number of points missing. In this case, the impact should be negligible on the detection results. • If you have more than 10% missing, there are options to help "fill" the data set. Consider using a linear interpolation method to fill in the missing values and complete the data set. This will fill gaps with evenly distributed values.
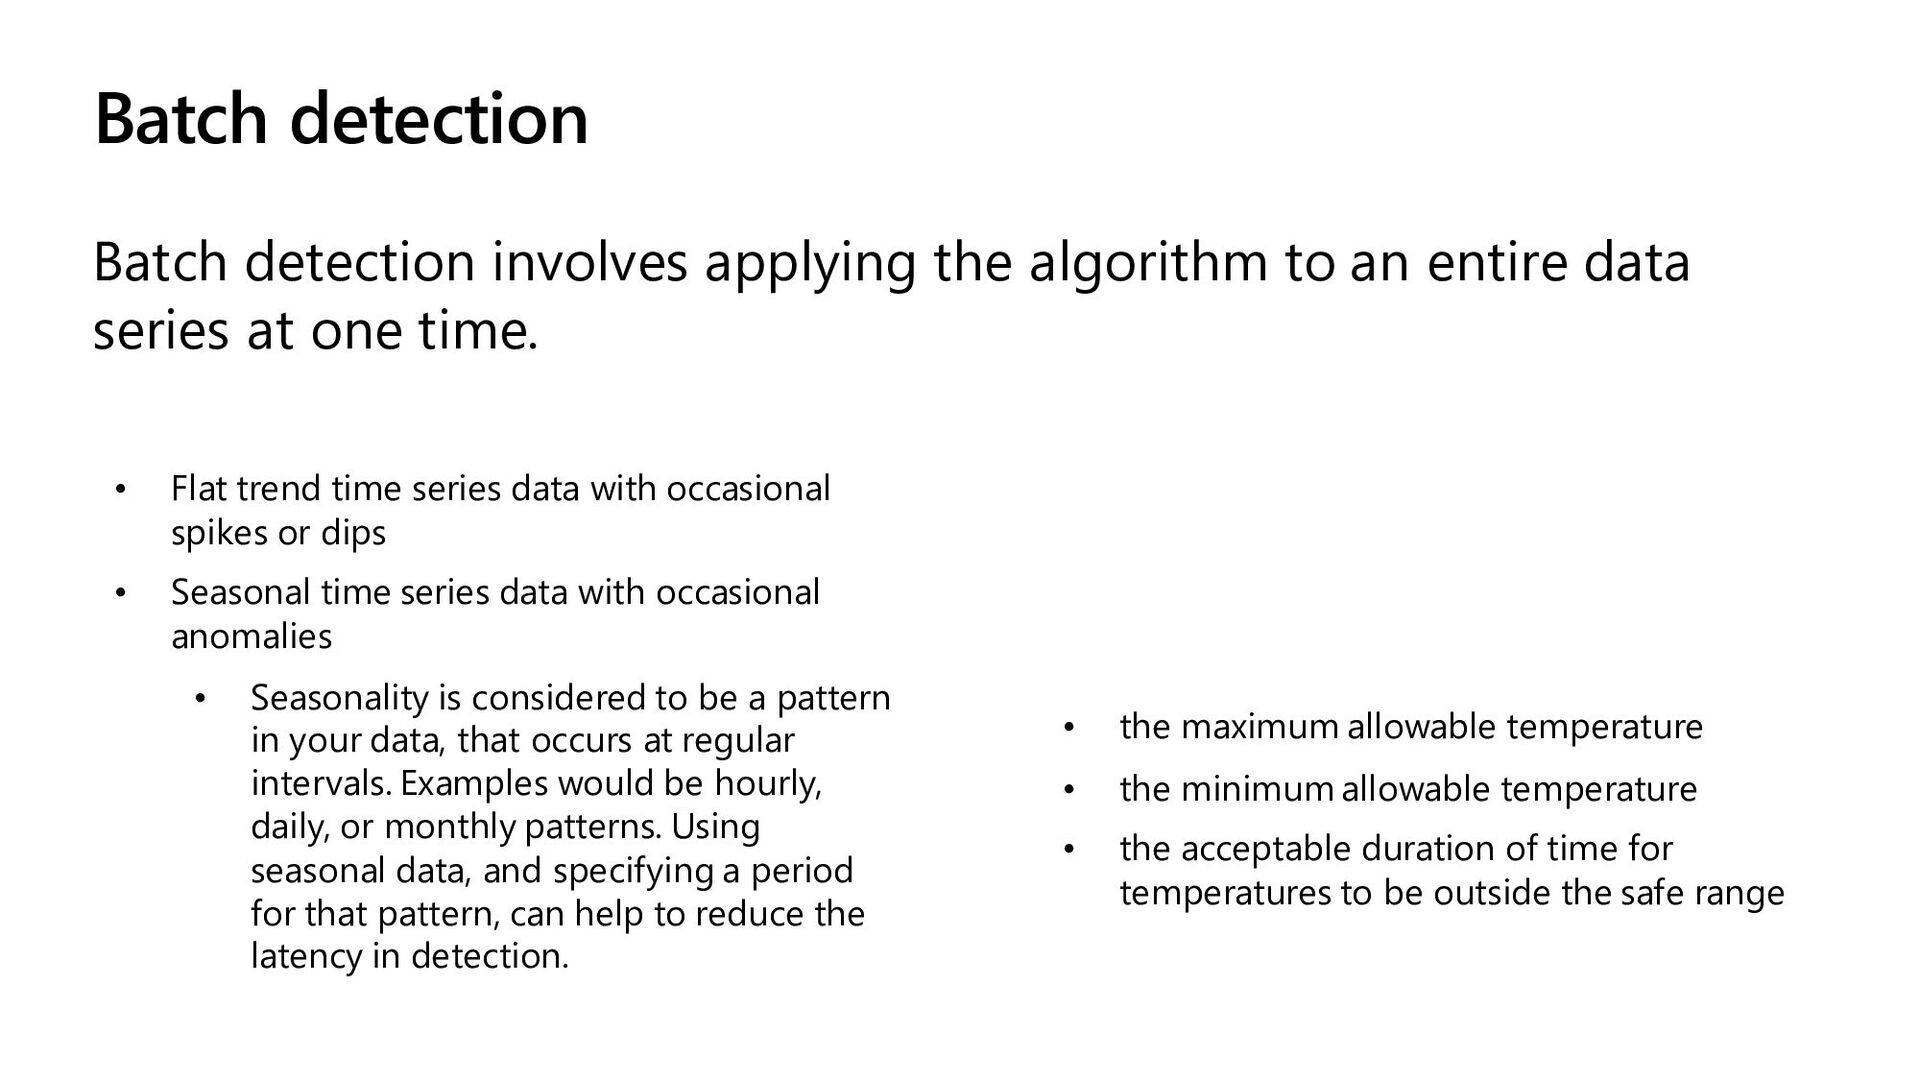
entire data series at one time. • Flat trend time series data with occasional spikes or dips • Seasonal time series data with occasional anomalies • Seasonality is considered to be a pattern in your data, that occurs at regular intervals. Examples would be hourly, daily, or monthly patterns. Using seasonal data, and specifying a period for that pattern, can help to reduce the latency in detection. • the maximum allowable temperature • the minimum allowable temperature • the acceptable duration of time for temperatures to be outside the safe range
we'll use a simple command-line application that runs in the Cloud Shell. • Create an Anomaly Detector resource • Run Cloud Shell • Configure and run a client application • Learn more
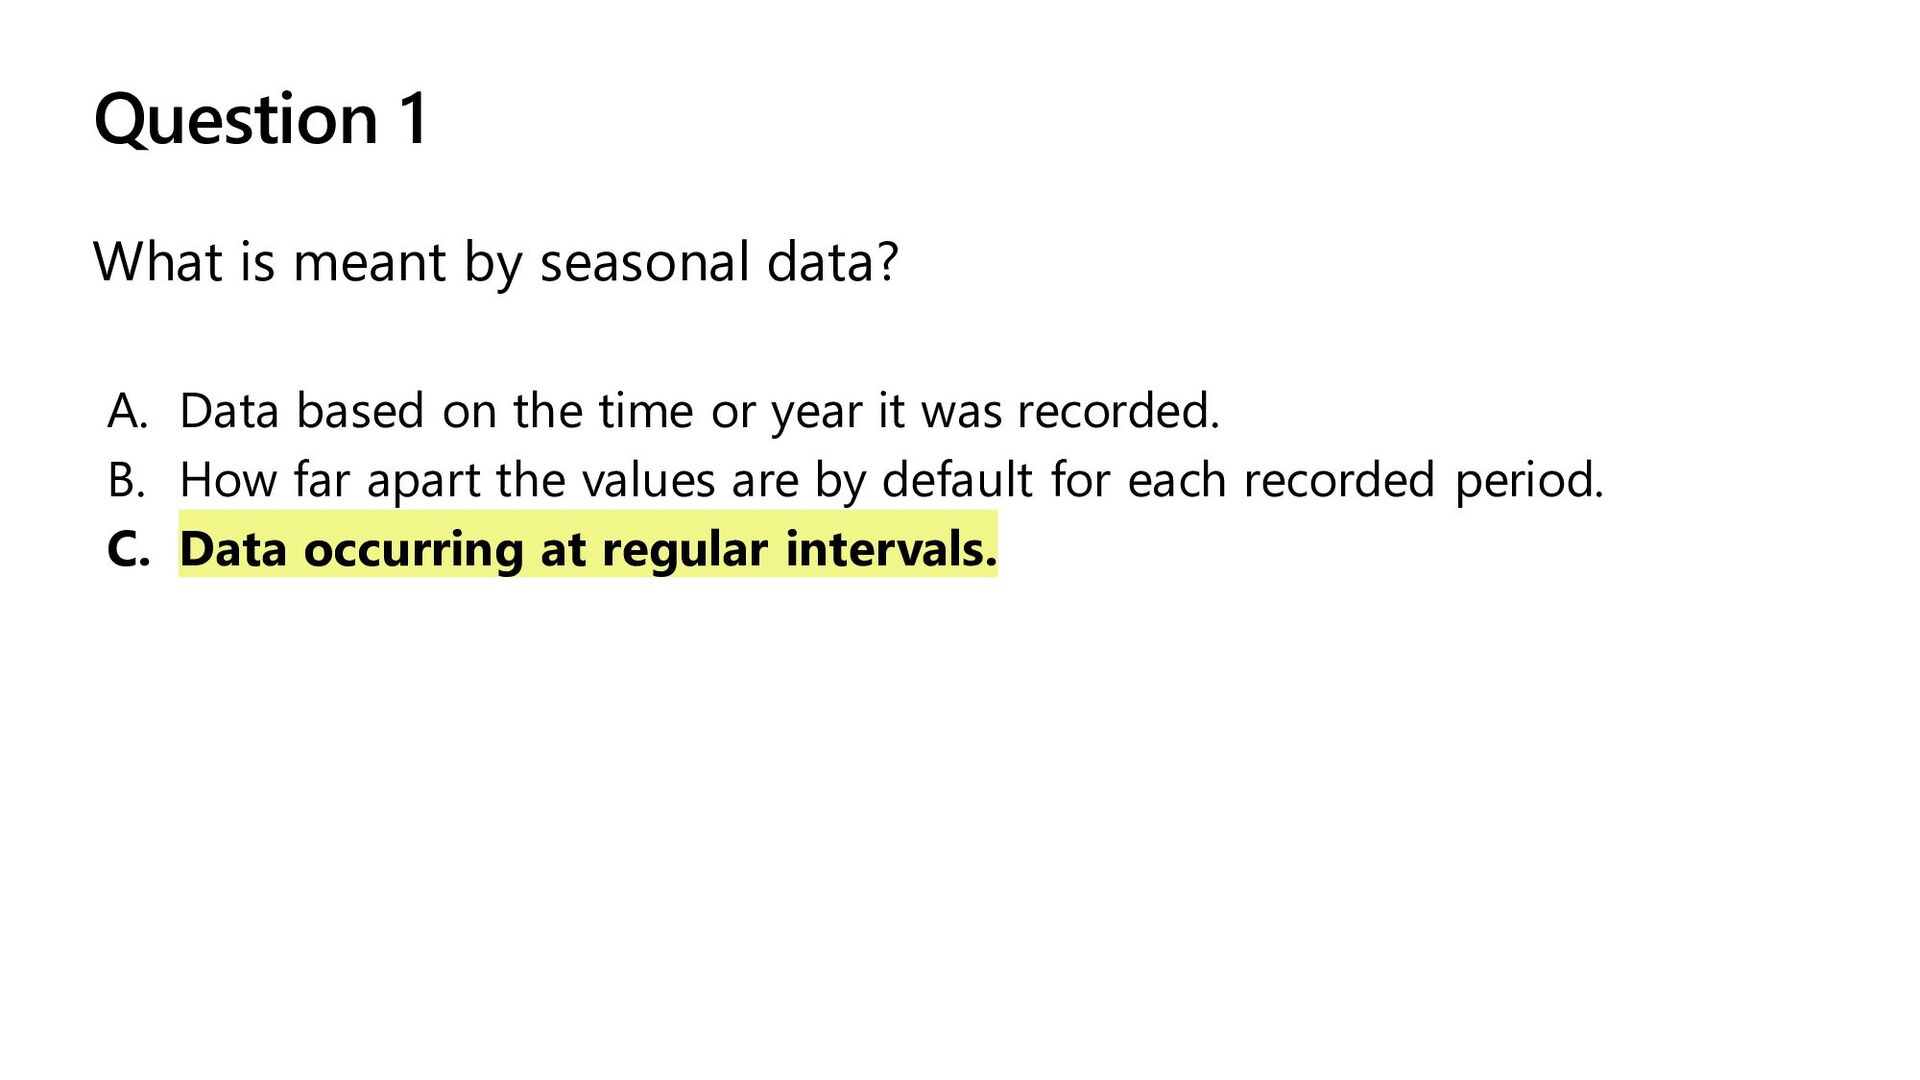
based on the time or year it was recorded. B. How far apart the values are by default for each recorded period. C. Data occurring at regular intervals.
based on the time or year it was recorded. B. How far apart the values are by default for each recorded period. C. Data occurring at regular intervals.
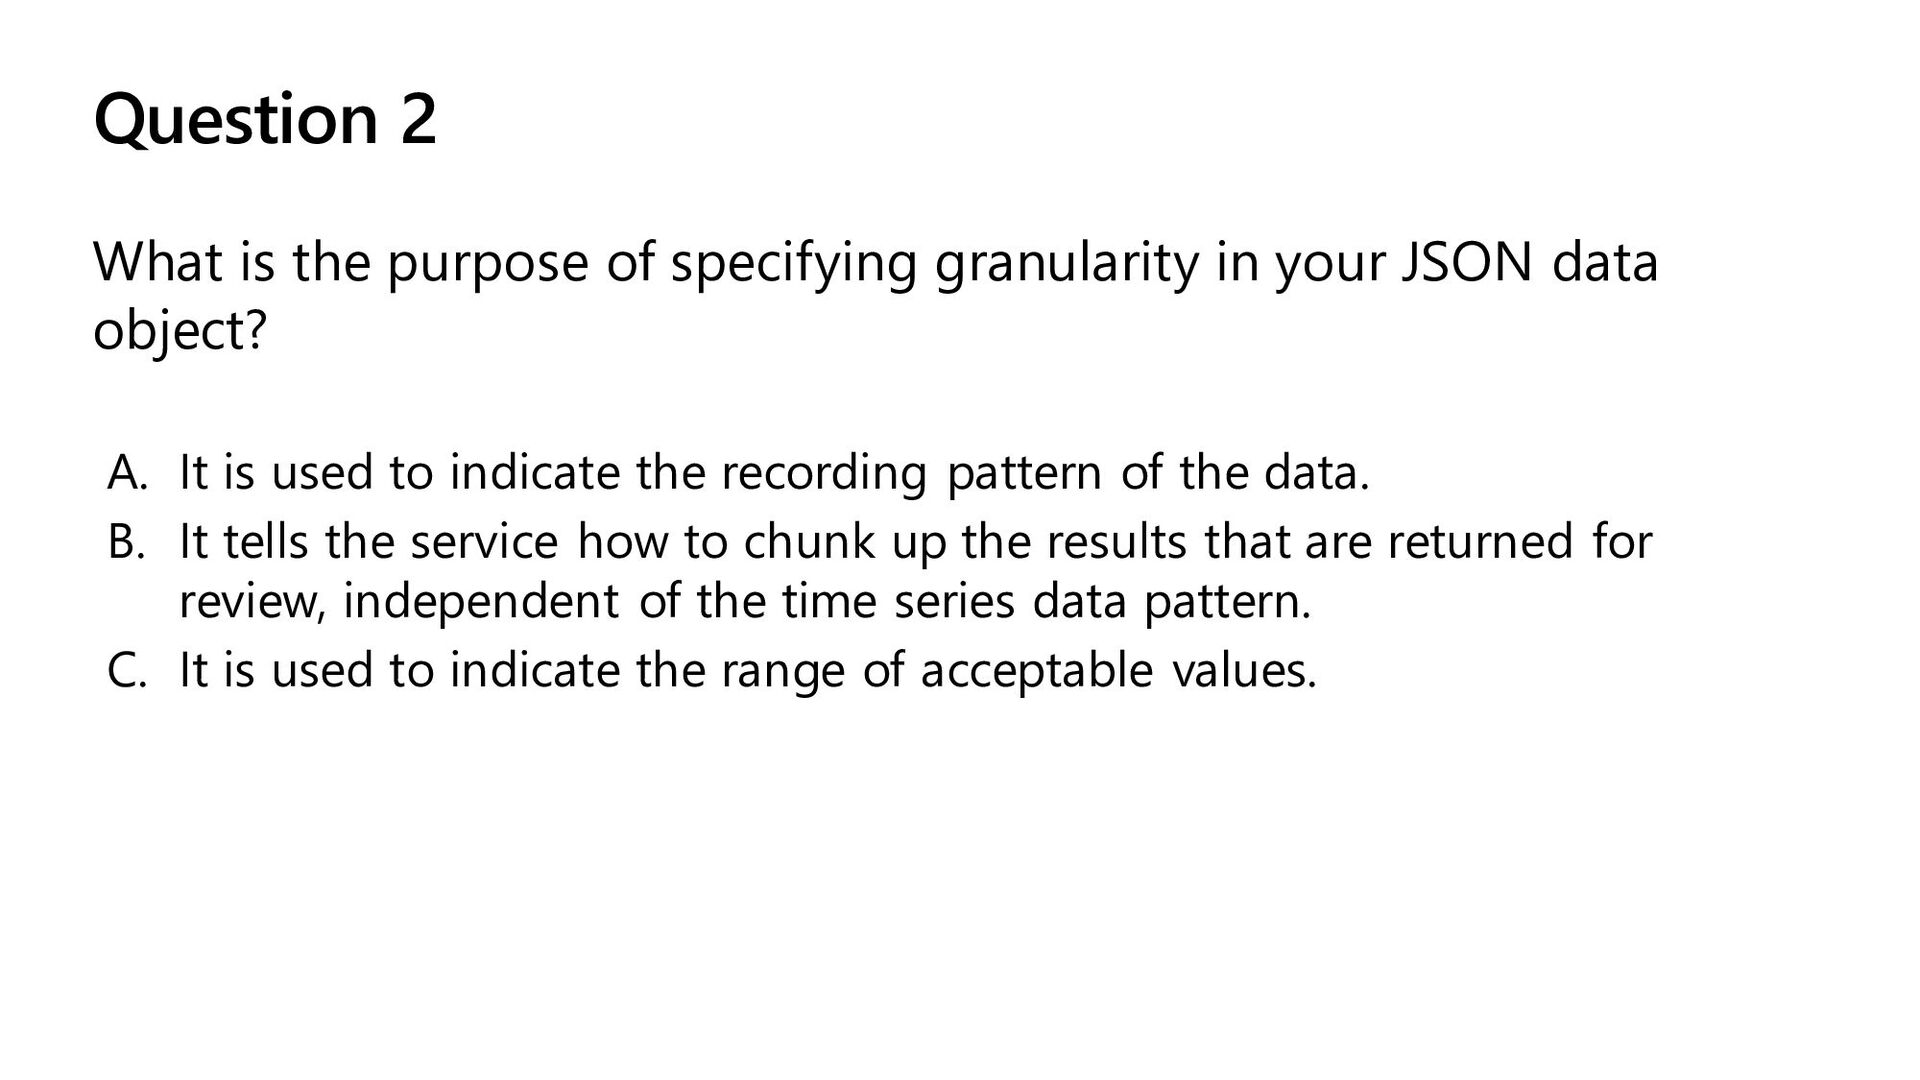
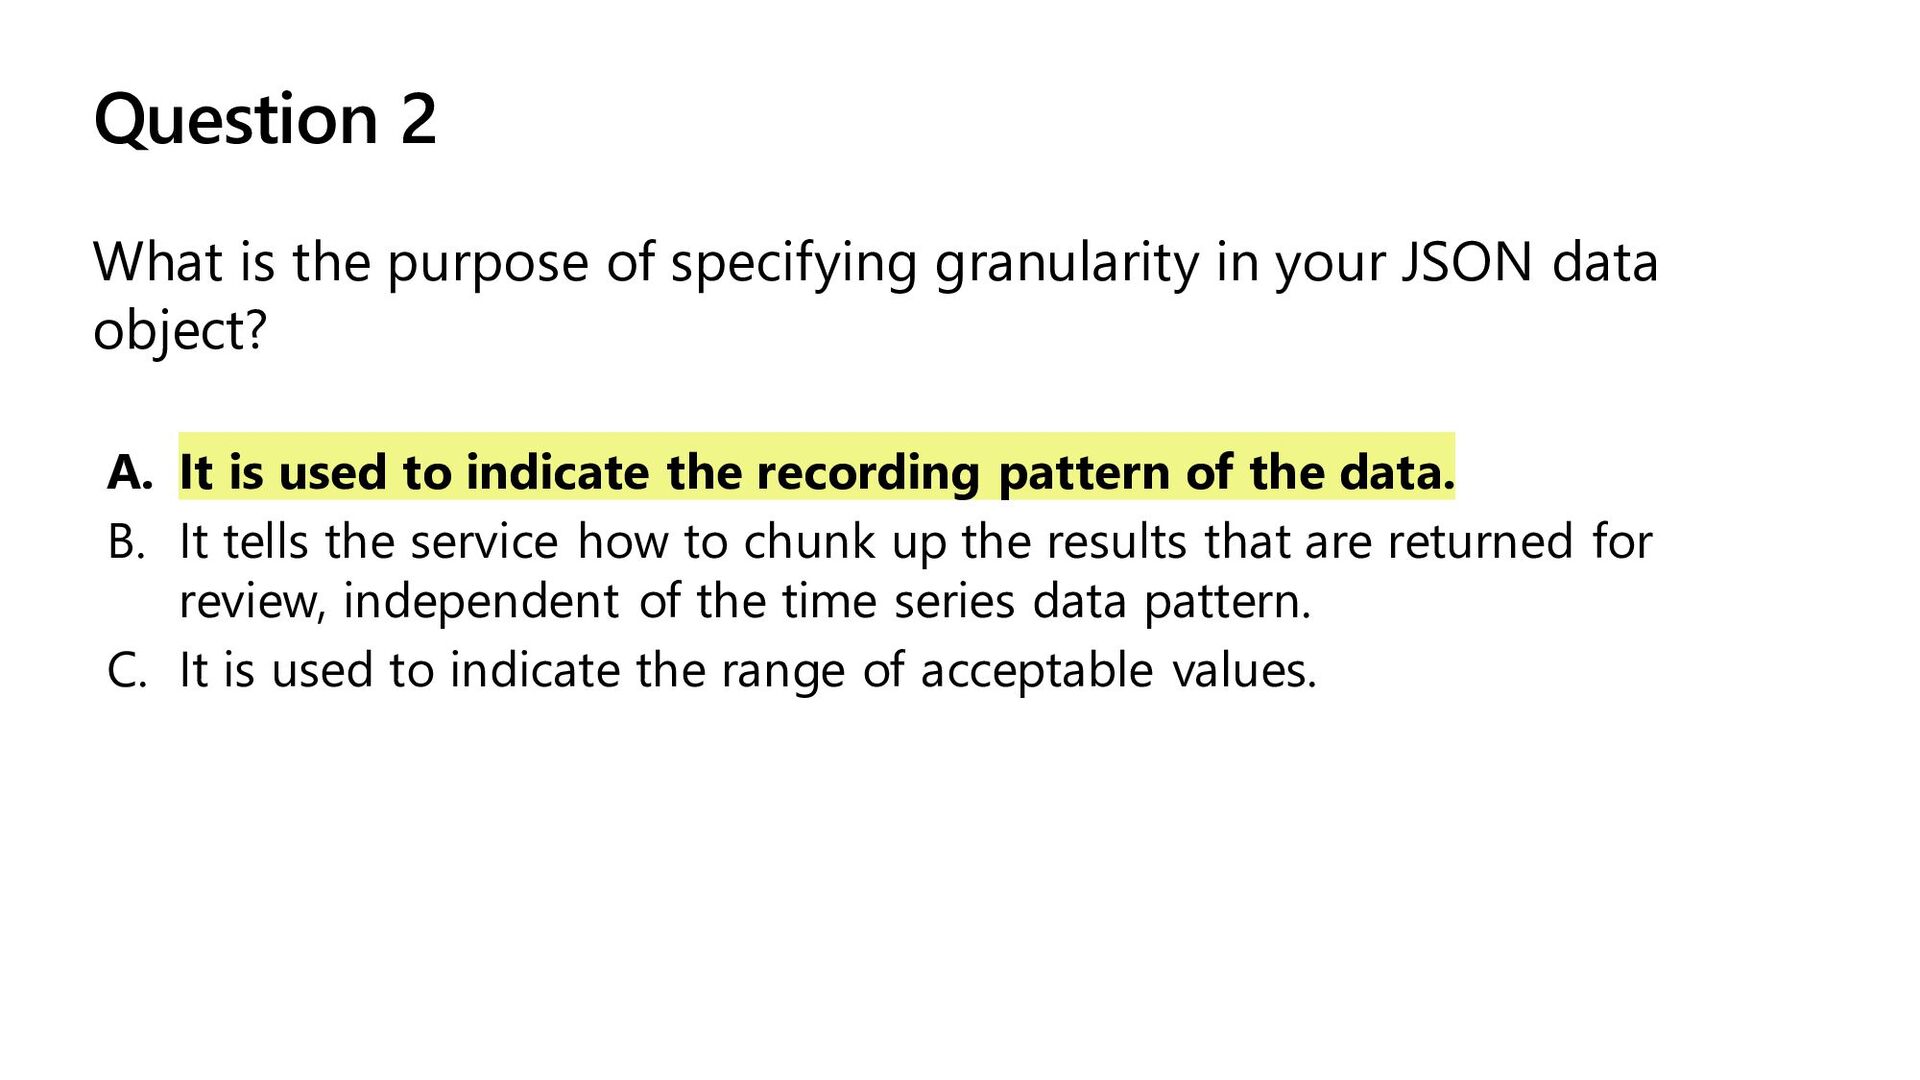
your JSON data object? A. It is used to indicate the recording pattern of the data. B. It tells the service how to chunk up the results that are returned for review, independent of the time series data pattern. C. It is used to indicate the range of acceptable values.
your JSON data object? A. It is used to indicate the recording pattern of the data. B. It tells the service how to chunk up the results that are returned for review, independent of the time series data pattern. C. It is used to indicate the range of acceptable values.
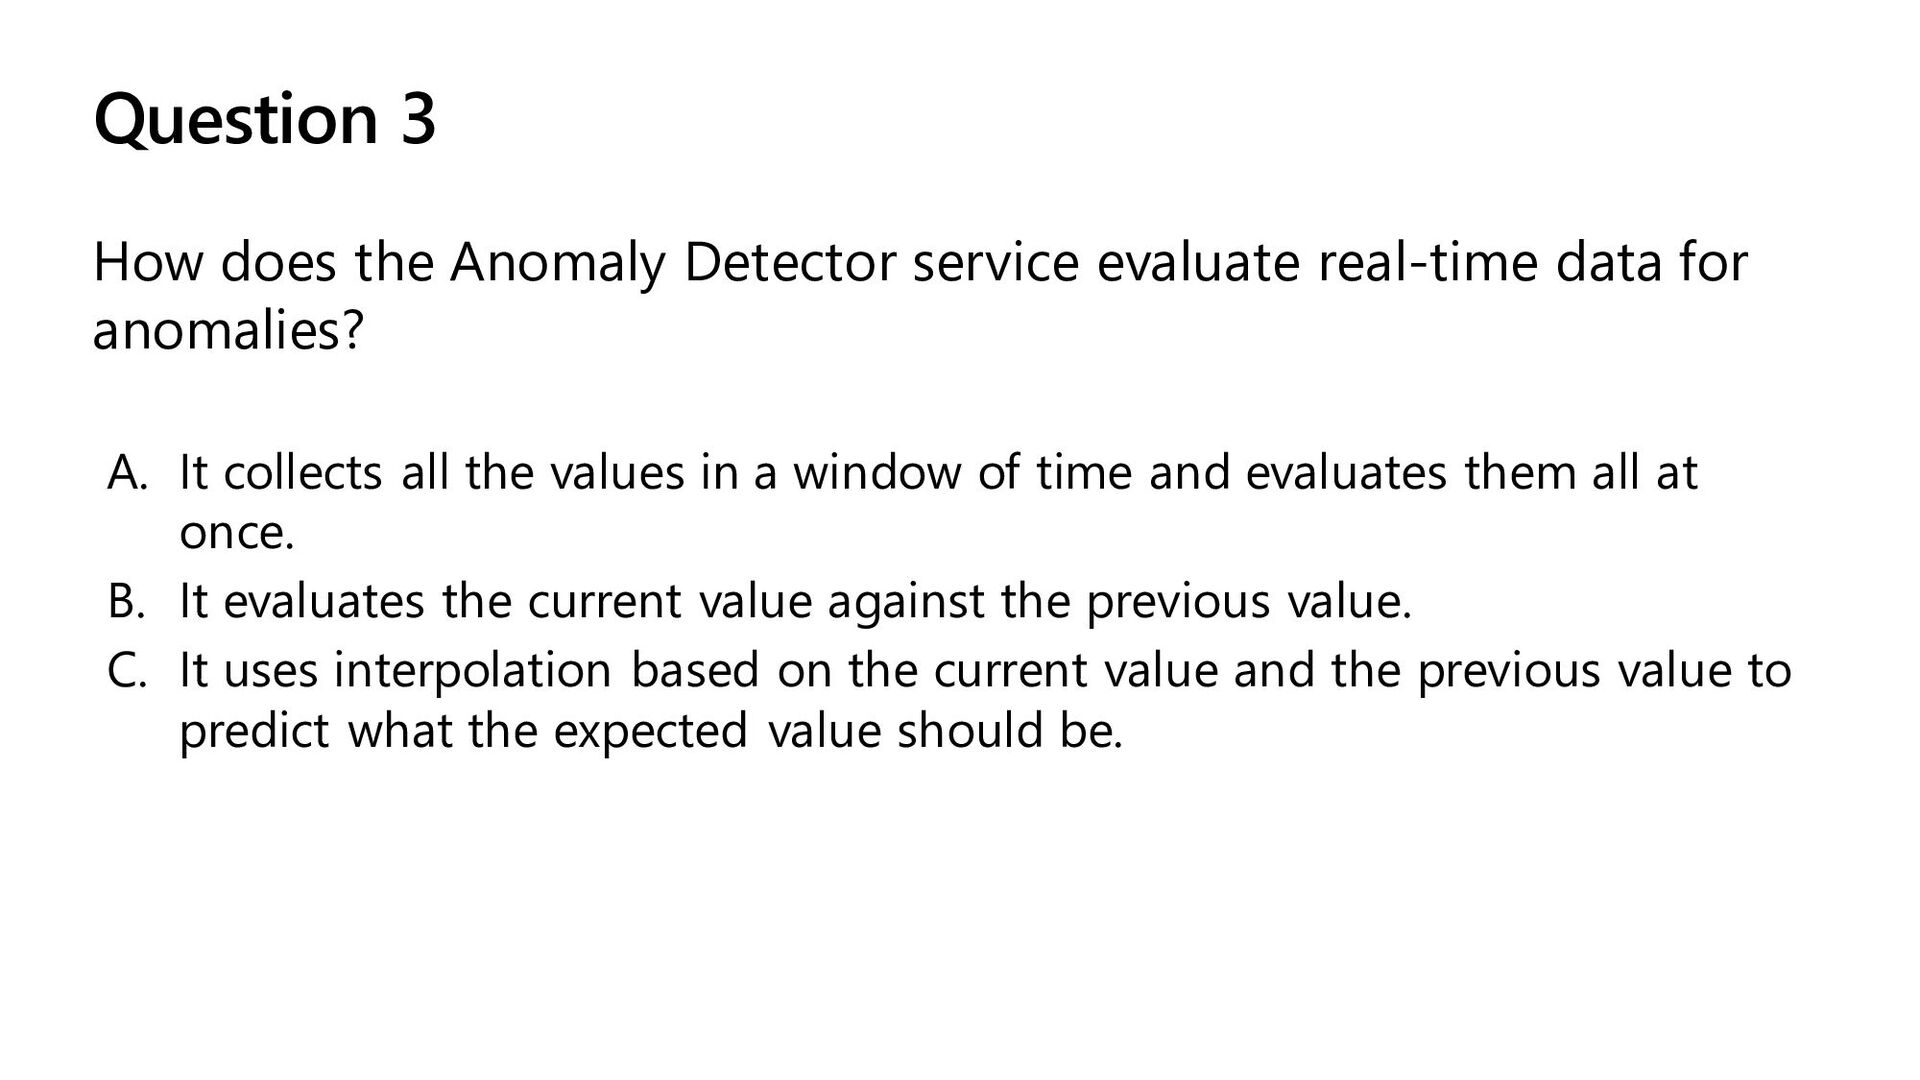
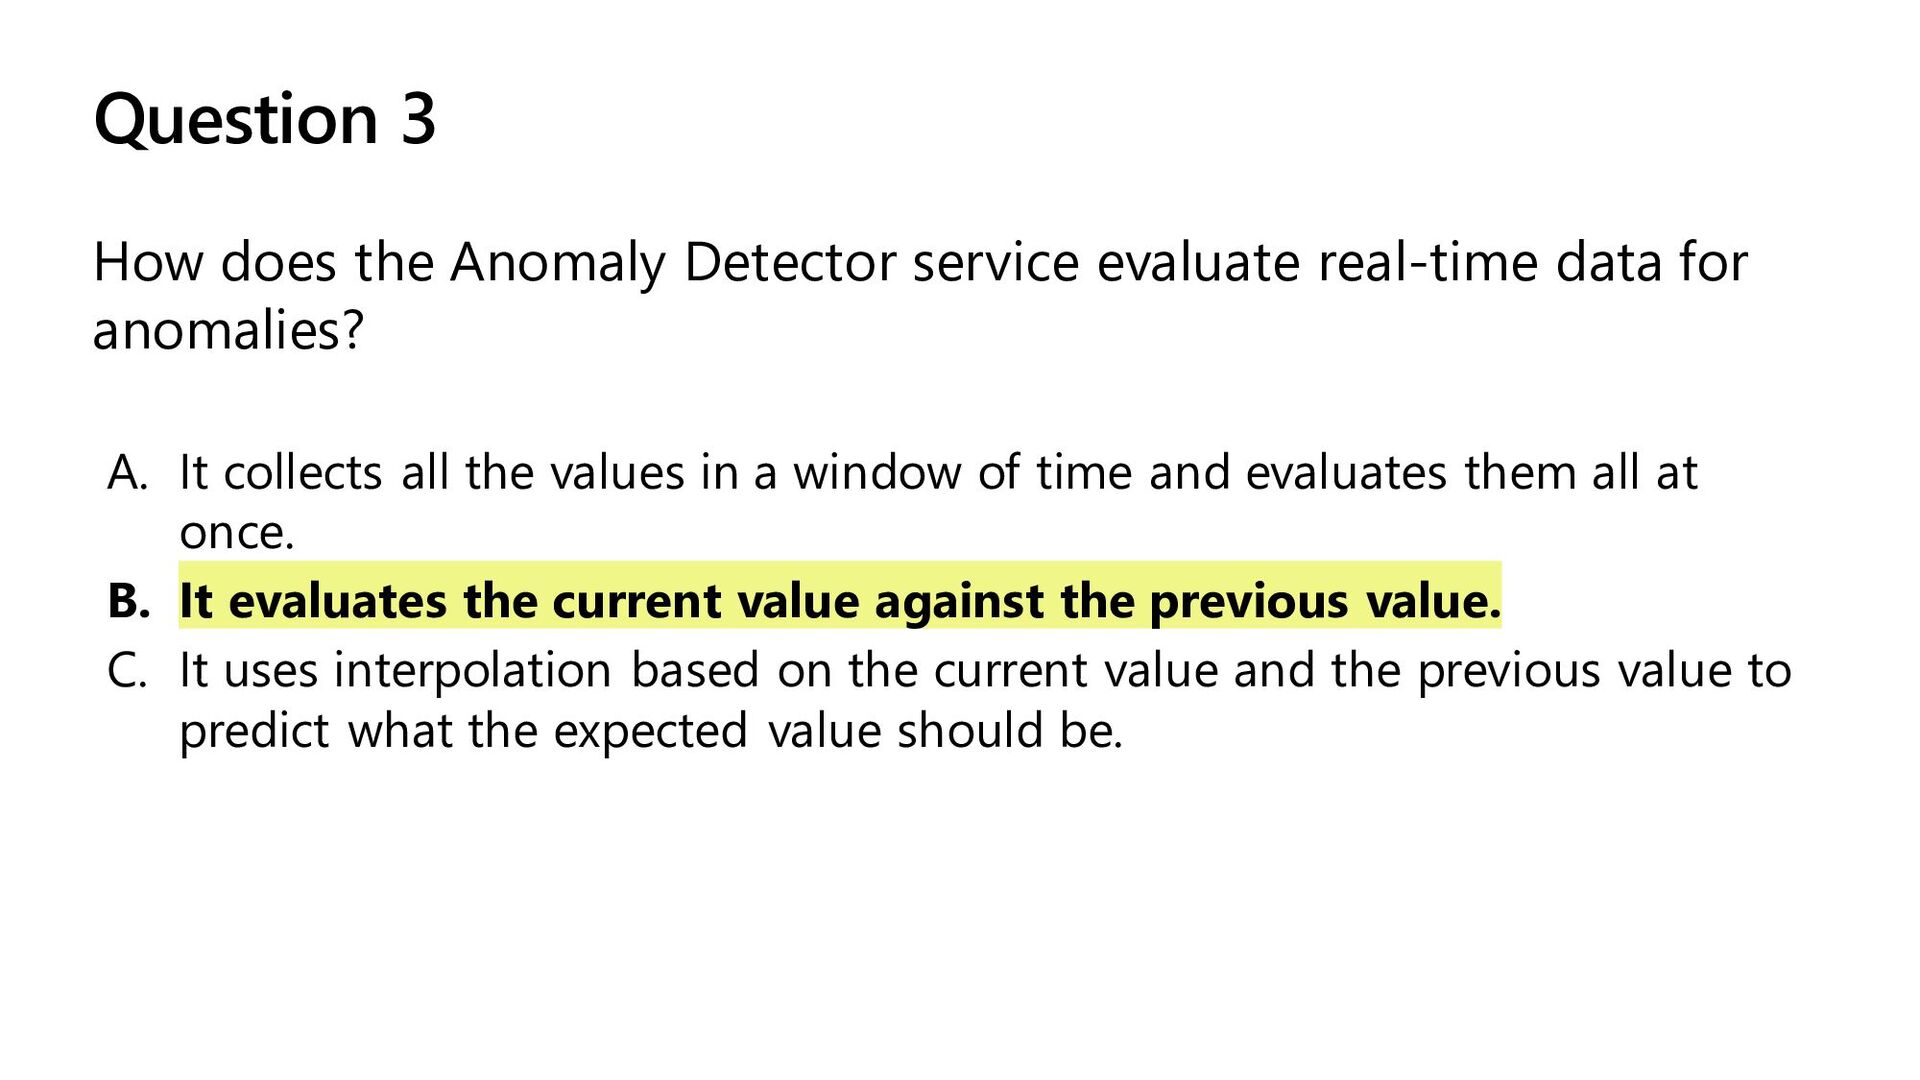
data for anomalies? A. It collects all the values in a window of time and evaluates them all at once. B. It evaluates the current value against the previous value. C. It uses interpolation based on the current value and the previous value to predict what the expected value should be.
data for anomalies? A. It collects all the values in a window of time and evaluates them all at once. B. It evaluates the current value against the previous value. C. It uses interpolation based on the current value and the previous value to predict what the expected value should be.